FILUSDT

FIL/USDT 1W$5.48 is an almost guaranteed target — it has been reached every single time.
What happens next depends entirely on the strength of the trend.
If we break out above the triangle and hold above it, there’s a real shot at $20.
And if that level gets broken and confirmed — then we might even see a retest of previous ATH.
But those are already "moon targets", and by that point, it’ll be smart to secure profits and just let the rest ride — and see what happens. 🚀

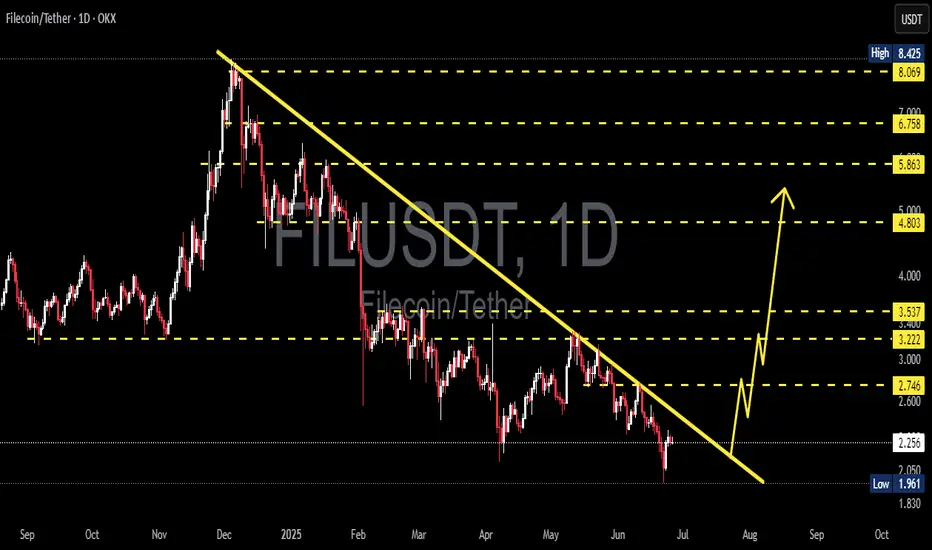
FIL/USDT – Major Trendline Breakout Imminent?The FIL/USDT chart is showcasing a significant descending trendline that has been respected since its peak in late December 2024. Price action has recently approached this trendline again, and a potential breakout scenario is forming. This setup may signal a major shift in trend after months of persistent decline.
🔍 Technical Analysis:
Trendline Resistance:
The long-term descending yellow trendline has capped every bullish rally since early 2025. A breakout above this trendline would be a major bullish technical signal.
Support Level:
Key horizontal support has been held at around $1.96, which has formed a strong base.
Potential Breakout Projection:
Upon breakout, $2.746 is the first resistance to watch.
A successful retest of this level could lead to a stair-step rally targeting:
$3.222
$3.537
$4.803
$5.863
$6.758
And potentially $8.069–$8.425 if momentum continues.
Bullish Pattern:
The projected move shows a potential impulse wave pattern following the breakout, indicating staged profit-taking zones for traders.
🧠 Strategic Consideration:
A daily candle close above the trendline with volume confirmation would be the first sign of trend reversal.
Conservative traders may wait for a retest of the trendline as support before entering.
Targets can be approached progressively based on price action near each resistance level.
⚠️ Risk Management:
Watch for fakeouts near the trendline.
A break below the key support of $1.96 would invalidate the bullish thesis.
FILUSDT 1D AnalysisFIL ~ 1D Analysis
#FIL This is the lowest support for now. Buy if you still have confidence in this coin with a short term target of at least 20%+ from this support.
Spot signalHello friends
As the price reaches the specified support level and buyers enter, you can see that higher ceilings have formed and you can take advantage of this opportunity and now buy with capital and risk management and move towards the specified goals.
*Trade safely with us*

FILECOIN - A less risky bet to make $$$FILUSD shows to be a good bet for the below reasons.
a. All time low reached on 07th Apr 2025 and will support the price.
b. Started showing Higher High and Higher Low on daily charts.
c. It is still the #1 decentralised storage network.
d. A huge potential for upside movement with current marketcap of $2B when compared to $12B at all time high.
e. Organisation adoption is significant. For example - The Internet Archive, a non-profit digital library, uses Filecoin for archival data storage (1000TiB). OpenSea, an NFT marketplace, uses it for NFT storage. Shoah project Starling Labs, an academic research lab, uses it for archival data (6000TiB)

FILUSDT — the formation is repeating, the structure is familiar.Filecoin(FIL) - is a decentralized storage system with the goal of "storing humanity's most important information." During its initial coin offering (ICO) in 2017, the project raised $205 million. The launch was initially planned for mid-2019, but the mainnet launch date was postponed until block 148,888, which occurred on October 15, 2020.
📍 CoinMarketCap : #50
📍 Twitter(X) : 667.3K
🔍 What I observe:
I’ve added the full trading history to the chart for better understanding (the chart on exchanges is cut off). The coin is liquid. I also added the prices for the public and private offerings.
There’s a large horizontal channel, or more specifically, a channel within a channel, which has been active for about 1111 days.
After another drop, a descending wedge formed, and now we are witnessing a breakout of its resistance (a retest is possible).
These patterns are ones I regularly track and trade, based on personal experience accumulated over the years and my strategy.
📊 I’ve plotted the nearest resistances and target prices with movement percentage calculations.
💭 It’s quite possible that this formation in the lower part of the wedge, coinciding with the area of lows on the support of the outer channel, was used to gather liquidity and shake out weak hands.
I also want to point out the large wicks in this zone - a characteristic pattern for accumulation points and subsequent reversals.
______
📌 Not financial advice. Observing structure and recurring phases.
Operate within your strategy and with an awareness of risks.

FILUSDT 1D Analysis FIL ~ 1D Analysis
#FIL Buy gradually from here if you still have confidence in this coin with a short term target of at least 15%+ from here.
FILUSDT 1W AnalysisFIL ~ 1W Analysis
#FIL Buy gradually from here if you still have confidence in this coin with a short term target of at least 20%+ from here.

Filecoin - Still in accumulationHello everyone, as you know if you follow me, one of the coins I’ve been accumulating for years is FIL. From both a technical and fundamental analysis perspective, I believe it’s the bet with the absolute highest potential in the crypto world. Speaking of my analysis, as you can see, we’re still in an accumulation phase for about 2-3 years now, with a range between $2.3 and $7-10. In recent weeks, we’ve seen a retest of the all-time low, and right now it’s testing the lowest monthly close of the previous cycle. That said, I expect a fairly rapid rise toward $7 soon, with the possibility that it finally breaks out of the range and starts running toward the previous ATH at $230. In any case, the risk/reward is truly excellent, probably the best in the entire crypto market. Thanks to everyone for your attention, and I hope the video is helpful for your analyses.

FILUSDTFIL is showing signs of a potential trend reversal 📊
Price has formed a higher low and is now approaching the key resistance at 2.485 USDT. A breakout above this level could open the way toward the next major zones around 2.887 and even 3.189 USDT 🚀
However, if rejection occurs, we might see a pullback toward the 2.272 USDT support area 🔁
Currently, momentum is leaning bullish and favoring a move higher, especially if the descending trendline gets broken with strength 💪

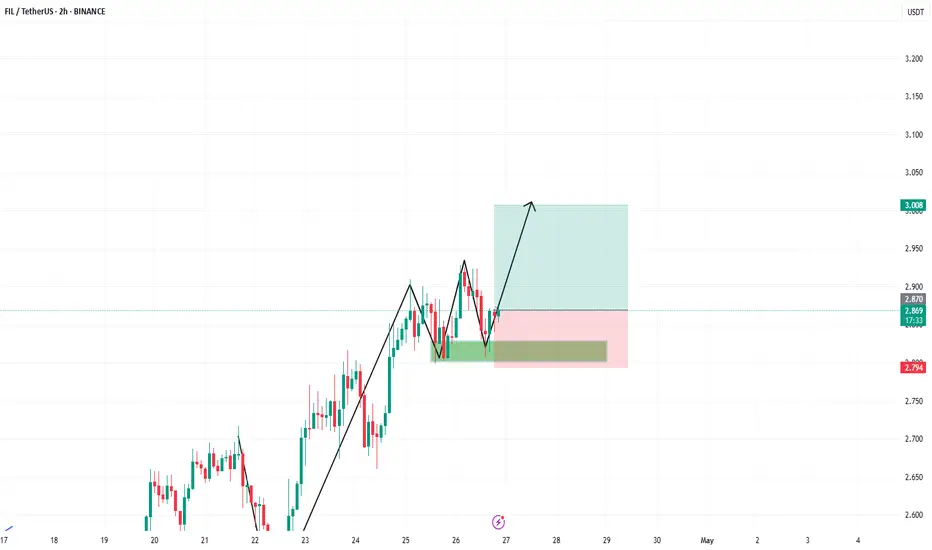
FIL bull-pollbakThe Filecoin ( BINANCE:FILUSDT ) chart, after a correction to $2.65, is attempting to pull back to the broken level around $2.77. If it fails to break this resistance, another decline towards support levels at $2.525 and then $2.39 is likely, which could act as a potential starting point for a new upward movement towards targets at $3.02 and $3.30.
🔑 Key Zones on the FIL Chart:
Primary Resistance: $2.77 (Pullback to broken level)
First Support: $2.525
Second Support: $2.39
First Bullish Target: $3.02
Second Bullish Target: $3.30

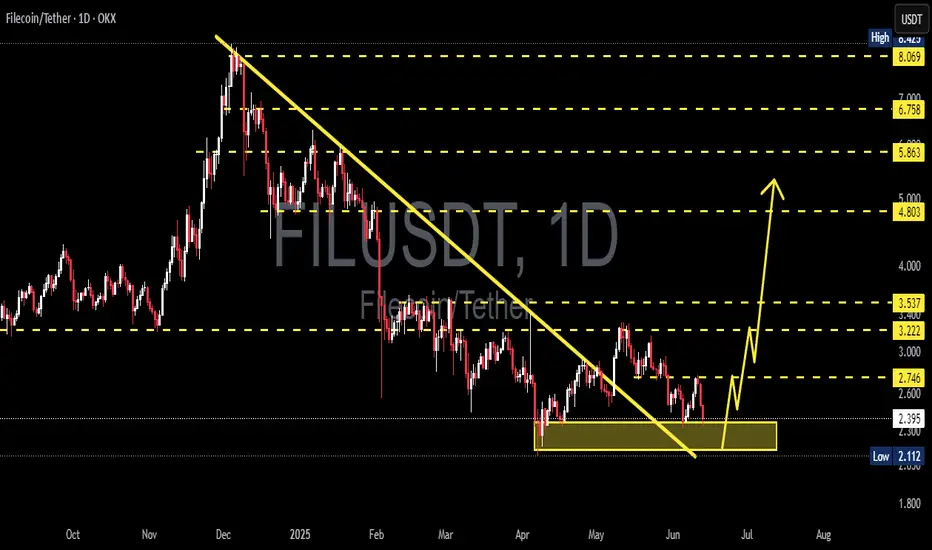
#FILUSDT - bottomed out!On the weekly timeframe, the downward trendline has been broken and successfully retested.
A strong move upward is just a matter of time…
Notice how it bounces hard every time it touches the support zone marked by the grey rectangle — this has happened three times in a row.
Also, FIL has been in an accumulation phase for around 1,092 days — that’s nearly 3 years.
$28 is a target I'm fully confident in for this coin.
Best Regards Cecilion🎯

FILUSDT Potential UpsidesHey Traders, in today's trading session we are monitoring FILUSDT for a buying opportunity around 2.60 zone, FILUSDT is trading in an uptrend and currently is in a correction phase in which it is approaching the trend at 2.60 support and resistance area.
Trade safe, Joe.

filNothing is visible in this channel at the moment
We had a bottom in the green box that was broken and I marked the end of its movement with the blue line. The end of the movement that can be considered for it in the medium term is the red lines
Now, depending on the market conditions, it is up to you to decide
And if a launch is to be made, the ceiling of the channel can be available in the first step
But any step-by-step purchase with controlled volumes, I think, can be appropriate in the reversals and place your stop below the blue line

#FIL/USDT#FIL
The price is moving within a descending channel on the 1-hour frame and is expected to break and continue upward.
We have a trend to stabilize above the 100 moving average once again.
We have a downtrend on the RSI indicator that supports the upward move with a breakout.
We have a support area at the lower limit of the channel at 2.60, which acts as strong support from which the price can rebound.
Entry price: 2.64
First target: 2.72
Second target: 2.78
Third target: 2.87

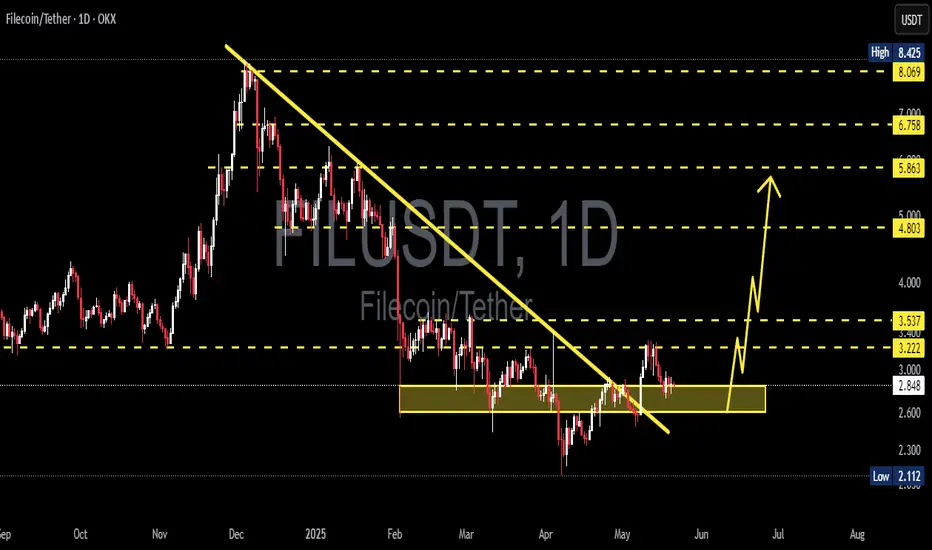
FILUSDT Analysis D1FILUSDT Looks Bullish So Far Falling Wedge Breakout, Retest Done, Horizontal Resistance Breakout, Retest Done, Another Trendline Breakout, Retest Done So Whats Next? In My Point Of View Rally Towards 5$ .

#FIL/USDT#FIL
The price is moving within a descending channel on the 1-hour frame, adhering well to it, and is heading towards a strong breakout and retest.
We are seeing a bounce from the lower boundary of the descending channel, which is support at 2.68.
We have a downtrend on the RSI indicator that is about to be broken and retested, which supports the upward trend.
We are looking for stability above the 100 moving average.
Entry price: 2.73
First target: 2.78
Second target: 2.86
Third target: 2.95

FILUSDT LONG/SHORTBy utilizing Fibonacci retracement levels, historical patterns, , we can formulate a hypothesis that the market might follow a similar trajectory if bullish sentiment prevails.
FILUSDT 1D AnalysisFIL ~ 1D Analysis
#FIL Buy after successfully penetrating this resistant line with a short -term target of at least 10%+ from here.

Filecoin Update: Yes, Bullish Confirmed!I thought I should look into Filecoin and guess what, I already did so 10 days ago. Here is an update.
Two weeks ago we got the bottom candle, 7-April, a hammer at the end of a down-move. A clear reversal signal.
This week is the third week green. Classic textbook confirmation of the hammer reversal. After the signal comes in, two weekly session moving positive will confirm this signal. And that's exactly what we have on the chart.
This week is green but notice the chart. Just look at it. Look at the current action and just how low prices are. The action is happening below the December 2022 low based on candle close. This means that we are still within bottom prices, the best possible entry prices ever; an incredibly opportunity; an amazing buy-zone.
Good news and bad news.
Good news is that prices are still low.
Bad news is that prices won't remain low for much longer, the market will grow soon and once it starts growing there is no second chance. The second chance is now, the first one was the 7-April low.
This is for you. What will you do?
Some pairs are already moving and I hate to buy when prices are higher, I love catching the bottom, it leaves no room for stress. When we buy when the action is happening, there tends to be a stop and as soon as prices drop, we become anxious because we don't know what will happen next.
When we get the bottom, it doesn't matter what happens we are always in the green, in this way, trading becomes fun, profitable and easy. This is an easy win.
» 2,400% potential is strong but still a conservative target. Cryptocurrency is set for something that cannot be described in simple words.
Total growth can amount to 1,000%, or even 500% and still, this would be amazing considering that other opportunities can result in devaluation rather than growth.
The entire market is set to grow on average between 10-30X. If the entire market grows on average between 5-10X, we will take it and be happy and grateful, as long as we win, we can continue to trade.
The market will not grow 5-10X, this is the growth that we experienced in the transition year, it will go much, much higher.
Thanks a lot for your continued support.
Namaste.

FIL TO THE MOON The patient is the biggest winner at the end of the journey. The journey is long, not just one day .

Bullish Sign FIL / USDTBreak and retest high and make a new higher low also there is a fake breakout on Weekly
Target : 3
Stop : 2.36
