UBS (UBSG): Too Big to Fail?Remember this analysis from over four months ago? We didn't place a limit order at that time (which is why it's greyed out), but if you followed our setup during the livestream back then, congratulations! The chart reacted beautifully at the desired level, just as we anticipated.
In my opinion, this is a great-looking chart, showing a strong reaction at a key level. I'm now looking for some long plays on UBS to gain some exposure to the Swiss market. UBS is a relatively safe stock, which is a good thing to have during phases of uncertainty.
The worst-case scenario would be a banking crash, but we believe UBS is still too big to fail. As long as it maintains this status, we like it. I'll send out a limit order once I find a good setup. For now, I wouldn't recommend any FOMO into this stock, as it could be a dead cat bounce, but we'll closely monitor it for you.
Finance

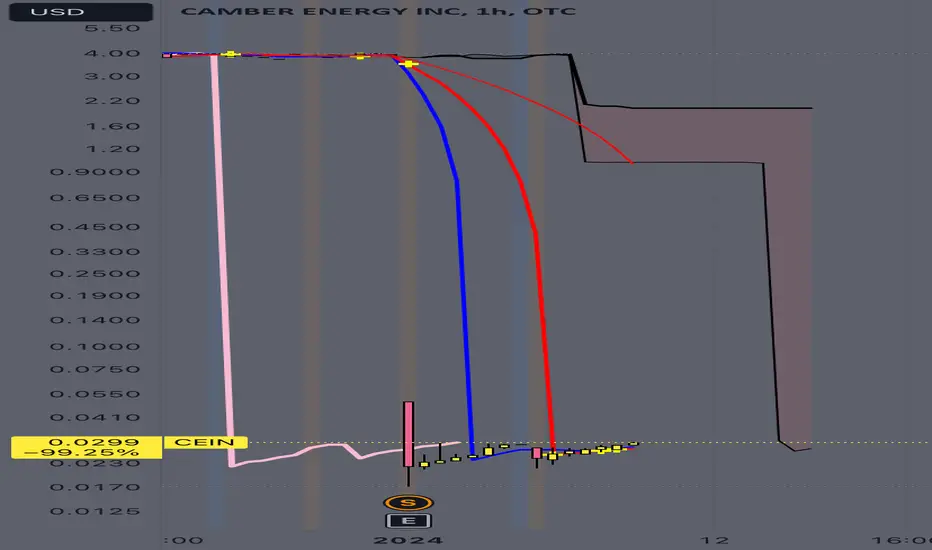
Bullish on CeinI believe CEIN has sufficient finances, and technical indicators to suggest that it’s preparing to rise in price rapidly. At a 5 million dollar market cap; its undervalued. I wouldn’t be surprised by a 750 million dollar evaluation by 2032. I currently hold no shares, but I’ll start purchasing soon.
BTC Dips to 58K: Accumulation Time?GM crypto bro's, happy working day! This morning, BTC finally dropped to the 58K area, as mentioned in previous market updates. The fear and greed index is at 25, indicating extreme fear, while the stoch RSI is at 56, with the potential to continue rising towards the oversold area.
Currently, 58K is a good zone for accumulating Bitcoin, given the extreme fear in the market. There’s still a possibility for BTC to drop further, perhaps to the 57K-56K range, but the probability of this is only about 30%, with a 70% chance of pumping to the 65K area.
But keep in mind, the market is dynamic—don't get caught up in FOMO, stay safe, keep calm, and always remember that anything can happen in the crypto market.
Always manage your risks, and as always, that’s all for today’s crypto update. I’m Akki, signing off. Have a nice day.

BEARISH BAT BTCUSDTHello guys, this is my personal opinion on BTCUSDT, am expecting a small dump kindly watch the video to discover why.
Remember trading or investing in the financial market carries huge risk, so do not trade or invest with an amount you can't afford to loose. as always this is not a FA.


BTC: Sideways or Pump Ahead?GM crypto bro's, happy weekend! This morning, BTC is still moving sideways. The fear and greed index is at 39, indicating fear, while the stoch RSI is on its way to the overbought area.
Overall, our targets remain the same as yesterday: a chance for a correction to the 58K area followed by a pump to 65K, or maybe even an instant pump to 65K—after all, anything can happen in the market.
But let’s see how the market makers will draw the BTC chart going forward. Always manage your risks, and as always, that’s all for today’s crypto update. I’m Akki, signing off. Have a nice day.

BTC Weekend Moves: Correction or Pump?GM crypto bro's, happy weekend to those on vacation, and stay strong for those still working like me. Okay, this morning BTC has started to correct as I mentioned in yesterday's market update. The fear and greed index is at a neutral 40, while the stoch RSI has exited the oversold area and is heading towards overbought.
From a price action perspective, my outlook this morning is that BTC still has a chance to continue its correction to around the 58K area, while the nearest target for a pump is in the 65K area.
But let's see how the market makers will draw the BTC chart going forward. Always manage your risks, and as always, that’s all for today’s crypto update. I’m Akki, signing off. Have a nice day.

BTC Hits 58K! What's Next for the Weekend?GM crypto bro's, as I mentioned yesterday, BTC has pumped back up and even surpassed our 58K target. The fear and greed index is now at a neutral 48, while the stoch RSI has successfully exited the oversold area.
As we approach the weekend, there’s a possibility for BTC to retest the 58K - 60K area. But keep in mind, the market is dynamic. Don’t be FOMO, stay safe, keep calm, and always remember that nothing is impossible in the crypto market. Anything can happen.
Always manage your risks, and as always, that’s all for today’s crypto update. I’m Akki, signing off. Have a nice day.

BTC Fear Index Rises! Is Recovery in Sight?GM crypto bro's, this morning, the fear and greed index has increased from yesterday's 17 (extreme fear) to 29 (fear). The stoch RSI is also starting to show signs of recovery from its oversold area.
Overall, the outlook remains the same as yesterday. Our target for BTC is to retest the 58K area first. Like always, keep in mind the market is dynamic. Don't be FOMO, stay safe, keep calm, and always remember that nothing is impossible in the crypto market. Anything can happen.
Always manage your risks, and as always, that's all for today's crypto update.
I'm Akki, signing off. Have a nice day.

Extreme Fear! BTC Fear Index Drops to 17! What's Next?GM crypto bro's, finally, the market has slightly calmed down this morning after our portfolios got nuked yesterday. Keep staying strong, guys.
Okay, this morning's update: the fear and greed index has dropped back to 17 (extreme fear), while the stoch RSI is still dead like yesterday. In terms of price action, BTC has a small chance to visit around the 58K area and then go sideways in the 57K - 56K range. Hopefully, there won't be any more crazy drops. The long candle on 05/08/2024 has already claimed many casualties.
There is a possibility that the current market drop is part of a plan by big money, whales, etc., to buy the dip on a massive scale, considering the growing rumors that Grandpa Powell from the FED might cut interest rates in September.
Like always, keep in mind the market is dynamic. Don't be FOMO, stay safe, keep calm, and always remember that nothing is impossible in the crypto market. Anything can happen, even the impossible.
Always manage your risks, and as always, that's all for today's crypto update.
I'm Akki, signing off. Stay sane, my liquidated friends, and have a nice day.

Fear & Greed Index Plummets as BTCUSD Dumps SignificantlyGM Crypto Bro's, this morning BTC dumped significantly, causing the Fear and Greed Index to drop to 26 (fear). The Stoch RSI is still resting in the oversold area.
There is a big chance for a drop into the red zone around the 50K area, but there is also a small chance for a pump in the nearest blue zone.
As always, keep in mind that the market is dynamic. Don't be FOMO, stay safe, keep calm. Remember, anything can happen in the crypto market these days. Maintain your risk, and that's all for today's crypto update. I'm Akki, one chart, and have a nice day

Rocket Companies (RKT) AnalysisCompany Overview:
Rocket Companies, a fintech mortgage loan originator, entered 2024 with strong momentum. CEO Varun Krishna highlighted top-line growth acceleration for the third straight quarter and the highest profitability in two years, along with expanded market share in both purchase and refinance sectors. The company is leveraging its proprietary AI tech stack for future growth, aiming to modernize the fragmented homeownership space.
Institutional Interest:
Investor confidence is evident, with the Swiss National Bank increasing its stake by 4.1% in Q1, now holding 237,000 shares.
Financial Performance:
Rocket Companies reported an adjusted revenue of $1.2 billion in its latest quarterly report, exceeding guidance and marking year-over-year growth acceleration for the third consecutive quarter.
Investment Outlook:
Bullish Outlook: We are bullish on NYSE:RKT above the $13.00-$14.00 range.
Upside Potential: With an upside target set at $20.00-$21.00, investors should consider Rocket Companies' impressive financial performance and strong institutional interest as key drivers for future stock appreciation.
📊🏡 Monitor Rocket Companies for promising investment opportunities! #RKT #FintechStocks 📈🔍

DXY H4 - Long Signal DXY H4
Again, nothing too significant to report at the moment, whilst we are hugging 104.00 we remain bullish bias, it's as simple as that. DXY correlates primarily and fundamentally with FX rather than XAUUSD commodities. But we can still use for comparisons and indications.
Hopefully this 104 level holds as anticipated support to warrant GBPUSD rejections as previously shared.

XAUUSD M30 - Sell Signal (trend)XAUUSD M30
As we can see actively, we are trying to break south of the previous area of M15 and M30 consolidation. Depending on how we trade as we settle in to the EURO/LON session, we may look to trade something on a similar basis to this M30 trend. Something similar to that indicated with the red arrows.
M30 LTF trend entries, or $2390/oz major resistance swing entry. It's obviously very early on in the week, and I'd like to see us settle into the week more, before jumping in to anything.

Premium Gold idea !!! we are back $$$ bear bear "Success is not defined by how many times you fall, but by how many times you rise after falling."
Entry: I will let you guys choose
SL: never forget stop loss
Target: I will let you decide this also
I'm only concerned with the direction with a 4hr period
There is 2 more hours left until another analysis 8am est

India's inclusion in the JPMorgan Index is set to unlock billionBig Win for India: Indian government bonds are now included in JPMorgan's emerging markets index, a first for the world's fastest-growing large economy. This move is expected to trigger significant foreign investments, reshape India's financial landscape, and boost economic growth.
Opening the Doors: The inclusion grants India a 10% share in the index, following the 2020 relaxation of foreign ownership restrictions. Analysts predict an additional $30 billion inflow over the next ten months, potentially raising foreign ownership from 2% to 5%.
Market Reactions: The yield on Indian bonds has already decreased, reflecting rising prices. However, bureaucratic hurdles remain a challenge for some investors.
Positive Outlook: Despite recent political developments, India's economic outlook is strong. S&P Global is considering a credit rating upgrade, and India offers a good yield premium with strong growth and favorable inflation.
Future Potential: India's bond market is poised for further growth with potential inclusion in additional benchmarks like the Bloomberg EM Local Currency Government Index and FTSE Russell.
Managing Volatility: The Reserve Bank of India is confident in its ability to manage potential market volatility due to the country's substantial foreign reserves exceeding $650 billion.
Overall, this inclusion marks a watershed moment for India's financial market, attracting foreign capital, lowering borrowing costs, and propelling economic growth.

Nurix Therapeutics (NRIX) Analysis Clinical Milestone:
Nurix Therapeutics NASDAQ:NRIX , a clinical-stage biotech company, achieved a significant milestone with its NX-5948 leukemia drug, showing a 69.2% positive response in a trial for relapsed or refractory chronic lymphocytic leukemia (CLL). Needham analyst Gil Blum praised these results as a "clear win."
Strategic Collaborations:
Nurix is also advancing collaborations with major pharma companies. It is set to nominate a development candidate with Sanofi this year, positioning it for substantial breakthroughs. Additionally, Gilead Sciences extended its research collaboration with Nurix by two years, highlighting Nurix's robust R&D capabilities.
Investment Outlook:
Bullish Outlook: We are bullish on NRIX above the $15.00-$16.00 range.
Upside Potential: With a target set at $30.00-$31.00, investors should consider Nurix's promising clinical results and strategic partnerships as key drivers for potential stock growth.
📊🧬 Monitor Nurix Therapeutics for promising investment opportunities! #NRIX #Biotech 📈💊

Power Finance, Target Reached, 295 % Profit _ Complete AnalysisIn Power Finance Corporation a "Symmetrical Triangle Pattern" formed and Breakout, Reached the Target. Buy in February 2023 at the Price of 113 rupees and Sell in January 2024 at 450 rupees. This Result in a Total PROFIT of 295 % within a Year (11 months).

ONDO ondo What are the limits and potential for Ondo presently? I have no idea about this company only the fact the price is holding up excellently.

BTC/USD Short position #1Price reacted to the higher timeframe supply zone and it breaks the bullish trendline.
Now we have a fresh FTR zone - $70398 / $70948 .
any reactions to this zone my be a good chance to enter a short positions

BAJAJFINSV BREAKOUT ?Weekly Breakout possible .
Triangle Pattern.
Good for Long term.
Do Like ,Comment , Follow for regular Updates...
Disclaimer : This is not a Buy or Sell recommendation. I am not SEBI Registered. Please consult your financial advisor before making any investments . This is for Educational purpose only.

Bullish DXY Awaits U.S. Interest Rate DataThe U.S. Dollar Index (DXY) remains in bullish territory, with buyers maintaining control as investors eagerly await the release of U.S. interest rate data.
Context
The focus is squarely on the Federal Reserve (FED), and markets are hanging on any hints regarding the future of interest rates. While no rate changes are expected, analysts are alert for any signals indicating a slowdown in rate hikes.
Inflation Reports
Last week's stronger-than-expected inflation reports have led market participants to revise their expectations for rate cuts this year. Traders now estimate that monetary easing will be around 75 basis points over the course of the year.
Key Levels
At the time of writing, the DXY is trading at 104.08 points, marking the ninth consecutive daily gain since its March 8 low at 102.32. Key technical levels include:
1. Next Resistance (104.77): This level corresponds to the triangle pattern's upper boundary on the daily chart. A breakout above this level could open the door to further gains.
2. 38.2% Fibonacci Resistance (105.07): If the DXY manages to surpass this mark, it could strengthen its bullish position.
3. 50% Fibonacci Support (102): This level acts as a floor for DXY's price and could be crucial in case of corrections.
Note: The information provided in this article is for informational purposes only and does not constitute financial advice. Always consult a professional before making investment decisions.*

History of Bitcoin: The Underdog That Rewired FinanceBitcoin, a phenomenon that emerged at the onset of the 2008 financial crisis, has changed the way we think about money. To celebrate the token’s $73,000 milestone, we trace its origin story and look ahead into the future. To infinity… and beyond?
Table of Contents
A Financial Product Too Big to Ignore
Born in 2008 as the World’s First Cryptocurrency
The Very Early Days of Trading on Exchanges
The Volatile Phenomenon That Sparked a Change in Finance
A Place to Find Value in the Face of a Global Pandemic
Cryptocurrency Trading Lands on Wall Street
What’s Coming Next for BTC Price as We Move Deeper into 2024?
Bitcoin for Your Thoughts?
📍 A Financial Product Too Big to Ignore 📍
Bitcoin’s story is the story of an underdog that pushed through volatility and disbelief, but also dashed forward riding on hope and enthusiasm.
Bitcoin ( BTC/USD ), the world’s largest cryptocurrency, has so far managed to survive and overcome each one of its many pitfalls and obstacles thanks to its novelty, mystery, and investment appeal. Not only that, but the orange coin has progressed so remarkably, it has risen to rival the valuation of the world’s biggest companies.
As we’re about to close the first-quarter chapter of 2024, we take a closer look at what has fueled Bitcoin’s price to record levels about $73,000 a pop.
To celebrate the token’s historical milestone of $73,000 , we go back to its creation, tracing major development milestones. From wiping out billions of dollars from its valuation to logging stratospheric gains, Bitcoin’s history is nothing short of a miracle.
Today, Bitcoin boasts a valuation of more than $1.4 trillion. In other words, more than double as electric carmaker Tesla (ticker: TSLA ), founded by the uber-rich eccentric engineer Elon Musk.
With great power, comes great interest from Wall Street. A bunch of spot Bitcoin ETFs are now strutting among asset managers, finding their way to ordinary (and some degen) investors and money-spinning professionals alike.
📍 Born in 2008 as the World’s First Cryptocurrency 📍
The history of Bitcoin is relatively short. But it can sting. Because we were all playing games or being 8 years old instead of buying Bitcoin at 4 cents.
Back in 2008, the financial system crumbled under the pressure of a global crisis. A collapse in the housing market led to millions of homeowners not being able to cover their mortgage payments.
About that time, an individual—or a group of people—called Satoshi Nakamoto, concluded the banking system was not reliable. A new asset class emerged—one that did not need the intervention of banks to function.
Bitcoin, as it was called in the white paper released in November 2008 , was born. Essentially, Bitcoin represented a new type of money. An innovative software system that intended to rewire the worldwide financial system.
Bitcoin sprouted to life as an open-source software running on a peer-to-peer network called blockchain. One way to think of Bitcoin is to see it as an electronic form of physical cash without gatekeepers such as banks. The participants in the decentralized network are responsible for the verification of transactions, and all transactions are visible for the public.
📍 The Very Early Days of Trading on Exchanges 📍
Once it was born, Bitcoin stayed confined to a small network of only a few computers (and the early adopter group of ultra-niche geeks). Then, mining Bitcoin was able to get you hundreds or even thousands of coins in a few days’ time due to the low level of computing power required. Safe to say, the first people to play around with Bitcoin had no idea the tiny orange-themed gig will turn into a fire-breathing $1.3 trillion dragon.
Instead, the squad of core developers would try and make the network operate as smoothly as possible. Once this was achieved, Bitcoin hit its first exchange in 2010. The first Bitcoin to be transacted on an exchange was worth zero dollars. Then at the peak of 2010, one Bitcoin reached a record high of 39 cents.
Since then, the price of Bitcoin has experienced a wild ride as millions of people have onboarded the crypto bandwagon. Hundreds of exchanges have opened and traders today reach daily volumes of tens of billions of dollars exchanged in Bitcoin.
Bitcoin's mind-blowing price increase from its first steps through March 12, 2024 - Source: TradingView
📍 The Volatile Phenomenon That Sparked a Change in Finance 📍
It did not take much for Bitcoin to be noticed as a wonder of technology and a catalyst for change. Once it landed for trading on its first cryptocurrency exchanges, Bitcoin quickly gained popularity purely from an investment perspective.
The first traders would buy and sell the token in a matter of hours only to realize a small profit and savor the rush of adrenaline. This same speculative behavior could still be found today even after the stratospheric gains that have made Bitcoin a heavyweight in terms of valuation.
The price gyrations have crushed many traders and investors who were found unprepared to stomach the aggressive swings. Along the way, Bitcoin has endured over 17 selloffs of more than 30%. It has been through six declines of more than 60%, and four of more than 80%.
Still, after all these spectacular drops, Bitcoin has clawed back its losses and returned stronger than ever. So strong, it crushed all doom-and gloom forecasters and permabears when it blasted through the $73,000 threshold in March of 2024. Not long before that, Bitcoin had a chance to prove its worth as a safe haven in troubled times.
📍 A Place to Find Value in the Face of a Global Pandemic 📍
It’s important to mention that the current record high in the price of Bitcoin arrived after BTC’s previous peak of $69,000 in November 2021. Back then, the coronavirus crisis, which hit in March 2020, turned out to be a key period of growth for crypto.
The original digital currency served as a safe haven and a store of value—digital gold, if you like, or better—amid lingering uncertainty in the broad financial markets. In numbers, during the pandemic’s low point in March 2020, one Bitcoin was worth about $3,900.
Presently, a single Bitcoin is up more than 1,700% from its coronavirus-fueled meltdown.
The pandemic helped shift investor focus on the crypto market as participants sought to find pent-up value. The search has led to millions of Bitcoin proponents flocking to the digital asset. In practice, the interest to invest in Bitcoin has been so big, the top cop on Wall Street—the Securities and Exchange Commission—finally gave its nod.
📍 Cryptocurrency Trading Lands on Wall Street 📍
The big dogs on Wall Street welcomed the first Bitcoin-centric products to trade alongside stocks , bonds , and forex . More specifically, there are now eleven exchange-traded funds (ETFs) offering spot Bitcoin, or the real deal, unlike Bitcoin futures, which don’t hold genuine BTC. The step is a monumental milestone in Bitcoin’s path toward mainstream adoption and acceptance in the financial markets.
The eleven Bitcoin ETFs , approved by the Securities and Exchange Commission, were greeted by investors with billions of dollars injected. Giant asset managers such as BlackRock and Fidelity are seeing overflowing demand for Bitcoin from both institutions and retail investors.
The positive thing about these spot BTC ETFs is that they’re backed by the physical asset. Whenever inflows start to outpace liquidity, the asset manager needs to purchase new Bitcoin and add it to its reserves. The more the net inflow, the more it needs to buy BTC. And that drives prices higher.
From inception in January to March 2024, BlackRock’s BTC ETF hit $10 billion—faster than any US ETF ever.
📍 What’s Coming Next for BTC Price as We Move Deeper into 2024? 📍
Looking ahead into 2024, there is no doubt that we are going to see new bouts of volatility. More than that, many are optimistic we will continue to see a string of fresh records in the price of Bitcoin. With this in mind, the risks will be there too.
Both new and old, market participants need to know that price swings may be stomach-churning as the market adjusts to shifting moods in the rarefied air of $70,000.
Buying at the top is scary.
📍 Bitcoin for Your Thoughts? 📍
How did you first get exposure to Bitcoin? When did you buy your first piece of the crypto and are you brave enough to buy again at the top? Let us know in the comments!
Liked this article 🚀? Give us a follow to get notified for any future releases!
With 💖, TradingView Team
