Bitcoin's Weekly Chart That Speaks For ItselfWhile we can appreciate the power of hodling at a glimpse, take a closer look at the RSI and the higher lower trend formation.
Probably nothing. =)
Finance

unn is going to zerovery sad. So much potential. Charts don't lie though. Bonded is going to zero as well but I don't have the energy to do ta on that one.

GBPJPY H4 - Short SetupGBPJPY H4
151.000 is a strong whole number for this trading pair, it's a key trading zone which has held on the last 2 counts as resistance.
100 pips from 151 short to 150, and another 100 pips from 150 down to 149. Solid trading ranges, with measurable targets and risk projections.

SOFI bottom inNASDAQ:SOFI
$SOFI most probably found it's bottom, looking at a bounce from the trend-line. Too much FUD out there at the moment so we'll see but I'm accumulating heavily at these levels. Fundamentals remains strong.

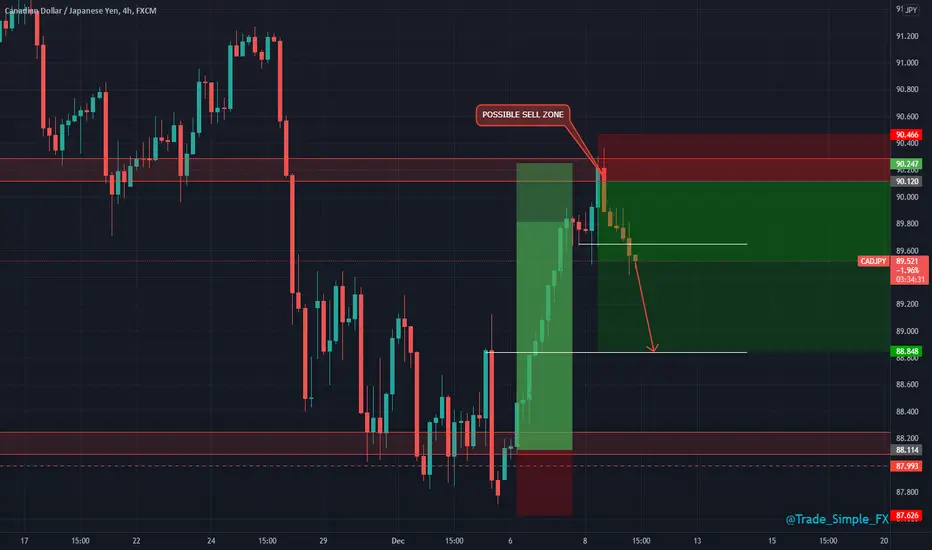
CADJPY H4 - Short SetupCADJPY H4
Snapshot of next anticipated move for this trading pair, seeing some really nice corrective selling pressure from our marked zone, hopefully we correct down to at least 800 price with the same momentum.
GBPJPY H4 - Short SetupGBPJPY H4
Possible second resistance test at that 151 whole number may set us up for some decent short opportunity. Lower lows are still flowing, nice correction 'give back' from the YEN yesterday.
Eyes for moves to catalyse this setup further. This would then correlate and compliment the above CADJPY setup further.

AN UPMOVE OF 3.77% IS BEING EXPECTED IN AARTI INDUSTRIESOn the 1 Hour Chart of AARTIIND, we can witness a beautiful Bullish Reversal Pattern Formation of "Bullish Harami" on the downside levels. Thereby, we are expecting a bullish momentum in the stock in the upcoming trading sessions. Where the stock is being expected to initially face a resistance at the levels of 965.85, 977.20, and 995.15. In addition to this, the stock may face a support at the level of 947.10. Closing Price (as on 06.12.21) : 958.90
Disclaimer: No financial information whatsoever published here, should be construed as an offer to buy or sell securities, or as advice to do so in any way whatsoever. All matter published here is purely for Educational and Information purposes only and under no circumstances should be used for making investment decisions. Viewers must consult their personal financial advisor before making any actual investment decisions, based on information published here. Any Investor or Trader taking decisions based on any information published here, does so entirely at its own risk. Investors and Traders should bear in mind that any investment in Stock Market is subject to unpredictable market-related risks.

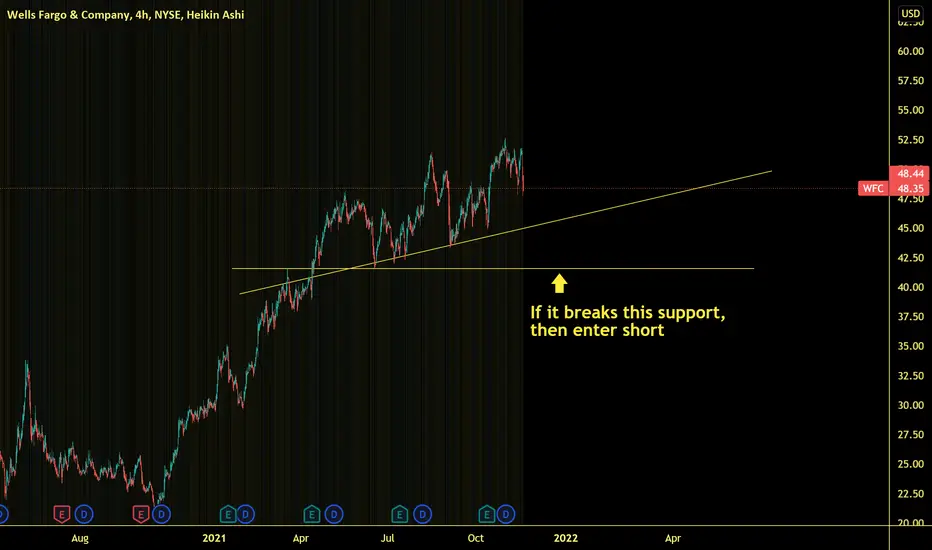
Set alert for WFCIf WFC breaks this support line then it's confirmed trend reversal to the downside.
I only enter trades once they meet my conditions.
Would prefer to enter a leap put options on this one and ride the fall out as WFC is a bit of a slow mover.
Slow-moving stocks require long expiry contracts to medicate theta decay.
So set an alert for that support line.
$GME | 11/25 | Watchlist #1 $GME +$220 / -$210
(Over $220 for calls)
(Below $210 for puts)
Price targets:
Bull case: $228
Bear case: $205
Technical analysis:
Bull case: Bounce off the trendline
Bear case: Double top on the daily chart

$PYPL - Has never been oversold this much since IPOLong term investor should Dollar Cost Average.
200Day moving average is imminent.

GBPUSD H4 - Short SetupGBPUSD H4
Multiple confluences stacked at this 1.35 handle, first of all we have that psychological 1.35 number, key area of H4 support/resistance and also a healthy fib pullback from the latest swing high down to swing low.
A solid measurable 5R down to 1.33, a breach of 1.34 has already been seen. Alerts set and eyes peeled.

BITCOIN | Approaching The Rejection Area But Stay Cautious!Hi,
After a kind of "fake" ATH, the price of Bitcoin has started to grind downwards. A couple of small sell-offs has brought the price to around 60k. Here you should be quite cautious but still, you cannot miss this opportunity to jump in. Quite good criteria matching around $58k - $61k which might help to find support leading into another push upwards.
You cannot miss it but you have to use stops or you should be ready that the price of BTC can turn nasty within hours because of the short setup. It basically knocking behind the door.
So, if a Daily candle closes below the shown areas then the selling pressure turns quite strong.
Firstly, let's wait for a rejection upwards but you have to be open-minded to turn your bias around quite quickly - at least short-term perspective. Use stops if you are a short-term investor, be ready to load from lower prices if your investment horizon is long-term.
Regards,
Vaido

AUDCAD H4 - Long SetupAUDCAD H4
Nice trade possibility here for AUDCAD. Looking for a rejection as indicated with the path arrows. A pullback to that 0.92 whole number support would be great to gear us up for long entries towards 0.93350 ish.

$MQ we've hit our first take profit*This is not financial advice, so trade at your own risks*
*My team digs deep and finds stocks that are expected to perform well based off multiple confluences*
*Experienced traders understand the uphill battle in timing the market, so instead my team focuses mainly on risk management*
My team entered $MQ on November 9, 2021 at $26.5 per share where we set $30 as our first take profit. We quickly hit this take profit when $MQ hit its high for the day in the morning at $30.28. Things however took a turn for the worst when a parent company began slowly unloading shares throughout the trading-session. Shorts took advantage and had a field day. These factors are what lead up to $MQ closing red today at $23.75.
Tomorrow should be very interesting for $MQ. Pre-IPO shareholders will be able to sell their shares due to Marqeta's lock-up period expiring after today. We however have no reason to believe that shareholders will sell their shares due to $MQ being under its IPO price. It just wouldn't make any sense. Especially considering the companies spectacular 3rd quarter earnings beat from yesterday where they reported a net revenue of $132 million.
My team made a gain of 13% from the shares we sold this morning at $30. Going forward we will continue to observe $MQ for additional buying opportunities.
Congrats to those of you who took this trade with us.
FIRST ENTRY: $26.5
TAKE PROFIT 1 (HIT): $30
TAKE PROFIT 2: $33.5
If you want to see more, please like and follow us @SimplyShowMeTheMoney

$MQ the future of finance*This is not financial advice, so trade at your own risks*
*My team digs deep and finds stocks that are expected to perform well based off multiple confluences*
*Experienced traders understand the uphill battle in timing the market, so instead my team focuses mainly on risk management*
For the last couple of weeks my team has been analyzing digital finance company Marqeta $MQ. $MQ has developed a card issuing platform that provides clients such as Coinbase, Doordash, and Square with the infrastructure and tools necessary to offer payment options without the involvement of a traditional bank. $MQ generates the majority of its revenue through transaction fees for cards issued on its platform.
On August 11, 2021 $MQ released its earnings for the second quarter ending June 30, 2021. In this earnings report $MQ showed a 76% percent jump in net revenue driven by customer growth. $MQ also reported a net revenue of $122 million. $MQ however responded to this earnings beat by downtrading for the next couple of weeks. Before this report was released we must acknowledge the fact that $MQ was trading in an uptrend prior to the actual report. Many traders believe that stocks up-trending days/weeks into earnings are more likely to experience profit-taking unless the report is extraordinarily good. $MQ has however been downtrading since October 27, 2021 after reaching a new all-time high of $37.82.
Earnings for the 3rd quarter ending September 30, 2021 will be announced on November 10, 2021 post-market. $MQ is projecting a net revenue of $114 - $119 million. My team believes that this is a rather conservative projection.
You never know how the market will respond to good news or bad news. My team will look for further buying opportunities if $MQ falls post-earnings...this is a long term trade.
Lets get it!
My team entered $MQ today at $26.5 per share and have set our first take profit to $30.
FIRST ENTRY: $26.5
TAKE PROFIT 1: $30
TAKE PROFIT 2: $33.5
If you want to see more, please like and follow us @SimplyShowMeTheMoney

GBPUSD H4 - Short SetupGBPUSD H4
Approaching out 1.36 handle, USD has been offloading somewhat off the back of yesterdays sessions and continued throughout the early morning today, currently very bullish.
Looking for possible reversals as we approach this 1.36000 to 1.36100 region, key resistance price, whole number with our weekly key level at 1.36040. Definitely a confluence zone, would just like to see markets slow down a little here.

EURGBP H4 - Long SetupEURGBP H4
Another GBP pair we are following, but we are a little distance from our entry point, huge rallies for this pair last week as EUR gains and GBP dipped due to economic circumstances and data point releases.
0.85 is a huge psychological number which we can look to play from that's played out nicely during recent trade.

BITCOIN | Above The Strong Area, Might Be a Possibility?!Hi,
After the new ATH, the price of BTC has been in the consolidation range around $60000 - $64000. Have been monitoring this area quite a lot and actually, there have been some breakouts that are good but still the price didn't get the momentum afterward.
Now we might have a tiny opportunity to get involved in the short-term or maybe even long-term, who knows. The price of Bitcoin has made a break above the strongest area around the mentioned price range and you can act almost immediately or wait for a bit better price at $61500.
I'm still a little bit concerned about the lower wicks, does the price wants to fill them or not. In general, these are good it shows everyone buys the dip basically.
So, do your own analysis and if this analysis was helpful then you can act as you wish. It is still quite risky because the price is in the middle of the range the odds should be slightly in our favor, let's see how it rolls out.
Regards,
Vaido

YFI parallel trend lines potential to increase 100% to 200%#YFIUSDT
$YFI is near an ascending support, as it is so undervalued so if price hold this support and break out from resistance zone, then can head up toward parallel trend lines to touch $69160 and in long term potential to touch $106000 and $123300.

USDJPY H4 - Long SetupUSDJPY H4
Wouldn't mind seeing a little more from this pair, we are resisting around that 114.200 price region, an area we are struggling to break but we are still climbing on the hourly/H4 timeframe. So until this structure breaks, we can still forecast bulls and trail stops.

EURGBP H4 - Long SetupEURGBP H4
Another really good opportunity here for EG longs, we sold off from 0.85080 down to around 0.84770, pulled back and then since we have seen the second wave downside.
Hopefully we can find support around this region so we can look to execute long orders back up to that 0.85 region.

S&P500 D1 - Long Investment DCAS&P 500 D1
Fresh highs set here on S&P yesterday too before US stock market close. Significant gains and performance. The DCA instruments for new stock/index fund investors. The go to!
If you're looking to invest your first $100, this is something I'd consider looking at!

Gold H4 - Short SetupGold H4
The zone we had marked this weekend before market open seems to be seeing some sort of consolidation/resistance. I'd be looking for signs of price rejection between current price and $1800/oz.
Pending orders for $1800 short could be a good consideration.
