ICICIGI - potential reversal candidate
Daily tf - Stock took a resistance from channel top & found support at the demand zone, accompanied by 50 SMA support.
Weekly TF - Similar scenario with 20 EMA as support.
Keep SL as 1500 daily close.
Finance

TUBE investments - Holly grail support Weekly TF - breakout & retest structure.
Daily TF - Holly Grail support.
Look at the volume inflow in hourly TF.
Trend is changed here.
View negated below 1300.

MTARTECH - Classic breakout MTARTECH - Classic breakout.
Daily TF - Simple breakout.
Hourly TF - Retest of the breakout.

EPS falling wedge breakoutEPS (Ellipsis Finance) is a DEX based on Binance Smart Chain.
The price broke out of the formation and got rejected at 0.5855. Personally, I would prefer to see a reclaim of this level before entering, but given the current market conditions I think it isn't a bad idea to start scaling in now either.
Previous daily close level for SL: 0.5045
Important levels:
~0.519
~0.585
~0.676
~0.737
~0.856
~1.177
~1.495

CHOLAFIN - negation of bears Candle 1 - Gravestone doji formation indicating high supply.
Candle 2 - Bullish piercing candle negating bears.
Bulls are in charge now.
Keep SL as 50 EMA.


ADANI POWER - 2 strong signals
1. HEIKIN ASHI TREND SEQUENCE PERFECTION
Look at the above 2 candles mentioned.
Candle 1 - Doji formation indicating the end of further down trend.
Candle 2 - Green bullish candle with no tail, indicating strength of bulls.
2. Volatility squeeze & Breakout.

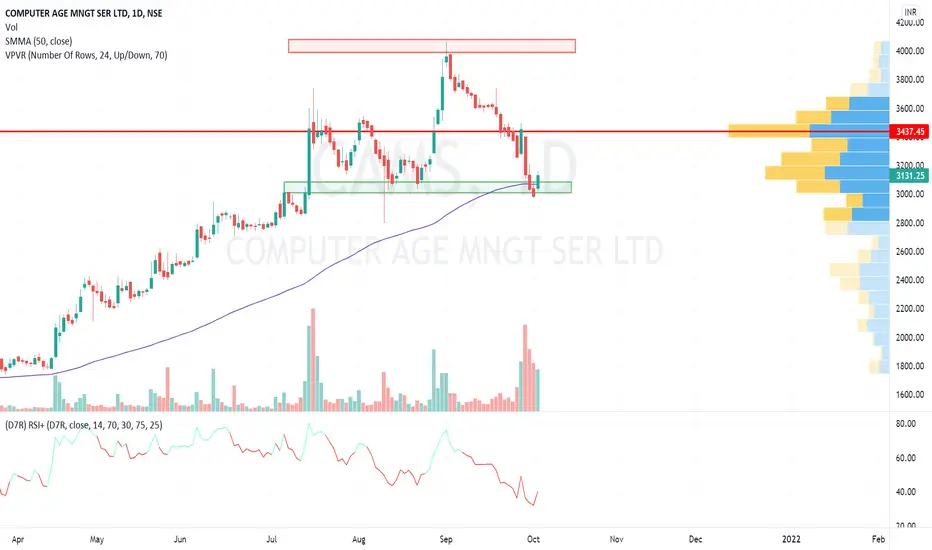
CAMS - mean reversion from bottomWe have a clear reversal from the bottom with 50 SMMA as support, & SL as last low.
Low risk, high reward entry.
PRINCEPIPES - Heikin Ashi trend sequence perfection.
Look at the above 2 candles mentioned.
CANDLE 1 - Doji formation indicating the end of further down trend.
CANDLE 2 - Green bullish candle with no tail, indicating strength of bulls.
Also, look at the pennant & POC breakout, accompanied by 50 EMA support.
The follow up should be bullish.
Keep SL as 50 ema.

Avalanche (AVAX) Looking to Hit $90 Avalanche has been on a rampage and has held up very well since July 21st. Avalanche is currently in price discovery and it has the potential to hit $90 in the coming weeks with the trend it's currently been on. The Fibonacci level of 1.618 is the next destination for price at around $91.
Current Support Zone: $61-$64
Current Resistance: $72.75

BITCOIN TO THE MOON THIS OCTOBER? - ALTUS.FINANCE
⚡️ BTC/USDT
👉 BTC is sitting on the lowest point from within this ascending channel on the daily timeframe, we figure that the only way is up otherwise the next purge will be initiated.
👉 We are also breaking back up onto the 0.382 Fibonacci level. Market structure remains if we go up from here.

Bearish market comesIn recent days, positive dollar news was released by the Federal Reserve, which was a positive signal for the growth of the dollar.
Over the past week, the EUR / USD chart has tried several times to break the 1.175 price ceiling, but failed.
This chart is in a downtrend.
However, if it can break the 1.175 ceiling, it can be said that the market is bullish.
At the beginning of the week, the price chart is expected to reach 1.173 and then the market will fall.
Germany's manufacturing PMI was lower than last week's market forecast. Other euro figures were weaker against the dollar.
In this analysis, two areas for entry are highlighted in blue. Losses are marked in red and profit areas are marked in green.
This is just an analysis. Not a financial recommendation

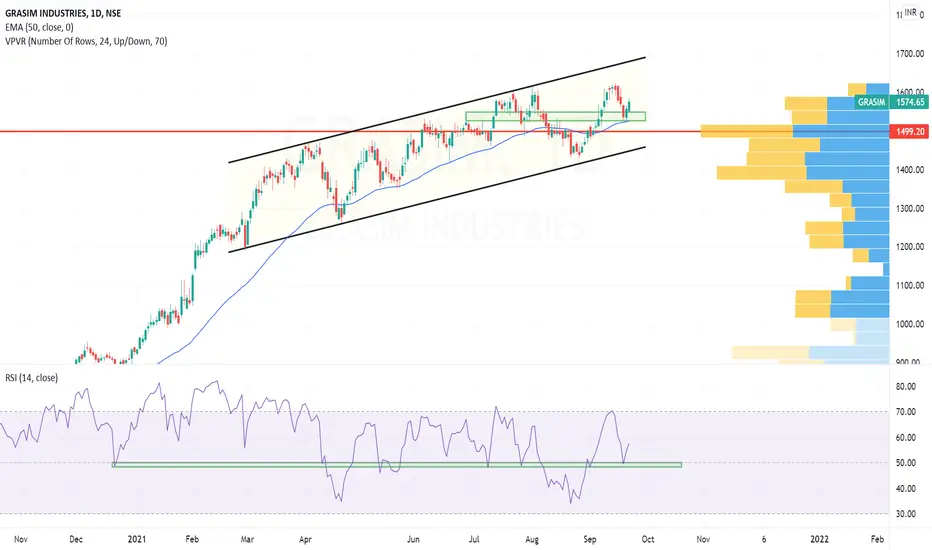
GRASIM - Demand zone assisted reversal1. travelling in a parallel channel.
2. Forming Higher high & higher low formations.
3. Took support of 50 ema & POC.
Poised to make a further move from here.
XRP weekly situationRipple could have both extreme bullish and also extreme bearish potential. it seems a risky asset.

CRYPTO MARKET CAP - ALTUS.FINANCE⚡️MARKET CAP
👉 Drawing a Fibonacci retracement from the market cap's high this month to the low of this month reveals that we are in the process of forming somewhat of an inverse head and shoulders pattern.
👉 We must not ape in to any trades but wait for further confirmation that the bull run is not yet over. The entire space could see a large injection of money within the next couple weeks. Taking us op to back over 2T.
👉 Just 20 Minutes remain till the close of this 4H trading candle. We need to consolidate over the 0.236 Fibonacci level in hopes of an overall green sentiment amongst market participants for the rest of this week.

$PYPL | WEEKLY WATCHLIST 9/20Watching PayPal to hold the $273 level for a wave 2 dip buy to open a swing position. Expecting new all time highs to be made on this sub wave 3!
Goodluck!

Bitcoin (BTC/USD) Weekly Daily Chart Analysis For Sep 13 2021Technical Analysis and Outlook
Bitcoin has been moving upwards since Sept 14 by breaking out from a Mean Sup $44,530 accumulation channel and accelerated.
At that moment, the Bitcoin price is trading around weak resistance marked at $48,150 and is due to accelerate to our Mean Res $52,600 and Inner Coin Rally $54,550 . However, BTC’s recovery at this level will face stiff resistance, indicating that bears will be very active at this higher tier prices.
On the upside, analysts remain bullish, as indicated on the August 9 chart and some other different fast-time charts that underline the bullish potential for Bitcoin. See the 'Weekly Market Review & Analysis For September 13, 2021" page at the usual site for the rest of the market story.

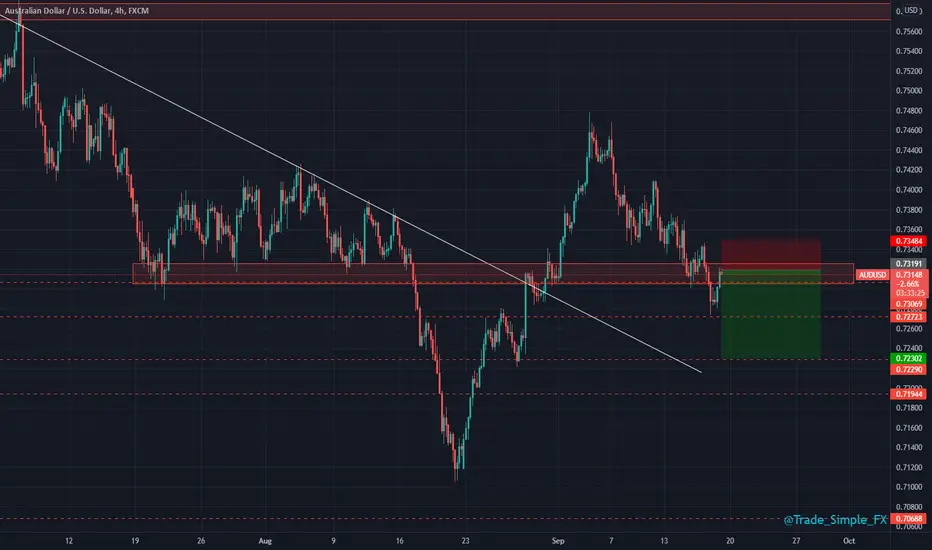
AUDUSD H4 - Short SetupAUDUSD H4
I'd like to see something like this unfold on AU, as mentioned in the technical rundown, dollar gained some nice strength off the back of the figures seen yesterday across retail sales and labour data. We saw a DXY upside break, breaking 92.800.
AUDUSD respective support saw a downside breakout just like NZDUSD, retest has been seen, just looking for that resumed USD strength and continued eastern weakness.
Ethereum Looking Nice!Ethereum is looking like it want's to hit new all time highs in the weeks to come. It is holding strong and has been forming high lows and higher support levels! Fundamentally the potential of Ethereum is still mind bending especially considering the fact that now Ethereum is burned everyday on its way to becoming a "scarce" crypto asset. Ethereum is the future of DeFi. The first mover advantage is powerful.

GBPAUD H4 - Long SetupGBPAUD H4
As mentioned in the technical rundown, this was yesterdays trade of the day, I managed to bank 1.5R on this after pushing circa 2.2R profit. Couldn't optimise the close, but caught the biggest and fastest chunk which I was happy with.
GBP inflation data out this morning showing positive signs and outperforming analyst expectations. GBP positive, but we haven't really seen much of a move off this. AUD again weakness continuations due to everything ongoing with CV19.
Looking for a break above resistance and our 1.89 handle, subsequent retest and long opportunity in line with the previous support/resistance break and retest we saw on the 13th September.

TINPLATE - A less know TATA company TINPLATE -
1. Forming a cup structure.
2. Recent breakout inside cup.
3. Coming back for a retest on weekly TF.
Accumulate it up till 260 levels with a SL of 21EMA.
A breakout post 320 will be massive.
P.S - This is a less known TATA stock
FII have increased their holdings from 0.73% to 2.42%

USDWTI H4 - Long SetupUSDWTI H4
Something we were following last week, took a couple of short positions on this pair for 1R and 1.3R before being stopped at entry/profit.
We have now started to see an upside breakout of both S/R and trend sequence. A bit more of a convincing breakout and subsequent retest could offer us long entries.

#GIPCL - Hero zero stock
Took a huge exhaustion from 104 levels.
Came down with low bear volumes.
Found support at 200 EMA
Low risk, high reward entry at CMP.
SL - below 200 EMA close.
