GBPUSD H4 - Long SetupGBPUSD H4
Slight adjustments made to our support and resistance zone here on cable, generally more happy with the trading zones and the stance we have now in line with other ***USD pairs and DXY performance.
Still a measurable trade from support up to resistance, offering a nice 3R. Just need to sit and wait patiently for a test of support.
Finance

#GBPUSD #GBPUSD
New forecast
So, the price is now below the Strong resistance level. And this is a good selling opportunity.
Our target is the nearest strong support line.
6/6 last GOLD ideas come TRUE

#EURUSD#EURUSD
At the moment, the forecast does not change.
We have an uptrend inside an upward price channel .
The currency pair is consolidating above the level of 1.2175, which means that we are in the buy zone.
Bullish preconditions are as follows: a false breakout in the opposite direction to the trend - a set of energy for movement, consolidation at the support 1.2175, an uptrend, an upward price channel .
I expect growth after the end of consolidation to at least 1.2344

Silver: Booms, busts and a new opportunity?In today’s educational article we will analyze silver’s historical boom and bust cycles through the lens of financial history but we’ll also provide a forecast for the future price of this asset.
In the modern era of precious metals markets that began in 1971, silver (XAGUSD) had 2 previous bull markets that reached the fabled $50 USD level and then pulled back. We think that this current bull market that will unfold in the coming year/s has the power to break that $50 glass ceiling and reach an all-time high. First, we will look at some basic characteristics and things that set silver apart from its precious metal counterpart gold.
Silver is similar to Gold in many ways:
1. Accepted as a form of money since ancient times
2. It must be mined, isn’t made out of thin air
3. Total global supply is limited
But Silver has qualities that Gold doesn’t:
1. It has a myriad of industrial uses (batteries, dentistry, glass coatings, LED chips, medicine, nuclear reactors, photography, photovoltaic (or solar) energy, RFID chips (for tracking parcels or shipments worldwide), semiconductors, touch screens, water purification, wood preservatives)
2. There are few pure silver mines . Overwhelmingly silver is mined only as a byproduct of mining other metals, such as base metals (copper, zinc, etc.).
The 1979-1980 Silver crisis
In the era of high inflation with the Consumer Price Index (CPI) at the time reaching 10-12%, there were many books that recommended investments in precious metals and strong currencies to protect your wealth. Investors, in general, shared this view and the price of precious metals soared. Prices for silver rose from less than $10.61 an ounce in August 1979 to $52 an ounce in January 1980. Inflationary pressures from throughout the world pushed up prices.
Herbert and Nelson Bunker Hunt, who were buying silver in previously unheard-of quantities, also had an impact on prices. The Hunts had attempted to corner the silver markets in 1973 with little success, but their trade in 1979 would rock the financial world. Bunker Hunt had about 21 million ounces of silver bullion and coin on August 1, 1979, as well as over 9,000 silver futures contracts covering another 46 million ounces of the metal. Bunker's brother, Herbert Hunt, possessed another 21 million ounces of silver and over 4,000 silver futures contracts. To acquire even more silver, the Hunts founded the International Metals Investment Co. It had accumulated over 8,400 silver futures contracts by August of 1979.
When the Hunts started buying silver in 1979, they were billionaires. Nelson Bunker Hunt reportedly had a net worth of about $3 billion. Another $1.38 billion belonged to Herbert Hunt. When the value of the Hunts' silver investments surged to about $10 billion, their fortune grew significantly. Despite their affluence, the Hunts bought their silver largely with borrowed money.
Several banks loaned the Hunts over $650 million to fund their silver purchases including Citibank, the First National of Chicago, and Dallas. Also, a big source of funding for the Hunts was Bache &Co which was the second-largest brokerage firm at the beginning of the 1970s. The silver market was disrupted as prices shot up rapidly. On November 30, 1979, silver was trading at just under $19. By January 3, 1980, its price had risen to over $38 an ounce. Silver prices peaked at over $50 an ounce on January 18, 1980. Under pressure from the CFTC, the Commodity Exchange, Inc. (COMEX), the primary futures market for silver trading, announced on January 21 that it would allow trading for liquidation only. The exchanges increased margin levels to 100 percent, which further dried up the liquidity in the market. Prices plunged after the exchanges took those actions. In one twenty-four-hour period, silver prices dropped from $39.50 to $10.80 an ounce.
This generated massive margin calls on Hunt's positions. Margin calls had to be met in cash, and this strained even the enormous resources of the Hunts. They failed to meet $135 million in margin calls at Bache on March 26, 1980. Shortly thereafter, on March 28, 1980, the Hunts advised their brokers that they could not meet further margin calls in cash. That announcement threatened the financial stability of several large brokerage firms that had held Hunt positions, resulting in the “Silver Crisis.”
The CFTC was among those pursuing the Hunt brothers. The Hunts eventually agreed to a permanent bar from trading on all commodity exchanges, and they were assessed with a $10 million civil penalty by the CFTC. The Hunts were the subject of numerous private actions in which large judgments were returned. They then filed for bankruptcy.
The 2010-2011 Boom
In April of 2011 Silver traded at $49.80 per ounce in the spot exchange at the New York market. The Gold/Silver Ratio was one of the criteria that many traders were examining. Some people felt that silver was undervalued compared to gold and that it would eventually return to its historical price parity of around 16 ounces of silver per ounce of gold. Despite the fact that silver had not been this expensive in terms of gold in 28 years, and despite the fact that Dollar prices had doubled in 6 months, some traders believed the move wouldn't be complete until silver traded above the $50 price level it had reached in 1980.
The conditions for this bull market were very different compared to the boom of the 1980s. Thirty years later, the world economy was once again at risk. The US economy was still reeling from the housing crisis and the collapse of Lehman Brothers in 2008. Greece, Ireland, Portugal, Italy, and Spain have all revealed major financial issues, putting the Eurozone in jeopardy.
In the United States, consumer confidence in the economy had remained at all-time lows. The news from Europe only added to concerns of a fresh financial catastrophe. Then, in November 2010, the Fed announced the start of a new cycle of Quantitative Easing. The US Mint set a monthly record for silver coin sales, only topped by the rise in private-investor demand in early 2011. As a result, many investors believed the Dollar was under siege. It became critical to seek safe-haven investments that would hold or expand in actual value during a period of sustained inflation.
Meanwhile, there was news coming out of the silver market that seemed to support an optimistic long-term outlook on silver's industrial demand. For example, the solar sector began consuming substantially more silver than in prior years. Solar panel manufacture begins with silver paste, which necessitates a better quality of silver than is available on the wholesale market. As the sector's growing demand sucked in these 0.9999 fine bars, it drew a lot of attention. Because while there was no shortage of the more common 0.999 bars, there was a shortage of immediate supply of this higher purity. And because of the growing demand, and the coincidental rise in the silver price, the story stuck.
Furthermore, as the narrative progressed, the enormous private-investor demand for tiny bars and coins in silver grew as a result of the global economic crisis, causing immediately available retail items to command larger premiums than those scheduled for delivery later. In February 2011, this trend continued in the futures market. When demand for physical items exceeds expectations, it can be difficult for producers to fill additional client orders rapidly. If supply becomes erratic as a result, it provides the impression that there is a raw material scarcity when, in fact, there is just a product scarcity.
When the short-term risks were believed to have subsided, many investors reallocated their assets back into yielding (dividend or interest) investments such as stocks or bonds causing the price of silver to crash in the following months.
Today…
Inflation is historically bullish for silver and all commodity prices. We find ourselves in a low-interest rate environment (or zero) accompanied by a strong debasement of all currencies being done by central banks. Base metals, grains, oil, lumber have started a new boom cycle fueled in part by central bank policies, higher demand, and supply bottlenecks caused by the pandemic.
Based on the monthly chart we believe that Silver made the first impulse to the upside after reaching $11 in March 2020. It rallied to $29,90 in a couple of months reaching the top in August 2020. From August to the day this article is written (June 2021) it is still consolidating, preparing the next move up.
Trade with care.
If you like our content, please feel free to support our page with a like, comment & subscribe for future educational ideas and trading setups.

NZDCAD H4 - Long Trade SetupNZDCAD H4
We were following this on Friday and saw a solid bounce from support initially for it to then reverse.
Another opportunity may be presenting here from support once again, CAD strength in line with WTI demand. Hopefully expires soon, as this would be a nice setup to see unfold.

GBPUSD#GBPUSD
The instrument is in the ascending channel . The trend is growing. A triangle-like pattern is forming between strong resistance 1.4226 and the support of the ascending channel . We have a clear resistance at 1.4226 and ascending local minimums. I expect the currency pair to update the nearest tops and, after the breakdown of the level 1.4226, the long-range resistance of 1.4376 will be reached

#GOLD#GOLD
For GOLD - nothing really changes with us.
The price went up a little yesterday.
Now I also expect a slight increase from the border - down.

EURUSD H4 - Long SetupEURUSD H4
On the retest price now after seeing that upside break this morning. Not really best practice for us to enter a trade this time of day, especially a EUR/LON volatile pair.
Something we can keep an eye on and see if it's worth tomorrow as we enter our typical trading session.

L&T FHA very good trendline breakout on Monthly/Weekly chart and retested it
Againg on daily and weekly chart giving Breakout
CMp 91
Sl should be 200EMA that is around 80 on closing basis
Note- Sharing this data with you only for learning purpose Strictly take advice from your financial advisor before taking any entry or exit

ETH to 10k by END of this year ;)Nostradamus here,
Let's look at this prediction.
You can see there 2 lines - orange & reddish.
Orange is the first part, but after crossing the reddish, we will start following that.

Purple Group LTDPurple Group has had a massive run up over the last 6-12 months. Yes, their customer growth has been impressive and they continue to grow exponentially, but it goes without saying that you should be cautious and not overly optimistic and this point.
Purple Group must still grow into their earnings and continue to show the market that they have what it takes to stand the test of time.
As Warren Buffet states; " Price is what you pay; value is what you get".
If the head and shoulder formation plays out, I think we will have one last opportunity to buy stock below R1 before the share moves into a new trading range.
My prediction is that we could see below R1 again before the year is up or as early as January 2022. After that we wont see below R1 again and Purple Group will trade in a new range between R1.20 -R2 in 2022.
With that being said,
I'm extremely bullish on this stock and really excited about their long term fundamentals, but why not benefit from now and in-between then - and bank some profits along the way.

Mahindra & Mahindra Finance Looking Bullish, can go Long
All the key levels are mentioned in chart with Stop-loss and Targets
RSI BULLISH DIVERGENCE
Breakout
Key Levels
Volume spikes
Disclaimer
I am not sebi registered analyst
My studies are Educational purpose only
Please consult with your Financial advisor before trading or investing

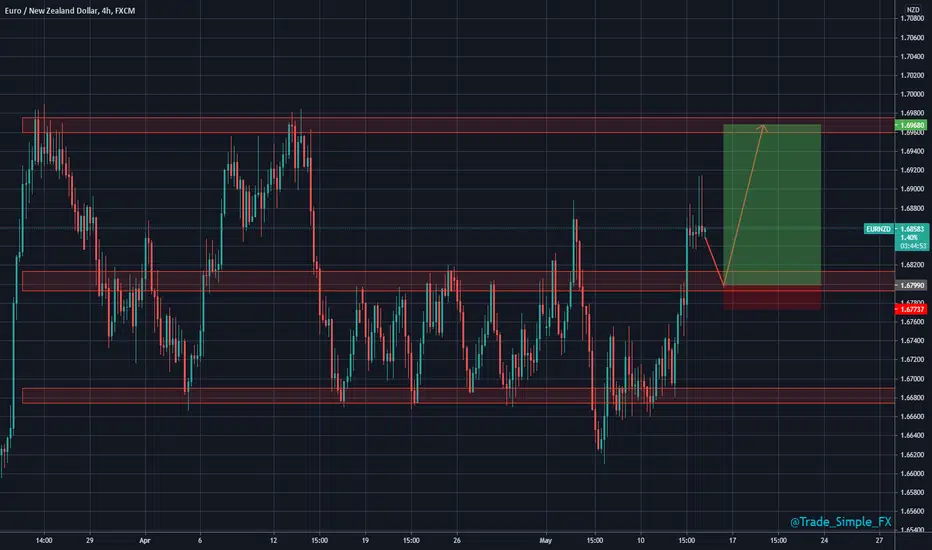
EURNZD H4 - Long SetupEURNZD H4
Looking for something as indicated and summarised on the previous video analysis that was sent through. We are seeing some consolidation from the latest rally which may actually pull us back south of our support zone temporarily.
If this is the case, regardless, we need to see a pop higher maybe 1.70150 ish, before coming back to retest 1.69650 support to scout out possible long entries.

Binance Coin (BNB/USD) | Buying Area!Hi,
There's blood in the streets and it will guide some of the top altcoins into places where they might get at least a technical short-term bounce upwards to gain some profits.
One of them is Binance Coin: Do you REALLY believe that BNB comes as low as $400, wtf r u talking about, never ever $400 and etc. These are just a few picks from my altcoin series comment sections and yet here it is :D
Do you remember these words: I don't care why, I don't care when but if it comes I'm prepared - and it approaching my mentioned buying area quite strongly.
Keep your eyes around $350, target are shown in the picture.
Stay healthy,
Vaido

LITECOIN (LTC/USD) - Buying Area!Hi,
Some quite decent criteria are waiting for a price inside a shown buying zone.
Stay healthy,
Vaido

Yearn Finance - YFI - will YFI beat BTC in the race to $100K?Yearn Finance - YFI - will YFI beat BTC in the race to $100K? Still ahead of BTC. We will See? HODL is the motto!

DESCENDING TRIANGLE ICP/USDTHello guys, here we have a descending triangle in ICP/USDT 1HR, i saw it late so i couldnt post it and operated it neither, but i post it now for educational purpose, so you can see how a good descending triangle looks like.
If you would have opened this trade at $184.72 and the price hitted take profit at $169.91, you would had win $14.81 per coin buyed.
Leave me a comment below with your opinion about this triangle and ICP.
Take care XOXO.

BITCOIN | Inside a Buying Area!Hi,
At the moment, the price of Bitcoin trades inside a possible buying zone. Criteria are quite good and at least a short-term bounce should come from the current area.
Considering long-term buyers then, we still might see lower prices so, be careful with that because 50% correction from the top can still happen ;)
Criteria:
1. Equal waves of AB=CD
2. Channel projection
3. Resistance becomes support
4. Daily EMA200 (haven't touched it over a year)
5. Round number 40k
6. Fibonacci rejection
7. Inefficiency around the current price
Target: 46-50k
Stay healthy,
Vaido

RESULT FROM SYMMETRICAL TRIANGLE ICPThe result of the rupture of the symmetrical triangle in ICP was a goo profit, the trade lasted 4 hours maybe a little bit more.
Be cautios at the moment to invest in ICP, its a new crypto, dont have engouh data to forecast in the long term, so have that in mind when you make your analysis


CADJPY H1 - Long SetupCADJPY H1
Trading from current price up to previous high still offer 3.3R, measurable trade no doubt. Not the typical kind of analysis we like that trade, seeing as it's more a trending environment, but we still break and retest out trading zones, and it's on a slightly lower timeframe.
Happy to see how things unfold though.

EURNZD H4 - Long SetupEURNZD H4
Jumped ship again, prefer this structure as compared to what we had marked on EURAUD and also the pending order limit we had set.
Thinking exactly the same play for this setup, multiple H4 rejections seen with the latter 2pm closing bearish. Expecting corrections now down to 1.68, which is where I'm looking to scout longs.
GBPUSD H4 - Long SetupGBPUSD H4
1.40 support incoming, looking to either set a pending order on this price level or an alert to make sure this move isn't missed, perfect corrections, shame we closed out yesterdays short at 200 to try and get a better entry!
Win some, miss some, lose some. Part of the game, 1.40 support will be a great buy entry for us I feel.
