Gold H1 - Long Trade SetupGold H1 - Absolutely flying without any real retest of that 1785 number! Sitting 300 pips above that previous resistance without any real pullback. Saying that, we haven't even really had a retest of 2012 highs at 1795. Just want to keep following this pair and seeing if we keep breaking the new high levels.
Finance

CADJPY H1 - Long Trade SetupCADJPY H1 - Also moving really nicely, probably going to find a bit of resistance in the next 10-15 pips or so I imagine, need to break that counter trendline to maintain upside momentum.

BITCOIN | Minor Break on DailyHi,
The price of Bitcoin has made a tiny statement to the higher prices. In general, these breakouts are pretty promising but at the moment we have such a ranging market that can lower the success rate.
Still, worth to try it:
1) A daily break above the counter-trendline (blue)
2) Daily EMA50 acting as a support
3) 4H EMAs acting as support levels
4) 1H EMAs acting as support levels
5) Retest/entry area acting as a support
Regards,
Vaido


LUFTHANSA (LHA)Hi,
Strong support 8.000 - 9.000
Technical criteria:
1) Historically worked support level. 1995, 2003, 2009, and 2012. All rejections have been extremely profitable.
2) 2x equal waves from the top AB=CD
3) Fibonacci Extension 162% and 127%
4) Orange minor trendline third touch
5) Channel projection lower trendline worked perfectly
Regards,
Vaido

TALLINNA KAUBAMAJA (TKM1T)Hi,
Strong area 7.80 - 8.20
Technical criteria:
1) Rejection from the trendline
2) Rejection from the Monthly EMA 100
3) Fibonacci retracement 38%
4) Got a rejection from the channel lower trendline, considered as a bullish chart pattern called Bull Flag
Regards,
Vaido

SIAULIU BANKAS (SAB1L)Hi,
Strong support 0.27 - 0.31
Technical criteria:
1) Previously worked strong support level (2009)
2) Fibonacci retracement 62%
3) Fibonacci Extension 162%
4) 50% drop from the recent high
5) Minor trendline
Regards,
Vaido

COCA-COLA (KO)Hi,
Strong support 29 - 34
Technical criteria:
1) The trendline since 1989
2) Previous 2007/08 resistance level start to act as a support
3) Fibonacci retracement 62%
4) 50% drop from the recent high guides the price exactly to the green box, acting as a support.
Regards,
Vaido

YARA INTERNATIONAL (YAR)Hi,
Strong support 330 - 350.
Technical criteria:
1) The trendline since 2009
2) 2010 clean resistance matching perfectly with the trendline
3) Monthly EMA 100
Regards,
Vaido

NETFLIX (NFLX)Hi,
Strong support 330 - 375.
Technical criteria:
1) The trendline since 2016
2) 2018/2019 resistance become support
3) Weekly EMA 100 (blue)
4) Weekly EMA 200 (red)
Regards,
Vaido

STORA ENSO (STERV)Hi,
Strong support area 9.500 - 10.500.
Technical criteria:
1) Rejection from the trendline
2) Rejection from the Fibonacci retracement 62%
3) The round number 10.000
4) 50% drop from the recent high acting as a support
5) Historically really strong horizontal area acting currently as a support
6) Monthly EMA 100
7) Monthly EMA 200
Regards,
Vaido

EQUINOR (EQNR)Hi,
Strong support around 115 - 130.
Technical criteria:
1) Historically the third strong rejection from the round number 100
2) Rejection from the Fibonacci retracement level 62%
3) Historically strong support area
4) 50% drop from the recent top acting as a support
5) The trendline
Regards,
Vaido

SWEDBANK (SWED_A)Hi,
Strong support around 100 - 117.
Technical criteria:
1) Rejection from the round number 100
2) Rejection from the Fibonacci retracement level 62%
3) Previously worked tiny resistance levels become support
4) 50% drop from the recent high acting as a support
Regards,
Vaido

Bank of America small relief rallyafter a massive dump, believe we see a small rally and then another leg lower.
eXp World Hldngs $EXPI "SKY"$EXPI most likely will not stop till touch the pivot resistance
12 months Consensus Price Target: $17
if you find my charts useful, please leave me "like" or "comment".
Please don't trade according to the ideas, rely on your own knowledge.
Thx

Cannae Holdings $CNNE $CNNE is close to buy point of $40.27. I would watch for volume above the average before you get in.
12 months Consensus Price Target: $43
if you find my charts useful, please leave me "like" or "comment".
Please don't trade according to the ideas, rely on your own knowledge.
Thx

NZDCAD H4 - Long SetupNZDCAD H4 - Pushing resistance, now, looking to see a rejection and selloff back downside. This has always been a better setup to buy from support, rather than to sell from resistance. Purely because it's bullish consolidation and the wick zone is clearer from support than resistance.

EURAUD H1 - Long Trade SetupEURAUD H1 - Range box still intact, had a couple of bounces from this zone since we last had this marked up. Support is seeing responses but yet to have bounced enough to test resistance price.

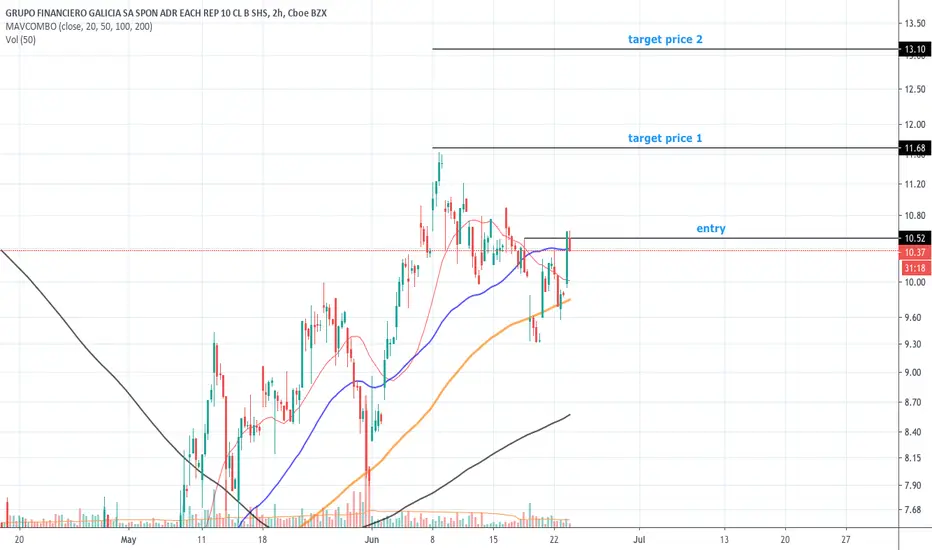
GRUPO FINANCIERO GALICIA $GGALEntry. $10.52
S/L $10
TP1 $11.68
TP2 $13.10
12 months Consensus Price Target: $23
if you find my charts useful, please leave me "like" or "comment".
Please don't trade according to the ideas, rely on your own knowledge.
Thx
EURGBPGood Evening Traders, let's get this week started with the zones I am looking for possible trades in for this week.
EURGBP- This pair is pushing higher above the 50ema but is about to run into a Monthly Resistance Zone (brown area) which is an area that I think we could see a nice counter-trend bounce out of the EURGBP. So, for that reason, I will be looking in this area for potential short trades.
Monthly Resistance Zone- (0.91140-0.95020)

DeFi & ETH- THE BIG NEW TREND IN CRYPTO WITH EFFECTS ON ETHEREUMI did not pay attention too much to the Decentralized finance trend in crypto because until few months ago, just classic lending platforms were on the field. Now things changed. It has reached the front page on the crypto world because of the launch of the COMP token (will talk about it in a seprate idea) and the DeFi future on the exchange you see in the graph.
This one in the chart is a new index that comprises main defi platforms/tokens (you can see a decrsiption if them). This index is really new (started running just few days ago), but already makes us understand that the trend in defi is huge.
DeFi in general is composed by
- DEX (decentralized exchanges),
- Lending platforms and money market platforms (where it is possible to lend or borrow usd or tokens and gain interests on them)
- Derivatives markets (where you can create a synth asset like a token or a commo that replicates the real one)
What do they have in common? They ALL RUN ON ETHEREUM. Considering that an underlying can never be bigger that its "box", an increase in defi will coincide with an increase of the platform it runs on.
Is the trend sustainable? Probably this is now a little hyped, but the trend is for sure upward. If you do not have many clues on each of the companies (always DYOR by the way) or do not want to jeopardize you money in different projects, this index is the answer for you. It is available just on that exchange.
I will monitor a little bit in the folloiwng days DeFi Index and will consider also increasing my positions on ETH.
Let me know what do you think of DeFi


