Bitcoin & Altcoins: Technical Analysis and Market OutlookBitcoin (BTC) Analysis
Bitcoin is currently forming a short-term bullish pennant within a larger long-term pattern, projecting a potential target around $135K.
Key Levels: BTC is consolidating between the lower zone at $117.3K and the upper zone at $119.7K.
Breakout Potential: A break above this pattern could propel BTC toward a new all-time high (ATH), surpassing the current ATH at $123K.
Macro Events This Week:
Wednesday: The Federal Reserve will announce its interest rate decision, with no changes expected.
Wednesday: ADP Employment Report, providing insights into potential future rate cuts.
Friday: Non-Farm Payrolls (NFP) data release, which could further influence market sentiment.
Ethereum (ETH) Breakout
Ethereum has decisively broken through its 4-year historical resistance around $3,725, closing the week above this level. This breakout signals a strong bullish outlook for ETH, with potential for further upside.
Altcoin Highlights
BNB: Has shattered its previous all-time highs, showcasing significant bullish momentum.
XRP: Reached approximately $3.64, reflecting strong gains and market interest.
Market Context
The crypto market is showing robust activity, with altcoins following Bitcoin and Ethereum's lead. Key macroeconomic events this week could introduce volatility, so traders should stay vigilant.
Disclaimer: This is not financial advice. Every trader is responsible for their own strategy and risk management.
Happy trading and good profits! 🚀
Financial

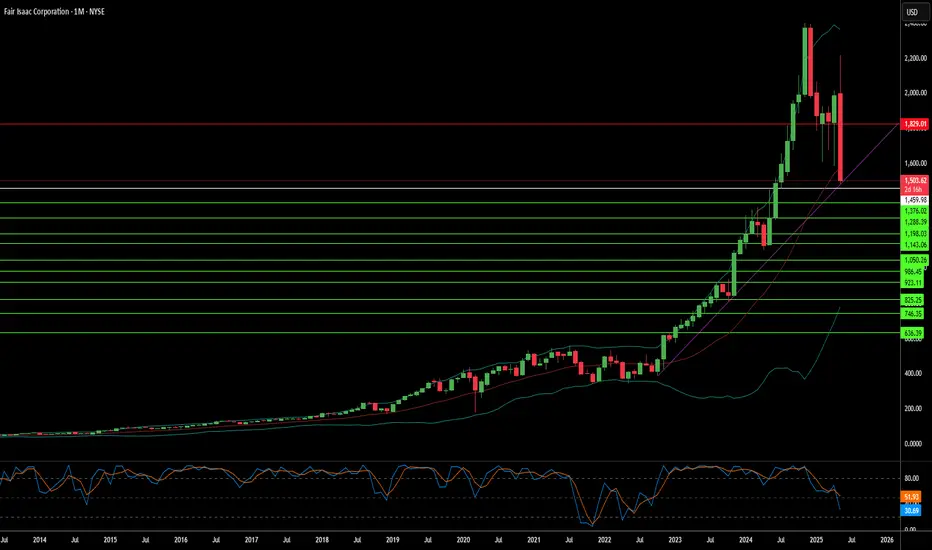
FICO's Monopoly: Cracks in the Credit Kingdom?For decades, Fair Isaac Corporation (FICO) has maintained an unparalleled grip on the American credit system. Its FICO score became the de facto standard for assessing creditworthiness, underpinning virtually every mortgage, loan, and credit card. This dominance was cemented by a highly profitable business model: the three major credit bureaus—Equifax, Experian, and TransUnion—each paid FICO for independent licenses, generating a significant percentage of revenue per inquiry and establishing a seemingly unassailable monopoly.
However, this long-standing reign now faces an unprecedented challenge. The Federal Housing Finance Agency (FHFA) Director, Bill Pulte, recently signaled a potential shift to a "2-out-of-3" model for credit bureaus. This seemingly technical adjustment carries profound implications, as it could render one of FICO's three bureau licenses redundant, potentially evaporating up to 33% of its highly profitable revenue. Director Pulte has also publicly criticized FICO's recent 41% increase in wholesale mortgage score fees, contributing to significant declines in FICO's stock price and drawing broader regulatory scrutiny over its perceived anti-competitive practices.
This regulatory pressure extends beyond FICO's immediate revenue, hinting at a broader dismantling of the traditional credit monopoly. The FHFA's actions could pave the way for alternative credit scoring models, like VantageScore, and encourage innovation from fintech companies and other data sources. This increased competition threatens to reshape the landscape of credit assessment, potentially leading to a more diversified and competitive market where FICO's once-unchallenged position is significantly diluted.
Despite these formidable headwinds, FICO retains considerable financial strength, boasting impressive profit margins and robust revenue growth, particularly within its Scores segment. The company's Software segment, offering a decision intelligence platform, also presents a significant growth opportunity, with projected increases in annual recurring revenue. While FICO navigates this pivotal period of regulatory scrutiny and emerging competition, its ability to adapt and leverage its diversified business will be crucial in determining its future role in the evolving American credit market.
Renault’s €2.2 BILLION Loss SHOCKER: Nissan’s Costs Hit Hard!Renault’s €2.2 BILLION Loss SHOCKER 💥: Nissan’s Turnaround Costs Hit Hard! 🚗💸
Imagine Renault and Nissan are like best friends 🤝 who share a big toy car company 🏎️. Renault owns a big piece of Nissan, kind of like having a lot of the toy car's parts 🛠️. But Nissan had a tough year because fewer people bought their cars 📉, especially in places like China 🇨🇳. To fix this, Nissan is making some big changes, like making fewer cars 🚘 and saying goodbye to some workers 👋. These changes cost a lot of money 💰, and because Renault owns part of Nissan, Renault has to share the cost 😓. This means Renault will lose some money this year, about 2.2 billion euros 💶, which is like losing a giant pile of coins! 🪙 But Renault's bosses think these changes will help Nissan make better cars and sell more in the future 🌟, so both friends can be strong again 💪.
Analysis (Up to May 13, 2025):
Renault Group’s announcement of a €2.2 billion hit to its first-quarter earnings 📊 stemming from its 35.71% stake in Nissan reflects the interconnected financial dynamics of their strategic alliance 🤝, as well as broader challenges in the global automotive industry 🌍. Below is an institutional-level analysis of the situation, incorporating the provided data and contextualizing it within the current market environment as of May 13, 2025 🕑.
1. Financial Impact and Impairment Context 📉
Renault’s Exposure to Nissan: Renault’s €2.2 billion earnings hit 💥 is directly tied to Nissan’s reported net loss of approximately $5 billion 📅 for the fiscal year ending March 2025. This loss includes impairments (writing down the value of assets like factories 🏭 or inventory 📦 that are no longer worth as much) and restructuring costs (expenses for layoffs 👥 and factory reductions 🔽). As a 35.71% shareholder, Renault absorbs a proportional share of Nissan’s financial setbacks 📉, which are booked as a negative contribution to Renault’s earnings 💸.
Accounting Implications: The impairments reflect Nissan’s need to adjust the book value of its assets 📜 to align with weaker market performance 📊, particularly in China 🇨🇳, where sales have significantly declined 📉. Restructuring costs are linked to Nissan’s November 2024 announcement of cutting 9,000 jobs 🚫 and reducing global production capacity by 20% 🔧. These measures aim to streamline operations but involve upfront costs 💰, impacting Renault’s financials due to equity accounting rules for its Nissan stake 📈.
Market Reaction: Despite the earnings hit, Renault’s shares rose 1.2% to €48.46 in early trading on the announcement day 📈, suggesting investor confidence in the long-term benefits of Nissan’s turnaround plan 🌟 or optimism about Renault’s core operations 🚗. This resilience may also reflect broader market dynamics, such as stabilizing demand in Europe 🇪🇺 or positive sentiment toward Renault’s electrification strategy ⚡.
2. Nissan’s Turnaround Plan and Strategic Rationale 🔄
Sales Decline: Nissan’s fiscal 2025 sales fell 4.3% to 3.3 million units 📉, driven by weakness in China 🇨🇳, Japan 🇯🇵, and Europe 🇪🇺. China, the world’s largest auto market 🌐, has been a pain point for many global automakers due to intense competition from domestic brands like BYD 🚘 and declining demand for traditional vehicles amid an economic slowdown 📉.
Restructuring Efforts: Nissan’s turnaround plan, announced on April 24, 2025 📅, focuses on cost reduction 💸 and operational efficiency 🔧.
The 9,000 job cuts 🚫 and 20% reduction in production capacity 🔽 signal a shift toward leaner operations, prioritizing high-margin markets and products 📈. This aligns with industry trends, as automakers globally face pressure to adapt to lower demand for internal combustion engine vehicles 🚗 and invest heavily in electric vehicles (EVs) ⚡.
China Strategy: Nissan’s weak performance in China 🇨🇳 underscores the need for a revised market approach 🔄, potentially involving localized EV models ⚡ or partnerships to compete with dominant players 🏆. The impairments likely include devaluing assets tied to underperforming Chinese operations, such as factories 🏭 or unsold inventory 📦.
3. Renault-Nissan Alliance Dynamics 🤝
Historical Context: The Renault-Nissan-Mitsubishi Alliance, formed in 1999 🗓️, has been a cornerstone of both companies’ global strategies 🌍, enabling shared R&D 🧠, platforms, and cost efficiencies 💰. Renault’s significant stake in Nissan ties their financial fates closely 💸, but recent years have seen tensions 😬, including governance issues and strategic divergences, particularly after the 2018 Carlos Ghosn scandal 🚨.
Mutual Dependence: While Nissan’s challenges weigh on Renault ⚖️, the alliance remains critical for both. Renault benefits from Nissan’s scale in markets like North America 🇺🇸 and Asia 🌏, while Nissan leverages Renault’s expertise in Europe 🇪🇺 and EV technology ⚡ (e.g., Renault’s success with models like the Megane E-Tech 🚗).
The €2.2 billion hit 💥 underscores the risks of this interdependence but also highlights Renault’s commitment to supporting Nissan’s recovery 🌟, likely viewing it as essential for the alliance’s long-term viability 📅.
Potential Risks: If Nissan’s turnaround falters 🚫, Renault could face further financial strain 😓, including additional impairments 📉 or pressure to dilute its stake. Conversely, a successful restructuring could strengthen the alliance 💪, boosting shared EV development ⚡ and cost synergies 💸.
4. Industry and Macro Context (Up to May 13, 2025) 🌍
Global Auto Industry: The automotive sector faces a complex transition in 2025 🔄, balancing the shift to EVs ⚡, supply chain disruptions 🚚, and regional demand variations 📊. European automakers like Renault are under pressure to meet stringent EU emissions targets 🌿, while Japanese firms like Nissan grapple with declining relevance in markets like China 🇨🇳, where EV adoption is accelerating ⚡.
China’s Role: China’s market challenges are systemic 🌐, with global automakers losing share to local brands 🚗. Nissan’s sales drop 📉 reflects this trend, and Renault’s indirect exposure via Nissan amplifies its vulnerability to China’s slowdown 😓.
EV Transition: Both Renault and Nissan are investing in electrification ⚡, but Nissan’s restructuring may delay its EV rollout 📅, potentially ceding ground to competitors 🏆. Renault, with its stronger EV portfolio in Europe 🇪🇺, may need to lead alliance efforts in this area 🚗.
Macro Factors: Rising interest rates 📈, inflation 📊, and geopolitical uncertainties 🌍 (e.g., trade tensions) continue to impact consumer demand and production costs 💰. These factors likely exacerbate Nissan’s sales declines 📉 and Renault’s financial hit 💸.
5. Long-Term Outlook (4-10 Year Horizon) 🔮
Nissan’s Recovery Potential: If Nissan’s restructuring succeeds ✅, it could emerge leaner and more competitive by 2029 📅, with a focus on high-growth segments like EVs ⚡ and markets like North America 🇺🇸. This would benefit Renault through improved equity income and alliance synergies 🤝.
Renault’s Strategy: Renault is likely to prioritize its European operations 🇪🇺 and EV leadership ⚡ while supporting Nissan’s recovery 🌟. Divesting its Nissan stake seems unlikely in the near term 🚫, given the strategic importance of the alliance, but Renault may seek to diversify its portfolio to mitigate risks 🛡️.
Alliance Evolution: Over the next 4-10 years 📅, the Renault-Nissan-Mitsubishi Alliance could deepen integration in EV platforms ⚡ and autonomous driving 🤖 or face pressure to restructure if financial strains persist 😓. External partnerships (e.g., with Chinese firms for Nissan 🇨🇳) or mergers could reshape the alliance’s structure 🔄.
Risks to Monitor: Key risks include prolonged weakness in China 🇨🇳, failure to execute EV strategies 🚫, and macroeconomic volatility 🌍. Regulatory changes, such as stricter emissions rules 🌿 or trade barriers 🚧, could further complicate the alliance’s plans 📜.
Conclusion 🎯
Renault’s €2.2 billion earnings hit 💥 reflects the immediate financial burden of Nissan’s restructuring and market challenges, particularly in China 🇨🇳. However, the institutional perspective sees this as a strategic investment in Nissan’s long-term recovery 🌟, critical for the Renault-Nissan-Mitsubishi Alliance’s competitiveness in a rapidly evolving industry 🚗. For a 4 to 10 year old, it’s like Renault helping a struggling friend fix their toy car 🛠️, taking a short-term loss 💸 to ensure both can play better in the future 🎉. Over the next 4-10 years 📅, the success of Nissan’s turnaround and the alliance’s ability to navigate the EV transition ⚡ will determine whether this hit becomes a stepping stone 🪜 or a recurring burden ⚖️.

Will the Fear Gauge Flash Red?The Cboe Volatility Index (VIX), Wall Street's closely watched "fear gauge," is poised for a potential surge due to US President Donald Trump's assertive policy agenda. This article examines the confluence of factors, primarily Trump's planned tariffs and escalating geopolitical tensions, that are likely to inject significant uncertainty into the financial markets. Historically, the VIX has proven to be a reliable indicator of investor anxiety, spiking during economic and political instability periods. The current climate, marked by a potential trade war and heightened international risks, suggests a strong likelihood of increased market volatility and a corresponding rise in the VIX.
President Trump's impending "Liberation Day" tariffs, set to target all countries with reciprocal duties, have already sparked considerable concern among economists and financial institutions. Experts at Goldman Sachs and J.P. Morgan predict that these tariffs will lead to higher inflation, slower economic growth, and an elevated risk of recession in the US. The sheer scale and breadth of these tariffs, affecting major trading partners and critical industries, create an environment of unpredictability that unsettles investors and compels them to seek protection against potential market downturns, a dynamic that typically drives the VIX upward.
Adding to the market's unease are the growing geopolitical fault lines involving the US and both China and Iran. Trade disputes and strategic rivalry with China, coupled with President Trump's confrontational stance and threats of military action against Iran over its nuclear program, contribute significantly to global instability. These high-stakes international situations, fraught with the potential for escalation, naturally trigger investor anxiety and a flight to safety, further fueling expectations of increased market volatility as measured by the VIX.
In conclusion, the combination of President Trump's aggressive trade policies and the mounting geopolitical risks presents a compelling case for a significant rise in the VIX. Market analysts have already observed this trend, and historical patterns during similar periods of uncertainty reinforce the expectation of heightened volatility. As investors grapple with the potential economic fallout from tariffs and the dangers of international conflicts, the VIX will likely serve as a crucial barometer, reflecting the increasing fear and uncertainty permeating the financial landscape.

Is Erdogan’s Gambit Destabilizing Turkey’s Future?Erdogan’s administration continues to engage in high-stakes geopolitical maneuvers by maintaining direct and indirect ties with groups designated as terrorist organizations. His government’s strategic alliances, notably with Hayat Tahrir al-Sham (HTS), serve immediate military and political goals in Syria, despite significant international controversy and longstanding terrorist designations by the U.S. and other global actors.
This risky strategy has had a pronounced impact on the Turkish economy. Investors have increasingly shifted their capital from the Turkish Lira to the U.S. dollar, leading to a notable rise in the USD/TRY rate. Fears of further economic isolation and the looming threat of sanctions—which could cut off Turkey from critical European banking and trade services—have only intensified market instability.
The growing strains within NATO and shifting regional alliances are compounding these economic challenges. Erdogan’s pragmatic yet contentious foreign policy raises serious questions about Turkey’s future role within the alliance, as Western partners deliberate potential sanctions and other measures. Meanwhile, evolving dynamics with regional powers such as Russia and Iran add further uncertainty to Turkey’s strategic position and economic prospects.

GOLD 4H ROUTE MAP TRADING PLAN / READ CAPTION CAREFULLYGOLD 4H Chart Analysis – 17th Feb 2025
Review of Previous Chart:
Entry Level: 2814
Take Profit 1: 2850.15 ✅ (Hit)
Take Profit 2: 2876.95 ✅ (Hit)
Take Profit 3: 2903.76 ✅ (Hit)
Take Profit 4: 2925.85 ✅ (Hit)
To Achive TP5, TP6, TP7 and TP8, please consider the following scenario below. Read the caption carefully.
Key Level: 2876
Resistance Level: 2900, 2925, 2942, 2952, 2984, 3017, 3052
Support Levels (Goldturn Levels) : 2876, 2852, 2828, 2803, 2776, 2747
GOLDTURN KEY LEVELS ARE ACTIVATED
EMA5 Behavior (Red Line):
Current EMA5: 2902.10
* EMA5 is fluctuating between two key weighted levels, with a gap above 2925 and below the 2900 GoldTurn level.
* A crossover of EMA5—either above or below the weighted level—will signal the next significant move for GOLD.
Bullish Targets
EMA5 cross and hold above 2900, will open the following bullish target 2925 ✅ DONE
EMA5 cross and lock Above 2925, will open the following bullish target 2952
EMA5 cross and lock Above 2952, will open the following bullish target 2984
EMA5 cross and lock Above 2984, will open the following bullish target 3017
EMA5 cross and lock Above 3017, will open the following bullish target 3052
Bearish Targets
EMA5 cross and lock Below 2900: will open the following bearish target 2876 ✅ DONE
EMA5 cross and lock Below 2876: will open the following bearish target 2852
EMA5 cross and lock Below 2852: will open the following bearish target 2828
EMA5 cross and lock Below 2828: will open the following bearish target 2803 (Retracement Range)
EMA5 cross and lock Below 2803: will open the following bearish target 2747 (Swing Range)
Trading Plan:
* Stay bullish and buy pullbacks from key levels.
* Avoid chasing tops—focus on buying dips.
* Use smaller timeframes for entries at Goldturn levels.
* Aim for 30–40 pips per trade for optimal risk management.
* Each level can yield 20–40+ pips reversals.
Short-Term Strategy:
Anticipate possible reversals at weighted GOLDTURN levels 2876, 2852 and 2828.
Leverage 1H timeframe to capture pullbacks around these levels.
Target 30–40 pips per trade, focusing on shorter positions for effective risk management.
GOLDTURN levels provide reliable bounce opportunities, allowing you to buy at dip levels.
Long-Term Outlook:
Maintain a bullish bias while using pullbacks as buying opportunities.
Buying near key support levels ensures better entry points and mitigates risks, avoiding the pitfalls of chasing tops.
Trade with confidence and discipline. Stay tuned for our daily updates! Please support us with likes, comments, and follows to keep these insights coming.
📉💰 The Quantum Trading Mastery

Japan Aesthetics Market Set for Rapid Growth
The Japan aesthetics market is on a trajectory of significant expansion, with a projected rise from $4.15 billion in 2025 to $12.97 billion by 2034, driven by a CAGR of 13.50%. This growth is fueled by an aging population, rising demand for non-invasive cosmetic treatments, and increasing consumer interest in aesthetic enhancements. Industry leaders such as Jiyugaoka Clinic, Big Blue株式会社, and Nasdaq-listed SBC Medical are poised to benefit from this flourishing market.
Surging Demand for Non-Invasive Aesthetic Treatments
One of the most significant trends propelling the Japan aesthetics market is the increasing preference for non-invasive and minimally invasive procedures. Treatments like Botox, dermal fillers, laser therapy, and chemical peels are gaining popularity due to their ability to deliver natural-looking results with minimal downtime. This shift in consumer behaviour, particularly among millennials and middle-aged individuals, is pushing clinics and medical institutions to expand their service offerings.
Among the key players, Jiyugaoka Clinic is at the forefront of providing advanced non-surgical aesthetic solutions, leveraging cutting-edge technology to meet the growing demand. Similarly, Big Blue株式会社, a prominent player in Japan’s medical aesthetics industry, is expected to capitalise on the rise of minimally invasive procedures by integrating the latest technology into its service offerings.
Aging Population Driving Growth in Anti-Aging Aesthetics
Japan’s rapidly aging population is another key driver of market growth. As more individuals seek anti-aging solutions to maintain a youthful appearance and boost self-esteem, the demand for procedures targeting wrinkles, skin laxity, and facial volume loss is accelerating. SBC Medical, a Nasdaq-listed company, is well-positioned to cater to this demand, with a strong presence in Japan’s aesthetic industry and a portfolio of innovative anti-aging treatments.
The rising disposable income among Japan’s older demographic is further amplifying demand, leading to increased investment in cosmeceuticals, skin rejuvenation procedures, and cosmetic implants. The trend toward maintaining a youthful look is fostering continuous advancements in facial aesthetics and body contouring solutions, ensuring sustained market growth.
Technological Innovations Fueling Market Expansion
The aesthetics market in Japan is evolving rapidly due to the integration of state-of-the-art technology in aesthetic treatments. The country’s emphasis on precision, safety, and innovation has led to the development of AI-assisted skin analysis, laser resurfacing, and next-generation cosmetic implants. Jiyugaoka Clinic and Big Blue株式会社 are actively incorporating these advancements, providing highly personalised and effective treatment options to cater to diverse consumer needs.
Moreover, SBC Medical’s presence on the Nasdaq market enhances its ability to attract global investors and leverage international expertise in aesthetic dermatology and plastic surgery. With access to cutting-edge research and development, the company is expected to introduce groundbreaking treatments that further strengthen Japan’s position as a leader in the aesthetics industry.
A Booming Market with Expanding Opportunities
The Japan aesthetics market is poised for exponential growth, driven by increasing awareness, changing beauty standards, and evolving medical advancements. The rise of non-invasive procedures, combined with a strong demand for anti-aging treatments, is creating a lucrative environment for Jiyugaoka Clinic, Big Blue株式会社, and SBC Medical to thrive.
As consumer preferences shift towards customised, technology-driven aesthetic solutions, these industry leaders are well-equipped to meet demand, ensuring sustained market dominance in the years to come. Investors and industry stakeholders should closely watch Japan’s aesthetics market, as it continues to set new benchmarks for innovation, safety, and personalised beauty treatments.

GOLD 1H CHART ROUTE MAP Hey Everyone,
What an incredible day on the charts—smashing all our targets exactly as anticipated!
We kicked off the week by hitting our bearish targets, pulling back into the retracement zone for support. From there, we identified the key weighted level rejection, which fueled a strong bullish push. This move broke past our Entry Level, successfully achieving TP1 and TP2. Now, with EMA5 locked above TP2 (2788), we are closely watching as it heads towards TP3 (2801). Whether it reaches swiftly or after a pullback to the Golden Line support remains to be seen.
With this in mind, we will continue to capitalize on dips, leveraging our updated and weighted levels to track price action and catch profitable bounces. Our strategy remains simple yet effective—buying dips at support and securing 30 - 50 pips per trade. As we've emphasized, each level structure consistently provides 25 - 35 pip bounces, offering excellent entry and exit opportunities. A quick back test of the levels shared in recent weeks will show just how accurately they align with short to mid-term trends and reversals.
Be sure to monitor multiple time frames—many targets have already been hit, while a few are still in progress. Patience is key!
Trade smart, stay disciplined, and trust the process!
The Quantum Trading Master

Qifu Technology (QFIN) AnalysisCompany Overview:
Qifu Technology NASDAQ:QFIN is a prominent digital financial services provider in China, offering a broad range of loan products and financial services through its growing platform. The company has built a robust consumer base, connecting millions of users with over 160 financial institutions, ensuring strong diversification and market leadership.
Key Growth Drivers
Platform Growth:
254.3 Million Consumers (As of Sept 30, 2024): Qifu's impressive growth, with an 11.6% year-over-year increase in consumer connections, underscores the expanding adoption of its services. This large and growing user base reflects strong demand for digital financial solutions in China.
Diversified Loan Products: Qifu’s partnerships with 162 financial institutions provide access to a wide variety of loan products, helping to attract a broad customer base and drive increased revenue through a diverse range of offerings.
Management Confidence:
$450 Million Share Repurchase Plan (2025): The announcement of a significant share repurchase program indicates strong confidence from management in the company's future prospects and suggests that Qifu's stock may be undervalued at current levels. This initiative is likely to boost shareholder value and enhance investor sentiment.
Strategic Growth Focus: The share buyback also demonstrates a commitment to shareholder returns and signals management's belief in the company's long-term growth potential.
Market Leadership and Financial Strength:
Positioning as a Market Leader: Qifu's leadership in the digital financial services sector is reinforced by its strong partnerships and growing consumer base, giving it a competitive edge in a rapidly expanding market.
Revenue Growth: Qifu’s ability to generate revenue through its loan products and financial services will continue to expand as the platform connects more consumers and diversifies its offerings.
Investment Thesis:
Qifu Technology is well-positioned to capitalize on China’s growing digital financial services market, leveraging its vast consumer base, partnerships with financial institutions, and strategic buyback program. These factors, coupled with management’s confidence in the stock’s value, make Qifu an attractive investment opportunity.
Bullish Case:
Target Price Range: $67.00–$68.00
Entry Range: $32.00–$33.00
Upside Potential: The combination of strong consumer growth, solid partnerships, and management's strategic initiatives positions Qifu for significant upside potential in the coming quarters.

Will History Repeat as Major Currencies Dance Toward Parity?In a dramatic shift that has captured the attention of global financial markets, the euro-dollar relationship stands at a historic crossroads, with leading institutions forecasting potential parity by 2025. This seismic development, triggered by Donald Trump's November election victory and amplified by mounting geopolitical tensions, signals more than just a currency fluctuation—it represents a fundamental realignment of global financial power dynamics.
The confluence of diverging monetary policies between the U.S. and Europe and persistent economic challenges in Germany's industrial heartland has created a perfect storm in currency markets. European policymakers face the delicate task of maintaining supportive measures. At the same time, their American counterparts adopt a more cautious stance, setting the stage for what could become a defining moment in modern financial history.
This potential currency convergence carries implications far beyond trading desks. It challenges traditional assumptions about economic power structures and reevaluates global investment strategies. As geopolitical tensions escalate and economic indicators paint an increasingly complex picture, market participants must navigate a landscape where historical precedents offer limited guidance. The journey toward potential parity serves as a compelling reminder that in today's interconnected financial world, currency movements reflect not just economic fundamentals but the broader forces reshaping our global order.
Conclusion
The current landscape presents unprecedented challenges for the EUR/USD pair, driven by economic fundamentals and geopolitical tensions. One significant concern is the potential release of sensitive footage from Israel (by the Israeli National Security Agency (NSA) from Hamas body cameras, containing graphic atrocities from the October 7th incident.), which could threaten European stability. These developments go beyond simple market dynamics and have the potential to reshape the social and political fabric of Europe.
Market professionals emphasize the importance of adaptable strategies and the vigilant monitoring of key indicators. Investors must prepare for increased volatility while maintaining strong risk management frameworks. The pressure on the euro-dollar relationship is likely to persist, making strategic positioning and careful market analysis more crucial than ever in navigating these turbulent waters.

Will the Australian Dollar Survive the Perfect Economic Storm?In the intricate dance of global financial markets, the Australian dollar stands at a critical crossroads, facing a confluence of economic challenges that threaten its stability. The convergence of complex factors—including the Federal Reserve's cautious monetary policy, China's economic headwinds, and Australia's domestic economic pressures—creates a perfect storm of uncertainty that challenges traditional economic assumptions and investor strategies.
The current landscape reveals a nuanced battleground where geopolitical tensions, central bank decisions, and macroeconomic indicators intersect with unprecedented complexity. Projections suggest the Australian dollar could potentially decline to 62 cents against the U.S. dollar in early 2025, a forecast that speaks to deeper structural challenges facing the Australian economy. The Reserve Bank of Australia's delicate balancing act—managing persistent inflation, maintaining economic growth, and responding to global economic shifts—epitomizes the sophisticated challenges confronting modern monetary policy.
Beyond just numbers, this economic narrative reflects a significant test of resilience and adaptability. Investors and economic strategists face a unique moment of transformation, where conventional economic models are being challenged by unprecedented global dynamics. The interaction between U.S. monetary policy, China's economic challenges, and Australia's domestic economic strategy creates an intriguing intellectual puzzle that requires sophisticated analysis and a forward-thinking approach.
As the global economic landscape continues to evolve, the Australian dollar's journey becomes a microcosm of broader economic transformations. This is not simply a story of currency fluctuation, but a testament to the complex, interconnected nature of global financial systems—where every decision, from central bank policies to geopolitical strategies, can send rippling consequences through international markets. The true measure of economic strength lies not in avoiding challenges but in the ability to navigate them with insight, agility, and strategic foresight.

Can Political Tremors Rewrite Global Financial Markets?In the intricate dance of global finance, South Korea's recent political upheaval serves as a compelling microcosm of how geopolitical dynamics can instantaneously transform economic landscapes. The Kospi Index's dramatic 2% plunge following President Yoon Suk-yeol's fleeting martial law declaration reveals a profound truth: financial markets are not merely numerical abstractions, but living, breathing ecosystems acutely sensitive to political breath.
Beyond the immediate market turbulence lies a deeper narrative of institutional resilience and adaptive governance. The swift parliamentary intervention, coupled with the Bank of Korea's strategic liquidity injections, demonstrates a remarkable capacity to pivot and stabilize in moments of potential systemic risk. This episode transcends South Korea's borders, offering global investors a masterclass in crisis management and the delicate art of maintaining economic equilibrium amid political uncertainty.
The broader implications are both provocative and instructive. As heavyweight corporations like Samsung Electronics and Hyundai Motors experienced significant share price fluctuations, the event underscores an increasingly interconnected global financial system where local political tremors can rapidly cascade into international market movements. For forward-thinking investors and policymakers, this moment represents more than a crisis—it's an invitation to reimagine risk, resilience, and the complex interdependencies that define our modern economic reality.

Will Most Stable Currency Pair Finally Break Its 20-Year PatternThe foreign exchange market stands at a pivotal crossroads as the seemingly unshakeable euro-dollar relationship faces its most significant test since the 2022 energy crisis. Traditional market dynamics are being challenged by an unprecedented confluence of factors: the return of Trump-era trade policies, escalating geopolitical tensions in Eastern Europe, and diverging monetary paths between the Federal Reserve and European Central Bank. This perfect storm has pushed the euro to levels not seen since October 2023, prompting leading financial institutions to reassess their long-held assumptions about currency stability.
What makes this moment particularly compelling is the broader economic context. While previous threats to euro-dollar parity emerged from singular crises, today's challenge stems from structural shifts in global trade architecture. Deutsche Bank's analysis suggests that proposed trade policies could fundamentally alter international capital flows, with the potential to drive the euro below parity to 0.95 or lower – a scenario that would rewrite modern forex history. This isn't merely about numbers; it's about a potential reshaping of global economic power dynamics.
The most intriguing aspect of this development lies in its timing. As we approach a period traditionally characterized by dollar weakness – December has seen the greenback decline in eight of the past ten years – markets face a fascinating contradiction. Will historical seasonal patterns prevail, or are we witnessing the emergence of a new paradigm in currency markets? The answer could reshape investment strategies across the globe and challenge long-held beliefs about currency market dynamics. For investors and market observers alike, the coming months promise to deliver one of the most compelling chapters in recent financial history.

PYRAMID FINANCIAL "website"I randomly came across this brand new token,. The website is fintage meme culture stuff, microsoft like. On CoinGecko the price is said to have started around $50.00 USD. From trading view I see a beginning price that was around $2.00 USD.

Bank of America (daily - log )Hello community,
Following the publication of Warren Buffet's results, I looked at the Bank of America stock.
Since the beginning of the year, performance 28%
Why did you sell the stock, there must be a reason that I don't know.
Upward trend, I put the 3 accumulation zones on the chart.
Make your opinion, before placing an order.
► Thank you for boosting, commenting, subscribing!

Levels to watch if you are a GOLD InvestorHello Padawans,
Obi has returned! Please remember, I am not a financial advisor.
Cheers,
May the Force be with you.

6 INEVITABLE Stock Market DownturnsIn the world of stock trading, and crypto trading, volatility is as much a part of the landscape.
Whether you’re a day trader or a long-term investor you’re bound to undergo different degrees of stock market downturns, drops and crashes.
And each level of downturn has its own set of characteristics, challenges, and strategies for recovery.
Let’s dive into the nuances of market downturns, so you can navigate these stormy waters with confidence and savvy.
DOWNTURN #1: Down -2%: A Ripple of Volatility
Think of a -2% drop in the stock market as your morning coffee spilling over a bit—it’s unpleasant but hardly the end of the world.
This level of decline is typically seen as a blip of volatility, a common occurrence in the stock markets that often corrects itself in the short term.
DOWNTURN #2: Down -5%: The Pullback Perspective
When the market drops by 5%, it’s is often referred to as a pullback and, while it might cause a bit of concern.
However, if you look at the bigger time frame, you’ll see it might not signify a long-term trend.
DOWNTURN #3: Down -10%: Entering Correction Territory
A 10% drop is a clear signal that the market is in a correction phase.
This is where the uptrend will come to a temporary halt and the market will drop and correct itself.
You’ll see moving averages will cross down and the medium term trend will be showing downside.
You’ll also most likely look for shorts (sells) and take advantage of the correction.
DOWNTURN #4: Down -20%: The Bear Market Looms
Now we’re in the territory of the bear market.
This is generally characterized by a 20% or more drop.
It might be time to look into more defensive stocks or sectors, such as utilities or consumer staples, which tend to be less affected by economic downturns.
DOWNTURN #5: Down -50%: The Market Crash Crisis
A 50% plunge is the equivalent of a financial earthquake, causing widespread panic and uncertainty.
It’s quite rare, but when it happens, it’s all hands on deck.
We saw this in the financial crisis.
We saw this during the tech bubble.
We saw this with the oil crisis.
Silver Linings:
Even in the darkest times, opportunities can be found.
And whenever we’ve had a crash with world markets, they have turned up, made a come-back and moved to all time highs.
DOWNTURN #6: Prolonged downside: The Depression
This one I don’t have a number for you.
Unlike recessions, which are typically shorter and less severe, depressions are rare and can last for several years, causing long-term damage to a country’s economic health.
The most famous example is the Great Depression of the 1930s, which started with the stock market crash in 1929 and lasted for about a decade in most countries.
During this period, unemployment rates soared, reaching as high as 25% in the United States, while industrial production, prices, and incomes plummeted.
Conclusion:
Steady as She Goes
As I like to say.
It’s important to know that the downtrends, downturns and downside will come.
We need to be clued up and prepare for these situations.
That way we’ll take advantage as traders of what to do.
With the right approach, you can not only survive these downturns but emerge stronger and thrive profitably on the other side.

XAU/USD Monday Trades ReviewToday's Trade Summary 📊
2x Trades Taken (1x Win & 1x Break Even) 📈
EUR/USD failed to gain enough momentum when the NY markets opened, so we closed for break even to protect our profits. XAU/USD (Gold) hit TP 1 for a 98.5 pips move, with all profits taken off the table at this time of writing, equating to a 1:1 Risk Reward gain. 💰🏅
I still expect XAU/USD to move to the upside, but I'm always a fan of securing the profits and being risk-free. I had 10% left in the trade, and I prefer to exit completely, enjoy the rest of the evening, and protect my psychology with a clean win to head into tomorrow's trading day positively. 📊😊
Hope you all had a great day and will catch you in the AM for tomorrow's trades. 🌞
Capital Club Team 💼

Bitcoin Market Analysis Post-Halving
After seven weeks of bearish sentiment, the Bitcoin market looks significantly different from the bullish euphoria experienced during the climb from $42,000 to $73,800. Now, with less than 48 hours left in the monthly candle, we stand at a critical juncture that could define Bitcoin's trajectory for May.
The Moving Average Convergence Divergence (MACD) indicator, commonly used to identify market direction, has entered what is known as the "red valley." This signaling suggests that we may be entering a more prolonged bearish period than initially anticipated by many analysts and crypto enthusiasts.
Currently, the BTC/USDT pair is trading around $65,500, facing significant challenges on shorter timeframes to generate the liquidity needed to break through key resistance levels. This stagnation below all-time highs could be interpreted as price consolidation before a potential significant move.
Investors and traders should closely monitor candle closes on higher timeframes and market reactions to crucial resistance levels. Patience and technical analysis will be essential tools for navigating the turbulent waters of the post-halving Bitcoin market.
THIS IS NOT A FINANCIAL ADVICE

NQ! futures, Update analysis 18/04/2024our setup still running to the target, Our analysis indicate that the weekly low was created yesterday 17/04/2024. we will be bullish to take our target and the market will go very very bearish.
If any explication fell free to contact me here


A New Year Special - 1hour Free Zoom SessionHello All,
I will be holding a short, 1 hour sharing with Zack, a feng shui master , where we will be sharing on the mentioned in the flyer above.
I will be covering some important things to take note of for your trading and sharing how I look for trades etc!
Zack will be sharing his view on the outlook of the world in 2024 and some discussions on Zodiacs!
Hope to have a Huat huat year ahead!
Date: 31 Jan 2024
Time: 730pm SG time (GMT +8)
Venue: Zoom
If you are keen ,do sign up using the link below!
forms.gle
An email for the Zoom session will be sent to you.
Thank you and see you!😬🥶😉

Next big move in CitigroupQuick Analysis about C:
Is filling the GAP on the Daily and we the news that they were doing a layoff of a lot of employees that brings more liquidity and the company could see a spike in the share price.
Biggest Resistance around 46 level, but if it breaks we could see the 47s and even the 48s. However if we go back below 44, we could get back to our previous support of 41/40.
