TMB uptrend incomingUptrend signal is incoming to TMB, after the prices solidly down for so long. If prices can reach more than 1.67 - 1.70, It will be significantly upped.
Financial


XLF Strong compared to other sectorsTicker: $XLF
Huge gap up open and bulls ran with it. The only reason why SPY was so strong is because of the financial sector.
XLF closed above the All time high (30.33)! We need more bull volume to confirm it is a clear break or else I would still consider it a double top with 30.33 if we reject.
If we consolidate pre market and bulls open with fire, that would be ideal for bulls.
If we consolidate hard, expect a 4 hour high low to form because retesting the All time high of 30.46.

BB&T Gann ProjectionsUse the low of 0.50381626 ; use the high of 29 & project out from there and these critical levels present themselves
acknowledge the strength of these gann levels
manage your own risk
gl hf
xoxo
snoop

US oil prices had their biggest spike. How to earn on it?US oil prices had their biggest spike. Oil prices soar after attacks on Saudi facilities and ended nearly 15% higher on Monday. Abruptly ceased more than 5.7 million barrels per day of production.
We consider this situation a unique opportunity for earning. The fact is that the disappearance of 5 million b / d of oil is a temporary phenomenon. According to some estimates, most of them will return to the market in the coming days. Also, Trump is ready to sell oil from US strategic reserves to stabilize the market.
Accordingly, the current growth is an emotional reaction. So oil will be adjusted. Given the scale of yesterday's growth, the correction will also be significant. So today we recommend oil sales. It may be necessary to be in the position for several days, but the goal is clearly worth the time spent.
Another opportunity for earning. The Russian ruble entered the sales zone. The next round of sales (final) we will start with 62.50 (unless, of course, the price reaches these marks).
And finally, the recommendation to buy gold and other safe-haven assets is also relevant in the light of current events. The US has already managed to blame Iran for the attack, so in theory, the situation could be developed.
Meanwhile, financial markets received another batch of evidence in favor of the global economic slowdown. This time, China gave cause for disappointment and concern. Industrial production in Sino grew by 4.4%, which is the minimum increase since 2002 (!). So if the oil shock goes on, the chances of a global recession will increase.
Today is formally out of surprises. It is worth paying only to industrial production in the USA. But in general, markets are beginning to prepare for the Fed results announcement. But we’ll talk about it tomorrow. And today, we note that dollar sales are still one of our priorities in trade.


Capital One data breach means nothing - BullFundamental Analysis
It appears Capital One isn’t the only company affected by this--it’s just the first company to publicly acknowledge it has been hacked and the most proactive in addressing the security situation. Meaning... as soon as other companies report the same, they will get the bad attention.
Because of the breach they will lose $150M-300M, which is nothing for this size of a bank.
The real impact might be more of sentiment towards the stock though.
Equifax very recently had a much more significant breach, and the stock just brushed it off.
Technical Analysis
Watch the SMA(50) as support.
OBV and RSI=52, did not reach dangerous levels on this drop.
MACD did cross below the signal, but it is on its way up.

UPDATE: QUDIAN INC - NYSE: $QD Continues To Grind HigherBack on June 18th, we Profiled QUDIAN INC - NYSE:QD with the stock trading at the $7.50 level at that time and noted that it appeared that Buyers were perhaps becoming more aggressive with their purchases as the stock was grinding higher and registering higher lows and higher highs, which remains the case today as evidenced in the Daily chart above.
While QD printed a recent high just beneath the $9 level, we continue to witness the stock trading above all of its important moving averages 20/50/200 DMA's, which depicts a favorable technical posture as well as continuing to grind northward.
Although QD has yet to overcome and clear the $9 figure and Hold thus far, both investors/traders may want to continue to monitor the action closely in the days/weeks ahead for if QD can take-out the $9 figure and perhaps of more importance, clear the $9.15 level and 'stick', we believe that such development would likely trigger its next advance into our original/initial $10-$12 zone objective, for starters.
Nonetheless, we have a stock where once again Buyers appear to becoming more aggressive with their purchases. Furthermore, QD remains in fine technical shape across multiple time-frames Daily/Weekly/Monthly and in the process, riding within a channel that potentially suggests that once the upper boundaries are hurdled, its likely that higher prices are in the offing.
Thus, both investors/traders may want to (continue) put QD front-and-center on their radars seeking further clues/evidence of a potential northbound move in the making.

Market CrashI didn't notice the purple trend line before, but it started the 2008/9 Financial Crisis. I see this as heavy resistance, if we get rejected at this trend line then for sure we will have a major economic collapse. If we bust through this resistance line then I can see the market going nuts for 5-6 more years. I tend to think we crash within the next year and a half.
Feel free to comment, I appreciate it and also smash the "like" button! Thank you!
- Matt

The time is 11.59.59, SPY-RUS2000-XYT-gold stackAlright everyone here is a clean video of what will soon happen in the markets. I will keep everyone up to date with this situation! 30% drop is on the way.

btc back to 5ksorry crypto nerds btc isnt breaking 10k anytime soon. golds taking the floor. btc taking the back seat. bye bye stock market


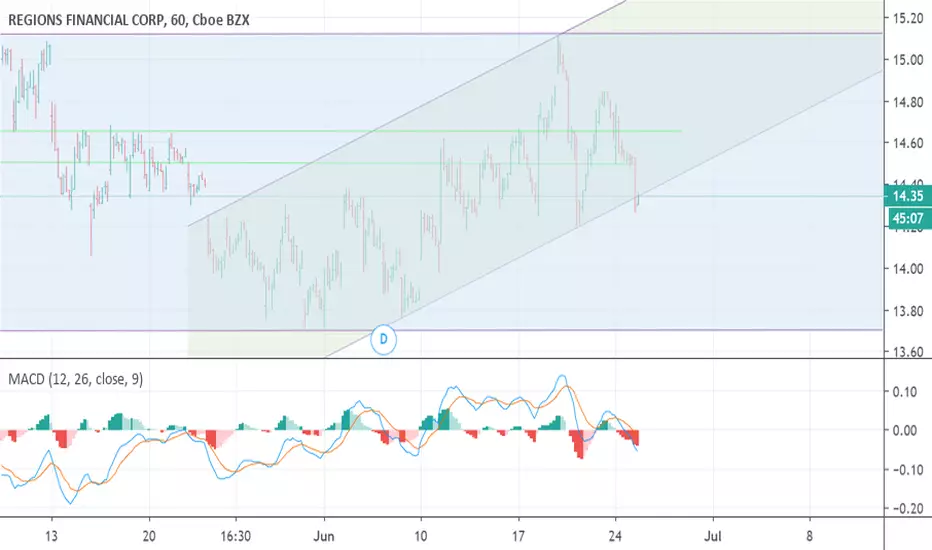
RF downward channel breakoutI've liquidated my long position in Regions Financial after this morning's downward channel breach. RF is still in its horizontal channel, so in the medium term this stock is looking neutral. In the short term, it may head to channel bottom.
Square bearish in the short term-- buy at channel bottomSquare has established an uptrending channel, but it reached channel top yesterday and today turned negative. Look for further downside next week and buy any price below $67 for a profit by Friday.

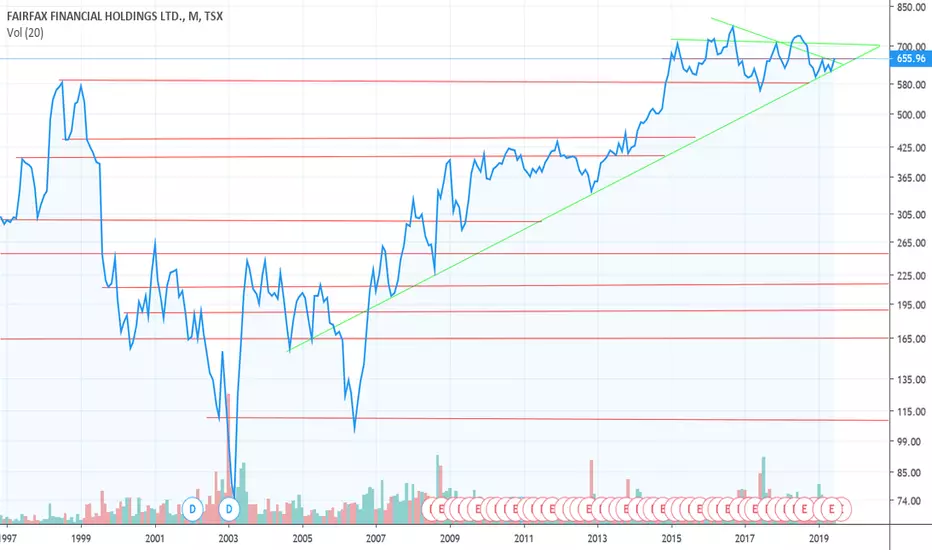
Is Fairfax Financial about to break a Ascending Triangle?It appears as though Fairfax is trading in one Giant Ascending Triangle that is "potentially" about to Moon.
Time will tell per usual.
Financial Astrology signals big GBPUSD reboundcan financial astrology accurately predict the future market? here is my This is my 7th time to post real time forecasts in Tradingview.
I could end up be way off on this single prediction, but trading is not about one single trade but with lots and lots of trade of repeated set up.
And similarly, as a trader, we draw trendlines , listen to news, and have an expectation of what will happen tomorrow (your own prediction), and many retail investor have overlook this piece of "Real Time Confirmation of your Thinking" and keep on changing the outlook for tomorrow and blindly trade according to the momentum and sentiment, or news being circulated in the market.
As a astrology trader, we should all have a basic forecast of the immediate future from our own analysis, then we should monitor the market for some time AFTER the analysis was made and see if the REAL TIME Market is doing the same as you thought. Once we synchronize our thought with what the market is actually unfolding, then we can start to trade the market. This will eventually help you identify the noises of the market and STOP from cutting loss when there is a false breakout of the range that the Market Maker arbitrarily makes, or irrelevant news being circulated in the mass media.
Instead, what we should all do, is have a general idea the market is going to rising or falling in this upcoming few days, and then find the repeating cycle that the market had been unfolding again and again in the market and trade with that same set up repeatedly.
We, Trineaspect.com aim to teach you how to discover such financial astrology cycle which is repeatedly happening in the market every week, and understanding that will give you the correct starting point on your further search for the ultimate financial astrology truth, the wd gann master time factor.
and we have just recently launched FREE NEWS TRADING WORKSHOPS to help traders, please email us (contacts available at the website) with the subject "code: #FNTW" for details
Trineaspect.com & Khit Wong hold no responsibility in any investment decisions made by reading the above material. The contents there are solely for Learning Finance Astrology educational purposes.

financial astrology cycle signaling stock market crashcan financial astrology accurately predict the future market? here is my This is my 8th time to post real time financial astrology forecasts in Tradingview.
I could end up be way off on this single prediction, but trading is not about one single trade but with lots and lots of trade of repeated set up.
And similarly, as a trader, we draw trendlines , listen to news, and have an expectation of what will happen tomorrow (your own prediction), and many retail investor have overlook this piece of "Real Time Confirmation of your Thinking" and keep on changing the outlook for tomorrow and blindly trade according to the momentum and sentiment, or news being circulated in the market.
As a astrology trader, we should all have a basic forecast of the immediate future from our own analysis, then we should monitor the market for some time AFTER the analysis was made and see if the REAL TIME Market is doing the same as you thought. Once we synchronize our thought with what the market is actually unfolding, then we can start to trade the market. This will eventually help you identify the noises of the market and STOP from cutting loss when there is a false breakout of the range that the Market Maker arbitrarily makes, or irrelevant news being circulated in the mass media.
Instead, what we should all do, is have a general idea the market is going to rising or falling in this upcoming few days, and then find the repeating cycle that the market had been unfolding again and again in the market and trade with that same set up repeatedly.
We, Trineaspect.com aim to teach you how to discover such financial astrology cycle which is repeatedly happening in the market every week, and understanding that will give you the correct starting point on your further search for the ultimate financial astrology truth, the wd gann master time factor.
and we have just recently launched FREE NEWS TRADING WORKSHOPS to help traders, please email us (contacts available at the website) with the subject "code: #FNTW" for details
Trineaspect.com & Khit Wong hold no responsibility in any investment decisions made by reading the above material. The contents there are solely for Learning Finance Astrology educational purposes.

WD GANN FINANCIAL ASTROLOGY working in the marketWD Gann Financial Astrology. Click on the play button to see what had happened
This is my 6th time to post real time forecasts in Tradingview.
I could end up be way off on this single prediction, but trading is not about one single trade but with lots and lots of trade of repeated set up.
And similarly, as a trader, we draw trendlines , listen to news, and have an expectation of what will happen tomorrow (your own prediction), and many retail investor have overlook this piece of "Real Time Confirmation of your Thinking" and keep on changing the outlook for tomorrow and blindly trade according to the momentum and sentiment, or news being circulated in the market.
As a trader, we should all have a basic forecast of the immediate future from our own analysis, then we should monitor the market for some time AFTER the analysis was made and see if the REAL TIME Market is doing the same as you thought. Once we synchronize our thought with what the market is actually unfolding, then we can start to trade the market. This will eventually help you identify the noises of the market and STOP from cutting loss when there is a false breakout of the range that the Market Maker arbitrarily makes, or irrelevant news being circulated in the mass media.
Instead, what we should all do, is have a general idea the market is going to rising or falling in this upcoming few days, and then find the repeating cycle that the market had been unfolding again and again in the market and trade with that same set up repeatedly.
We, Trineaspect.com aim to teach you how to discover such cycle which is repeatedly happening in the market every week, and understanding that will give you the correct starting point on your further search for the ultimate financial astrology truth, the wd gann master time factor.
and we have just recently launched FREE NEWS TRADING WORKSHOPS to help traders, please email us (contacts available at the website) with the subject "code: #FNTW" for details
Trineaspect.com & Khit Wong hold no responsibility in any investment decisions made by reading the above material. The contents there are solely for Learning Finance Astrology educational purposes.

Are you paying attention ?It can be a challenge comparing the timeframes of two bubbles in TA, when one runs over the course of 10 years vs 2 years.
Yet i believe a striking correlation playing out here between two completely different markets in it's own timeframe.
As always, both bubbles is naturally fuelled by the same greed and stupidity that is coded into our human DNA .
We don’t mean to get ourself in trouble by creating bubbles, but we just can't help it.
It’s what makes us human. It’s the same reason we can be so certain that the next phase must begin.
What im saying is nothing new under the sun. You can go back in history and study these cycles playing out over and over. It always comes down to two human components.
Immense greed and extreme fear, resolving in its own way. Like Ying and Yang, a balance is always kept. It might temporary bend further to the up or downside but the ledger is always kept in check and unbalanced profits will be resolved with unbalanced losses.
There’s nothing inherently evil about a bull market coming to an end, however history tells us pain and fear is two cousins that few remember at this point in the market cycle.
Drawing correlation to the Bitcoin bubble in 2017, every retail investor was a genius and money was to be made whatever u did, as long as u bought - Did u get that last part?
As long as u bought. Because bubble tops paints its own beautiful story, which we can use to our advantage if we pay attention. The signs are always there, and im simply hinting the strong probability of human faults once again painted on the charts.
For the retail investor which has been genius for years in Nasdaq, DJI or whatever he bought, the next phase won’t be as quite as easy.Conditioned by 10 years of buying the dip, the retail investor will slowly but surely bleed out in the bear market. As they continuously buy the dip, but never secure profits on the bounces, slowly but surely, most will lose their profits from the bull years as the balance is restored to the ledger. That’s what makes it the bear market.
Let’s see just how many skeletons we have in the closet for this bear cycle.
I bet there’s some intersting stuff from 2008 that was swept under the carpet which will come out and play.
It'll probably get very ugly.
Bull markets often extend way beyond expectations. The following cycle tend to do the same.
Best of luck
Short all bounces.

WFC forming a Head and ShouldersPossible Head and Shoulders pattern forming on WFC though too early to tell. The biggest test will be the trend line (black). If the stock breaks down expect a retest of the trendline before finally completing the H&S pattern. Based on how long the stock has adhered to the black trendline a break down would be a long-term bearish signal.
Note where the entry point is. Make sure the H&S is complete before entering. The unfilled gap is still lingering.
The two targets on the chart are past points of resistance and good places to take some profits.


indicator of financial crisis?#SPX is again in on of the worst positions ever, this is most likely be a nice short from this level.
Monthly looks the same as it did before 2000 crisis and 2008.
This is normal for every aprox. 10 years now.
We will se in a year where we land. and i hope it is not on the lower support.

SPY, QQQ, and XLF face key resistance tests this coming weekThe oversold bounce is real and bulls have changed the daily trends to their favour, but the weekly trends have yet to change. Here's what I'm looking for heading into next week - We have tight ranges on SPY, Tech and Financial sectors and the breaks of these ranges will give us clues for what to expect this coming week
