Bearish on GBPUSD On the Monthly Time frame GBPUSD is giving us signs that it wants to drop
So as pro traders we wait for other confirmations before hand
Financials

BLK - Strong uptrend is intact with new highs Upward trend, which started from the covid bottom of 2020, continues.
The total assets managed by the company reached 11.5 trillion USD, with an annual increase of 2.4 trillion USD.
The company increased its quarterly revenues by 15% to $5.197 billion, exceeding expectations of $5.007 billion.
Earnings per share for the last quarter were $11.46, above expectations of $10.38.
The shares of the company, which announced a net profit of $1.6 billion in this quarter, exceeded the 2021 high level of $970 and reached $990, and its current market cap is $147 billion.
The stock, which has a dividend yield of 2%, is trading with a price-earnings ratio of 24.

Clearwater Analytics, volatility contration before breakoutClearwater Analytics provides SaaS solutions for investment data aggregation, accounting, analytics, and reporting services
The 3-month highs and 6-month highs list is full of financials with some software, and NYSE:CWAN is making 52-week highs
Is the #1 in the IBD industry rank with a 91 relative strength rating, clearly a market leader and is only making its first base within its uptrend
Its key the price respect the $22 zone for its trend to continue.

Are financials topping here? Financials have been one of the leading and strongest sectors on the back of rate cut narratives.
The resilience and strength can easily be observed...
XLF has been making new highs despite the QQQ & SPY not.
Now it begs the question; is all the rate cut priced in?
We think financials are set for some downward rotation.
If this rotation occurs it opens up many other opportunities as financials do carry some decent weight in the indices.
Today names like JPM & XLF gave us a potential daily topping tail.

Sector Rotation in Anticipation of Rate CutsMarkets have rebounded sharply after last week's fear-driven decline. Despite this, rate cuts are still anticipated in the upcoming FOMC meetings. Changes in monetary policy often benefit some sectors over others, providing investors a chance to adjust their portfolio allocations accordingly.
This paper delves into a comparative analysis of sectors around monetary policy pivots to highlight how a spread between S&P Financials Select Sector and S&P Utilities Select Sector stands to benefit in the coming months. It also describes a hypothetical trade setup using CME E-Mini S&P Select Sector futures which can be used to express the view in a margin-efficient manner.
RATE CUTS WILL HURT FINANCIAL FIRMS
Financial firms benefit significantly from higher rates, as these drive net interest margin (NIM) expansion, boosting their bottom line. However, when rates start to decrease, this positive impact reverses.
The Financials Select Sector ETF (XLF) is comprised of 25% banks, 31% financial services firms, and 16.6% insurance firms. All these firms have benefited from higher rates, albeit the strongest impact may be limited to banks and insurance firms whose overall bottom line is significantly impacted by expanding NIM.
In the last three monetary policy pivots, XLF has declined by an average of 5.6% over the following six months. Conversely, at the start of rate hikes, the ETF has typically risen by an average of 3.7% in the subsequent six months. While the most recent pivot in 2019 saw an increase in XLF, the overall average trend suggests a decline.
The trend is visible even when examining the relative performance of XLF and SPX. Following rate cuts, the spread declined by an average of 2.8% while during rate increases, it declined by just 1.1%.
There is another headwind facing the XLF ETF, particularly banks – rising credit delinquencies. Credit card delinquencies are especially concerning as they stood at the highest level in 13 years as of Q1 2024. Overall delinquencies are also rising and near the highest level since 2021.
Updated data from the New York Fed has shown that conditions remained stressed in Q2 with total delinquencies at 3.2%. Particularly concerning were severe (>90 days delinquent) credit card delinquencies at a staggering 10.93%. Consumers are increasingly relying on unsustainable credit card debt to cover expenses. As delinquencies remain elevated, issuing banks must increase loan loss provisions which impacts earnings directly.
Source: New York Fed
As credit card usage becomes unsustainable, another class of companies in XLF – payment processors - will also be hurt. The largest payment processors (Visa, Mastercard, and Amex) represent nearly 15% of the XLF index.
RATE CUTS WILL BENEFIT UTILITY FIRMS
Unlike financial firms, utility companies have struggled in a high-rate environment. As their huge capital expenditure is often fueled by debt, higher rates result in narrower profits.
As rates decline, debt payments decrease, leading to expanded profit margins for utility firms. Historically, the ETF has shown a significant average increase after rate hikes and a smaller increase after rate cuts. This behavior might be due to investors anticipating a weakening economy following rate cuts, which would favor utility firms. However, the index tends to correct later once rates remain elevated for some time.
The impact is close to even when comparing the relative performance against the broader S&P 500 with both periods resulting in a ~6% increase in the spread.
Utility firms are also likely to outperform in case of a US recession. Although some of the concerning economic data has normalized over the past week, the risk of a recession in the US persists. As utility firms provide essential services, their cash flows are relatively stable even during recessions. While consumers may cut down on discretionary spending, spending on essential services remains unaffected.
Mint Finance previously covered these factors in a separate paper.
HYPOTHETICAL TRADE SETUP
A pivot in Fed Policy is expected in the upcoming FOMC meetings with the CME FedWatch tool signaling 100 basis points of rate cuts in 2024 itself. Rate cuts will impact different sectors differently. While utility firms stand to benefit from lower rates, financial firms may see lower profits.
Source: CME FedWatch
The spread between CME E-Mini Utilities Select Sector Futures (XAU) and CME E-Mini Financial Select Sector Futures (XAF) has been rising since March as it has favored XAU. The spread responded strongly to a shift in rate cut sentiment as well as the recession signal at the start of the month.
The recent correction over the past week offers an improved entry point into the spread.
A hypothetical trade setup using XAU futures expiring in September (XAUU2024) and XAF futures expiring in September (XAFU2024) is described below. CME offers margin offset totaling 60% for this spread reducing the capital requirement to USD 3,740.
MARKET DATA
CME Real-time Market Data helps identify trading set-ups and express market views better. If you have futures in your trading portfolio, you can check out on CME Group data plans available that suit your trading needs tradingview.com/cme.
DISCLAIMER
This case study is for educational purposes only and does not constitute investment recommendations or advice. Nor are they used to promote any specific products, or services.
Trading or investment ideas cited here are for illustration only, as an integral part of a case study to demonstrate the fundamental concepts in risk management or trading under the market scenarios being discussed. Please read the FULL DISCLAIMER the link to which is provided in our profile description.

Will Aston Martin return to its former glory ? LSE:AML
Aston Martin shares are down around 35% since the beginning of 2024. Shares continues to decline since august 2023 what´s around another 30% (65% from august 2023 till now). Aston Martin shares don´t look fresh even from wider perspective as you can see the historic chart.
Company itself has occurred in kind of transition since Lawrence Stroll became executive chairman in early 2020 with 16,7% stake in the company. Moreover he re-branded F1 team Racing Point as the Aston Martin F1 Team in 2021. He´s really into it.
Briefly about Aston Martin F1 Team 🏎️:
- Lawrence Stroll´s given his son every opportunity to become an F1 driver. He became a stable part of F1
- Stroll said Aston Martin sees its first victory in F1 this year
- building new Aston Martin factory
Company signed new CEO Adrian Hallmark as a part of transition. Former Chairman and CEO of Bentley Motors will replace Amedeo Felisa no later than 1st October 2024.
Aston Martin also announced the delivery of four new models in 2024 (Vantage, upgraded DBX707, V12 flagship sports car and more) which would power growth in the second half of the year and beyond.
All these news sounds good. ✔️ However the finances don´t look so great.
Aston Martin´s still BLEEDING. 💉
- widening losses in the first quarter due to stopped production of its core models ahead of a launch a new vehicles
- revenue fell 10% to 267.7£
- debt increased 20% to 1.04£
- wholesale volumes slumped by 35% in Americas, by 30% in the U.K., by 14% in Asia-Pacific and by 17% in the wider Europe, ME and Africa region
Will Aston Martin shine again ? Well, it seems that only time will tell us whether they´ll succeed
Fun fact:
Aston Martin officially opened new "Aston Martin Residences Miami", an ultra-luxury brand´s first real estate project.
You can read more about the project at official Aston Martin page.
Sources:
cnbc.com
astonmartin.com

MASTERCARD Short-term pull-back has begunLast time (August 23 2023, see chart below) we looked at Mastercard (MA) the 1D MA50 (blue trend-line) gave us a solid buy opportunity, which easily hit our 415.00 Target:
The price is now starting to pull-back after marginally breaking the top (Higher Highs trend-line) of the 1.5 year Channel Up (blue). It already broke below the medium-term (dotted) Channel Up and is headed towards the 1D MA50 (blue trend-line).
With the 1D RSI already on Lower Highs (i.e. a Bearish Divergence against the stock's Higher Highs), we believe this is an early Sell Signal on the short-term. The March 13 2023 Target was the 0.382 Fibonacci retracement level, so we are currently aiming for $440.00.
-------------------------------------------------------------------------------
** Please LIKE 👍, FOLLOW ✅, SHARE 🙌 and COMMENT ✍ if you enjoy this idea! Also share your ideas and charts in the comments section below! This is best way to keep it relevant, support us, keep the content here free and allow the idea to reach as many people as possible. **
-------------------------------------------------------------------------------
💸💸💸💸💸💸
👇 👇 👇 👇 👇 👇

$HOOD FINDS FOOTING AMIDST BULL MARKET$HOOD:1D
Long-term Fib Retrace from ATH.
Short-term Fib Extension from January 2024 lows.
Top indicator = Relative Strength Index (RSI)
Middle indicator = On Balance Volume (OBV Oscillator)
Bottom indicator = Directional Movement Index (DMI)
VWAP from highest high (yellow)
After coming out of a protracted, multi-year basing (blue), upside price momentum looks to be waning with bearish price to RSI divergence (violet) forming on the 1D time frame.
NASDAQ:HOOD volume flows as measured by on-balance-volume (OBVOSC_LB, middle indicator) are extremely constructive and posting historically high levels from price inception at initial IPO.
Given the strength of the bullish trend as measured by the directional movement index (DMI, bottom indicator) price is well cushioned to withstand a pullback and remain positively trending.
EWT counts are speculative and intended as a theoretical guide rather than an absolute path. The 3rd wave up could have the momentum to reach the 1.382(22.51) before meeting an increased potential for pullback into the 4th wave. The VWAP from ATH (yellow) is roughly in confluence with the 0.786 (15.81) and provides an impulsive shelf of support for a retrace as long as price were to consolidate above these respective levels.
The next level of downside support would be the 0.5(13.57) price level and while a breach of this particular level would not invalidate the count by dipping below 2 (10.38) it would invalidate my thesis and close the trade.
Upside price target for a 5th wave would be a 23% move to the upside with consolidation above the longterm Fib level of 0.786 (23.54) by end of July 2024. The secondary, 'reach target' sits 41% percent above current levels at the short-term 1.786 (27.00) Fib level. I would like to see this 1.786 (27.00) level taken out before end of November, 2024.
NOT FINANCIAL ADVICE.

SOFI: Bearish until channel is broken convincingly Sofi does banking differently and has great potential, but it is still a bank and banks are not a great investment right now. I don't see the price getting above the channel anytime soon. But that doesn't mean the stock is untradable. There are a couple of bearish scenarios at the moment.
1.Crash now: In this scenario price is on the intermediate C wave. In that case wave 3 should be in progress right now and price should be taking a nosedive. Breaking $6.4 will confirm the scenario.
2. Crash later: In this scenario price should complete Minor B wave triangle for intermediate wave B. In this case price should move sideways for a few more weeks before making a move higher to test the upper range of the channel. The channel might get broken as a fake out move before heading south.
Until we see another all time high on SOFI, bull case is an alternative scenario for the moment.

The power of a stop-lossJackson Financial offers retirement planning and annuity products, helping clients protect their retirement savings and income
After an attempt back in 2022, I got stopped out and took a small loss
If I hadn't taken that loss I would have had dead money for almost 2 years!
Right now, NYSE:JXN is breaking out of a 9-week base after a weekly outside bar, so this is the buy
Always trade with stops.

Bitcoin(BTC/USD) Daily Chart Analysis For Week of Feb 9, 2024Technical Analysis and Outlook:
Bitcoin has experienced a significant increase during this week's trading session, surpassing the predicted Inner Coin Rally of 44200. As a result, it has achieved our Outer Coin Rally projection of 47500. The next target for Bitcoin is to reach the Key Resistance level of 48700, followed by the Inner Coin Rally of 49500. The ultimate goal is to achieve the Outer Coin Rally of 53000. However, if there is a decline in the coin value, it may retest a Mean Support level of 46000 before continuing its upward trend.

Bitcoin(BTC/USD) Daily Chart Analysis For Week of Jan 26, 2024Technical Analysis and Outlook:
Bitcoin continued a pivotal squeeze to complete our Inner Coin Dip 38500 and is rebounding to the newly created Mean Res 43200 and Inner Coin Rally 44200. On the downside, the coin might retest a Mean Sup 39500 and completed Inner Coin Dip 38500 before continuing its upward trend. .

Insider buying and beautiful Elliottwave pattern...FB Financial Corp. is a bank holding company, which provides commercial and consumer banking services to clients in select markets primarily in Tennessee, North Alabama, and North Georgia through its subsidiary. It operates through the Banking and Mortgage segments. The Banking segments deals with interest on loans and investments, loan-related fees, originations in banking footprint, investment services, and deposit-related fees. The Mortgage segment originates from fees and gains on sales in the secondary market of mortgage loans that originate outside banking footprint or through internet delivery channels and from servicing. The company was founded by James W. Ayers in 1906 and is headquartered in Nashville, TN.

Goldman Sachs Pennant Re-Test (earnings release details inc)Goldman Sachs - NYSE:GS
Chart looks promising
✅ Rising 200 week and 200 day
✅Break out of long term pennant
✅ Pull back would be healthy here
🚨 Main concern would be a double top rejection from red line on the chart
Earnings Perspective
Rev ~~ $11.32B, EST. $10.84B
EPS ~~$5.48 VS. $3.32 Y/Y
AUM ~~ $2.81T, EST. $2.77T
PUKA

PayPal Holdings, Inc.💰Daily log chart.
Uptrend with short-term acceleration, in the second channel.
The question, will prices exit the medium-term channel, from above?
Price above the 200-day moving average.
Make up your mind.

Ummmm.... Hey as you can see, I don't know diddly about charting but hopefully the fancy bullseye got your attention. This ETF appears to be in distress!! The only reason I'm reviewing is that a friend said it has been a MF recommendation. Sometimes they seem to have good timing but this one and my advice to my friend was, even if you believe in the fundamentals of the ETF, the economy is still in a world of pain and Cnd banks are still under mad pressure. The Div looks nice...maybe after it closes the gap I'll take a look again after that but right now the chart is ugly and I'd stay eagle eyes and not involved.

Bitcoin(BTC/USD) Daily Chart Analysis For Week of Nov 24, 2023Technical Analysis and Outlook:
Like last week, Bitcoin's price has remained within the 37800 Inner Coin Rally range and the robust 35600 Mean Support level. This indicates that the market has been relatively stable, with neither bulls nor bears having a strong grip on it.
On the upside, there is potential for intermediate upward momentum in Bitcoin's price, which could lead to a breakout above the current Inner Coin Rally of 37800. If this occurs, the next price target would be at the Outer Coin Rally #1 of 39200, followed by #2 of 41200 and #3 of 43700. This suggests that there is significant room for expansion in the near future, which could attract more investors/traders to the market.
On the downside, the Mean Support level of 35600 is expected to support Bitcoin's price strongly. If the price were to drop, it would likely find support at this level. Overall, the market is consolidating, with prices trading within a relatively narrow two-thousand-dollar range.

XLF breaking out?XLF has had a pretty good month so far. Probably the worst sector is showing some signs of life despite issues with the banking system. This week XLF has poked its head above the triangle and the close was pretty good. Volume increased from last week as the down trendline was breached. Now, it is not a confirmed breakout yet as horizontal resistance is right above it and things are getting a bit overheated in the shorter time frames. It will be interesting to see how the pullback plays out. Markets are due for a nice pullback soon. If $31.5 - $32.5 area holds on the pullback then it might go off to finish the primary wave 5 sometime during the first half of 2024. This may also pull regional bank stocks that will benefit Russell and IWM.

Software for finance $PAYPaymentus Holdings provides a cloud-based platform for electronic billings like utilities, taxes, insurance and others.
The bullish divergence with the ROC was signaling a change of character for the stock.
Now is forming a second base withing its confirmed uptrend; my favorite setup, and the risk/reward looks good.
I'll use this week's gap up has support zone to place my stop and my target profit is near the lext resistence level at $22.50, that's a 30% move.
The financial sector AMEX:XLF , is the 4th best sector this month and technology AMEX:XLK is the 1st.
Paymentus Holdings earns the No. 2 rank among its peers in the Finance-Card/Payment Processing industry group.
dLocal NASDAQ:DLO is the No. 1-ranked stock within the group.

SWING IDEA - ICICI BANKtechnicals suggest a gradual upside in ICICI BANK . There are multiple confirmations for the same. The reasons are stated below :
954 levels previously acted as a strong resistance and now the stock price broke 954 levels, which now acts as a support.
there has been a consolidation in the stock price for last 2months forming a falling wedge pattern(bullish sign)
support on the 50EMA (ON DAILY TF)
break of the trend line
Stock could easily move unto 1050 - 1111 levels in coming weeks.

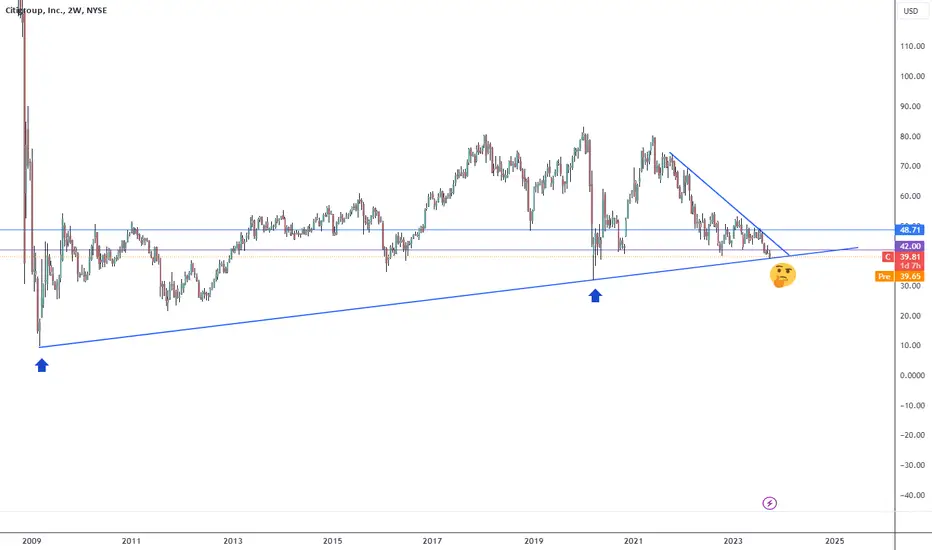
Level to watchBanks aren't sexy these days but check this level. Nothing to do at the moment, if you want to play safe wait until price breaks out the downline. If you are aggressive buy now and very tight SL (~37).
S&P500 Vulnerabilities: from Money Supply to Sectoral ImbalancesAs much as we try not to repeat ideas here, occasionally, an opportunity emerges to harp on the same point.
As we have previously laid out the bear case for the S&P 500 from a historical volatility behavior perspective, this week we will zoom in on other metrics showing why we think the S&P may struggle from here.
The first and most interesting measure, in our opinion, is the S&P 500 when adjusted by the money supply. Once again it appears to have peaked and is on the path of reversal now. The S&P500 / Money Supply has reached these levels not once, not twice but thrice, stopping at the same level before reversing. More importantly, overall, we see the S&P 500 clearly climbing up in line with the level of money supply.
Money supply has been on a decreasing trend since the start of the Federal Reserve hikes. While the downtrend has been paused momentarily with money supply slightly increasing in early 2023 it now seems to have resumed the downward path. This could spell bad news for equities given that the S&P has broadly followed money supply and the clear resistance observed on the S&P 500 / Money Supply chart.
As yields creep higher, investors will eventually second guess whether it still makes sense to put more into the equities when cash now yields more. The 6-month treasury yield is now higher than the S&P 500 earnings yield, a phenomenon not experienced since the turn of the millennium. A federal reserve resolute in keeping rates higher for longer might just be the kicker for investors to turn to these shorter dated treasuries while waiting out equity volatility.
With a series of better-than-expected economic data, the Federal Reserve once again gains greater headroom to maintain its higher for longer stance, which is causing discomfort in the equities market. All eyes will be on the Non-Farm Payrolls numbers coming out tomorrow for further confirmation if the US economy can indeed take this regime of higher rates.
Within the S&P 500, the Technology sector remains the significant outperformer compared to other sectors like Financial, Consumer Staples and Energy. With the Technology Sector / Financial Sector ratio extending far beyond the trend from 2017.
The combination of money supply metrics, yield comparisons, and sectoral imbalances, among other factors, makes a compelling case for a bearish outlook on the S&P 500. For investors seeking targeted strategies, CME E-MINI Select Sector Futures offers a refined approach, allowing for an overall bearish view on the S&P 500 while building positions in certain sectors through a relative value strategy. To express the bearish view on the technology sector relative to the financial sector, we can take a short position on the E-MINI Technology Select Sector Futures and a long position on the E-MINI Financial Select Sector Futures. Given the contract size differences, to roughly match the notional, we will need 3 E-MINI Financial Select Sector Futures at the current level of 405 to match 2 E-MINI Technology Select Sector Futures.
3 x E-MINI Financial Select Sector Futures Notional = 3 * 405 * 250 USD = $303,750
2 x E-MINI Technology Select Sector Futures Notional = 2 * 1678 * 100 USD = $335,600
Each 0.1 index point move in the E-MINI Technology Select Sector Futures is $10, while each 0.05 index point move in the E-MINI Financial Select Sector Futures is $12.5.
The charts above were generated using CME’s Real-Time data available on TradingView. Inspirante Trading Solutions is subscribed to both TradingView Premium and CME Real-time Market Data which allows us to identify trading set-ups in real-time and express our market opinions. If you have futures in your trading portfolio, you can check out on CME Group data plans available that suit your trading needs www.tradingview.com
Disclaimer:
The contents in this Idea are intended for information purpose only and do not constitute investment recommendation or advice. Nor are they used to promote any specific products or services. They serve as an integral part of a case study to demonstrate fundamental concepts in risk management under given market scenarios. A full version of the disclaimer is available in our profile description.
Reference:
www.cmegroup.com
www.cmegroup.com

BTC/USD weekly timeframe analysisBTC Chart in the weekly timeframe, after setting an all time high ($19660) BTC has formed a Flag between $2,972 & $13,880. and had formed a very wide and long trading range !
As the formation of this flag, price has made a 2TB (2nd time back) to the lower FL and according to the huge buy orders which we can see in the candle formation, a new uptrend had started.
This uptrend was so strong that had engulfed the upper FL & ($19,666) SR line - & could cause a 1692% growth in the value of this asset and hit a new ATH of $64,895 !
After engulfing the FL, a new FTR was formed ($16,218-$19490) which in general we can call this a Decision Point for the green FL zone. We must consider this zone very important as it has been formed by breaking the SR lines and engulfing the previous FLs.
Next, price formed a new Flag between $28.800 - $64,895. We must take into consideration that in the first Pullback to the lower FL price engulfed this zone which was a sign of an end for the latest uptrend for the price of BTC ! And then we can see the price faking out of the Red FL zone in order to collect liquidities.
As you can see in the chart, after price descending under the FL and engulfing the SR lines, it has formed a new zone called FTR that is actually the DP for the engulfed FL zone.
In the big picture we could see a Wyckoff being formed which is a sign of change in the trend of price to a downtrend.
Then , price fell to the MPL zone of the previous FTR/DP and was supported to rise higher, but as there were huge sell orders after a tight compression, price made a pullback to the FTR in the lower TF and continued to fall to the point that it engulfed the MPL zone by crossing down $16,000.
