GS @ 15 min @ just a little bit - daily (3 GAP`s left behind)Basic horicontal lines (support/resistance) are:
242.42 high of last week
235.54 low of this week
225.73 opening price & low of last week
GS opend this week around last weeks highs and created weekly lows around basic upside, before breaked out slightly today. Noticable, at in my opinion, are the facts, that GS created 3 GAP`s. 3 Upside GAP´s are suggesting me, that many traders are scared not be long also. Usually GAP`s got the property to be closed - in a superior upside trend. And that`s the reason why i adon`t wanna ignore all 3. I am relative surely that the market will let all 3 left behind, while next week at least. But market pressure like yesterday is always possible - even if the fundamentals are suggesting still higher prices. How ever, use the GAP`s still as an entry, guys :) i bought today some CFD`s at 241.50 :agree:
241.62 & 240.27 3rd GAP (before todays outbreak)
238.20 & 237.50 2nd GAP (after fals breakout while monday)
236.72 & 235.54 1st GAP (thursday opening, last week
price targets (based on development last days) could be
243,22 last alltime high & 3rd GAP
246,64 last alltime high & 2nd GAP
248,12 last alltime high & 1st GAP
superordinate prices targets (on higher time frames) are still
249,30 last week alltime high & low of this week
250,70 all time high from october`07
259,11 last weeks high & low difference
JPM for example breakedout for a long minutes, hours, days.
From tis point of view, don`t get panic if the price raises too much at once.
Of course, it`s all relative - not only compared to other bank or financial shares!
But in historical context - even before so called financial crises `07 - the numbers we`re not better as the political (trump, reds, fiscal policy) or even financial market environment (low rates - cycles is slightly starting) :)
Take care
& analyzed it again
- it`s always your decission ...
(for a bigger picture zoom the chart)
This is only a analysis (for swing traders) - no recommendation !!!
Buying/Selling or even only watching is always your own responsibility ...
Best regards
Aaron
Financials


KRE, Banking Momentum Diverges From "reality" Slowly scaling into financials. I admit I may be booking myself into the spa for a "face-lift" but the risk reward seems skewed in my favor to take a stab here.

EUFN: European financials are in danger hereI think we can get a retracement in the financial sector, and Europe is in worse shape than the US in general. It wouldn't surprise me to have some negative news pop out, surrounding Italy's referendum, Deutsche Bank, Italian Banks, UK banks, Brexit, etc. Quite a few potential catalysts for volatility, so, if we see this ETF break the linear regression channel support, we will probably see a rapid selloff.
Keep your eyes open, it might be safer to stand aside, and book succesful long trades, or maybe even take a couple strategic shorts.
Good luck,
Ivan Labrie.

WFC: Buy gradually over a weekWFC gave a nice signal to go long here, when retesting the prolongation of the earnings support to the left (dashed line). I'm adding gradually over a week in this zone. I currently hold a 1.5% account position, since I think we might take a while to take off, but we will most likely see a continuation of the Trump induced rally, and as Tim West pointed out in the Key Hidden Levels chatroom, it has a lot of room to catch up to $BAC, so, don't miss it.
Good luck,
Ivan Labrie.

S&P 500 Index @ 1h Chart @ incl. XLF & XLE since Trump ElectionPerformance of the SPX, XLF & XLE - end of last month (November`16)
closed by 2034.5 SPX (round about +8,08% this Year & -1,505% year to year Nov`15 until Nov`16)
closed by 18.95 XLF (round about +18,79% this Year & 13,63% year to year Nov`15 until Nov`16)
closed by 60.16 XLE (round about +23,72% this Year & -6,752% year to year Nov`15 until Nov`16)
Both sectors had the worst performance the last years, while Obamas presidents time.
Aftermath is all clear, i also didn`t except an outbreak like this. But since this month - i am prefering to see the lows in some shares (even of both sectors) as an buying oppurtunity. Why ??? Let it me so explain ... Under president Trump i can`t imagine that our new president will make policy against both sectors - even forcing laws to shoot their expansion ambitions down. "The Occupy WallStreet Movement was aftermath the all-time high of all anti WallStreet Americans - in the review even maybe the bing gang of make american great again - from the top to the button ... even from wallstreet to every american consumer and tax payer"
How ever,
i am not an political analysis or even expert - but the chart is speaking fo itself.
From this point of views i am prefering the US Yields (Gold as hedge is useless), US Equities & even some sectors (even like Energy & Financials).
Take care
& analyzed it again
- it`s always your decission ...
(for a bigger picture zoom the chart)
Best regards
Aaron

Short GS again! KEEP buying powder dry to add (scenario below)HUGE OPPORTUNITY FOR AGGRESSIVE, WELL-FUNDED TRADERS. Start Shorting today Tues 12/6 and keep shorting if you buy off on scenario below. I feel this is now a rare opportunity - but hold onto your Tums bottle all the same. GS is 231 with 20 mins. to go today, and it's been holding - but in a narrower range than usual. The RSIs (especially the default 14 pt IA AND HAS BEEN OBSCENELY OVERBOUGHT and it has ben my experience that the longer this RSI remains over 80, the harder and choppier the fall. Macd has signaled - as have the oscillators .
I love trading GS and made one short reco last week which worked out well in the first hour of trading. We are setting up for another pullback for the following reason: the stock has gone parabolic (you do not need me to tell you that!) and parabolas have two sides! Why so much gas in Goldman? Aside from Goldman Grads being in just about every federal and world banking arm, they surround the presidents - and Goldman kicks ass in their bond trading department -- WHEN there is bond volatility. Indeed, this year is setting up for that positive aspect for GS, along with huge deals and the obvious deregulation spark that lit up the financials. Goldman stands to have a great year - but we are a tad ahead of ourselves here - for a logical reason, but it is far from a fundamentally or technically sound reason...
But this insane run since the election may have started on fundamentals - but has shifted to Window dressing by the big retail Mutual Funds(at this moment - AND I FINALLY sense the gas drying up). Am I brilliant? Clearly not - but I have noticed a shift in IBD's "New Buys (by the top 1/3rd best Mutual funds )- and out of 99 funds active in GS, over weeks it has gone from mostly buying to now - out of 99 funds - 55 buyers and 45 net sellers. The smart nimble guys got in and took as much as a 50% upside bite ( or chomp) and now are taking profits and getting the hell out.
The stock has garnered so much attention, the remaining "big boys" who cater to the masses are just dressing up positions for the one time of year when their investors may actually look at the positions carefully - and managers don't want to be asked why or how they dont own GS -- God forbid. BUT BUT BUT..
Today, with the market firing to the upside several times - Goldman has stopped participating - where practically every other day , a few points in the S&P translated to points in GS as funds wanted in before losing more upside potential. Today, however, was important in that a few analysts changed their targets (I think one guy revised his from 189 to 245). HSBC came out and initiated with a 250 target. THIS SAYS THAT EVEN THE LATECOMERS TRYING TO SHOW A GOOD RESEARCH CALL ARE NOT SEEING MUCH MORE UPSIDE HERE.
Start building put positions by whatever style you use - but I would suggest leveraging the hell out of 25% of your trading money on this by rolling into the front week in the < $1.00 range. Use the rest for put or call spreads or whatever your style is -- but the spreads have been especially lucrative when you anticipate the premium deflation that results when the next week becomes the front week (a long way of saying do this on Friday close or Monday 1st 30 mins and you will make money 4 out of 5 times in this environment. I would keep a couple of near positions - and i have built positions out as far as 4 weeks.
It is remotely possible - and I say remotely - that Goldman holds up until the first of January. Hell - they could be doing a deal and decide to prop themselves up as much as possible because stock is currency somewhere in some enormous transaction - with Goldman, strange things definitely happen behind the curtain. But everything i see points to some real heart-thumping pullbacks once the pullbacks start - we could see some amazing jolts of easily 10 to 20 points, on multiple occasions, so trade them all individually if possible) on the downside, so try to hang in. Good luck

JP Morgan remains strong - outperforming SP500The underlying bullish trend remains intact, as prices post new highs. Momentum studies are already overstretched, however, but downside risks are likely to remain limited as monthly studies remain strong and investors maintain a buy-into-dips strategy.
JP Morgan is also outperforming the SP500, and as a proxy for the broader based US Financials Sector, asset managers are likely to maintain an overweight stance in this sector.

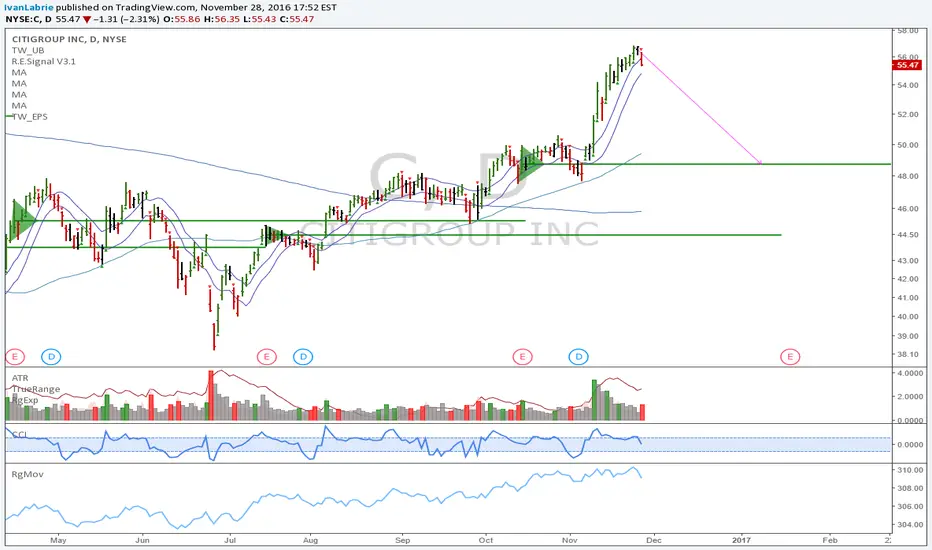
C: Systemic risk, extremely overboughtCitigroup shares might be poised for a retracement here, we can expect a selloff to take place, if we don't move back above 56.78. I'd reccomend either shorting it, or buying puts. You can buy out of the money puts and sell bear put spreads to reduce costs (vs buying at the money puts).
Good luck,
Ivan Labrie.
SAN LONG DUE TO INDICATORS, CHANNEL AND INCREASING RATESSantander´s stock reached a support level early this year, and it was confirmed mid-year, as of now, there's an obvious channel in which the stock is moving, and due to macd, rsi and stochastic, $4.50 would be a good entry point these days.
I don't recommend $SAN for a long term investment though, as I'm using daily candles, I recommend it for a short term one, buying when it reaches the support of the channel and selling as it reaches the resistence.

Investment Managers Should Catch Up.Blackstone Group is back towards the bottom of the gentle up-channel started in 2009 (see weekly chart below).
Rebounded off a double-bottom on the daily chart in good volume, but not as much as the rest of the financials.
Similar story to another, smaller asset manager highlighted recently (please check LM idea).
1. Buy here with target 28.50 and stop 23.50 for a RR of 1.83x
2. Buy here with target 32.00 and stop 22.30 for a RR of 2.28x
3. Buy Jan 16'17 28.00 call at 0.32 and sell same maturity 23.00 put at 0.45

BUY BAC AT $15!I'm targeting the $15 dollar level for a low risk entry point.
Healthy pullback to retest breakout!

Prediction of the S&P500 and NIkkei based on financials and CPIIn the following content i will explain how you can forecast the market with CPI (inflation) and Financials:
If we look at our figure we can say a few things, i will assume them below:
1. ABN AMRO (a dutch Financial) is highly correlated to the NIKKEI225 index.
2. Since nearly May 2016 we can see that the CPI (inflation)-chart has change 5 times. If we look at the Nikkei225 index we can see a few things: when the inflation in the US rose, the Nikkei225 fell 4 out 5 ( a chance of 90% or mathematical: a chance of 0.900). Using maths we know that ABN AMRO has an statistic correlation of 0.70 < r < 0.90 (70% - 90%) to the Nikkei225.
Conclusion: The fInancials are following the NIkkei225, and in turn the Nikkei is following the US CPI (inflation) in a divergence/opposite movement.
3. We can use the inflaton from the US as a staircase for the movement in the S&P500 (on this moment a consolidating market)
Sources: Bloomberg Markets, ING Technical Analyses
NOTE: I don't make any predictions, making decisions based on my reports is at you'r own risk!


CIELO: Compra/LongCompra de Cielo(CIEL3) baseada no respeito à zona de suporte. Devemos ver o preço subir nos próximos dias e semanas.
Going long on Cielo(CIEL3) due to bounce off support zone. We should see higher prices in the coming days and weeks.

BAC Breakout playA lot of option activity in Bac the last couple of weeks. Looks like a very good opportunity for a break here based on the interest Hike "hope".

CHF CADPodemos entrar largo si rebota en la linea de tendencia luego romper la resistencia. Y entrar en corto si rompe los dos soportes.


is now a good time to long Schwabb (schw)Trends seem to all lead to going long schwabb until at least 30. let me know your thoughts!

Financials will benefit if the reflation theme continuesRelated to the reflation theme described in my view "Crude Oil: The Most Important Chart in the World".
This trade relates to a steepening of the US yield curve as rates adjust upwards through either rising inflation or a pickup in US growth (or both) having been driven to a record low in June.
BKX Index (candles)
BKX / SPX (blue)
US10Y (grey)
What is interesting to note from a technical perspective is that the BKX index traded within 1% of the 2007 - 2009 61.8% retracement level last July, before bottoming at the 38.2% retracement level in February this year. Since then, yields have continued to fall (grey), but the relative performance of banks versus the S&P 500 (blue) has held firmer and failed to make new lows.
Assuming the reflation theme transpires, banks represent a compelling value play and remain an uncrowded US equity play. Now trading below the $70 level, technically the banks are in the lower half of the last 12 month's trading range and provide a decent payoff in the run up to $80 (61.8% level) with a stop-on-close (weekly) below $57 (38.2%).
For further insight and discussion please contact me via Tradingview or LinkedIn , on Twitter @James_LVDTA, and visit www.lexvandam.com to become a member of our Trading Club.

XLF and Q2 EarningsQ2 Earnings season is starting in Monday, July 11th with major financial institutions reporting.
Financials are projected to do slightly better then the previous quarter and may offer good upside potential.
From a fundamental standpoint, most financials are undervalued when taking into account future interest rates.
If "Market Stabilization" occurs in Q2 or Q3, further revenue and earnings growth is expected from Trading Revenue.
Technical Analysis showing resistance points after a break through the strong trend ling.

AUDNZD WAITING ON BREAKOUT 4HOURBreakout out of critical level followed up by a retest of that level and 61.8% fib level.
Stuck in a ranging market since the beginning of the month,
just awaiting a breakout to the downside confirmed by the careful use of MA's.
Looking for a downtrend towards target 1 at 1.03602 (monthly critical).
Price action at this level will confirm my further position or to capitalise on profits made.
Upon completion of this level the next to the downside would be target 2 at 1.02406.

Relief Rally In Global EquitiesGlobal Equities are experiencing a relief rally after a bizarre turn on events. For some reason, the brazen murder of British M.P Jo Cox turned the increasingly large "leave" vote around, and the "remain" vote regained the led heading into Thursday's Brexit vote.
The Euro Stoxx 50 Index jumped off of technical support of 2,814 but still remains in a clear downtrend of 2015's bubble-high of 3,837. Since last year's top, the index has made several lower-lows, and the current trend from the bear market bottom has etched out two clear lower-highs.
Given the state of the brief risk aversion seen last week as the "leave" vote took a pronounced lead, global were "due" for a rebound. As alerted earlier last week, the near-term momentum was set for a shift:
twitter.com
If you look across European equities, the prospects are not turning out like many thought. In regards to the Euro Stoxx 50, price action does not get interesting until a close above the near-term, broken uptrend AND prevailing downtrend is confirmed. The 200-day EMA will be a key pivot point. The index has not been able to trade above this dynamic resistance since last December.
Wait for price to trade into resistance near 3,000/025. MacroView does not expect Britain to leave the European Union, but there are far too many risks to get excited about.
Check out Bloomberg's Brexit tracker, currently showing a small Brexit lead.
For more information on MacroView's products, or general questions and comments, feel free to message us.
Also, readers are encouraged to post their thoughts and charts!
Follow MacroView CoFounders on TWTR1.45% @Lemieux_26 and @EconomicHedge
