Long-term view: looking for an entry on TD AmeritradeAmeritrade (like the financial sector as a whole) is way down, primarily due to the Fed's July interest rate cut. In my opinion, this has been a big overreaction. Ameritrade posted an earnings beat and upward guidance revision just before the Fed announcement, but the rate cut eclipsed Ameritrade's good news.
Ameritrade has significant support levels around 43 and 38. I will looking for entries at these levels, especially at 38. (I find it's usually best to be greedy and pick lower entry points, because stocks often fall 1-3 support levels further than I expect them to.) Look for MACD of -1.5 as a signal to enter.
Financialstocks

Ameritrade CEO change casts a pall over strong earnings resultsAmeritrade this afternoon announced both earnings and revenue that beat Wall Street expectations by a significant margin. However, they also announced that their CEO intends to step down by February 2020. The stock is down slightly in after-hours trading, perhaps partly because of the CEO announcement and partly because the hourly chart is overbought.
However, looking at the chart, I find it hard to believe that Ameritrade won't end the day up tomorrow. The stock broke a trendline today and ended the day right on top of high-volume support. I think it would be hard for this stock to trend down.
Surprisingly, analyst ratings on the stock aren't great, although S&P Capital IQ rates it extremely undervalued and extremely high-quality in terms of fundamentals. With a P/E of 14.5 and 27% GAAP earnings growth year over year, this looks like a buy to me. I can only guess that analysts have concerns about the financial sector overall.

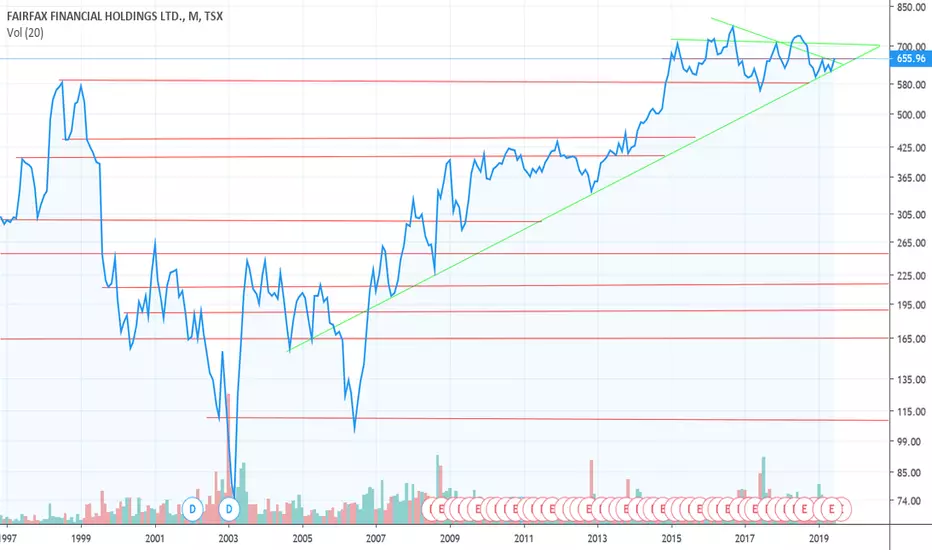
Is Fairfax Financial about to break a Ascending Triangle?It appears as though Fairfax is trading in one Giant Ascending Triangle that is "potentially" about to Moon.
Time will tell per usual.
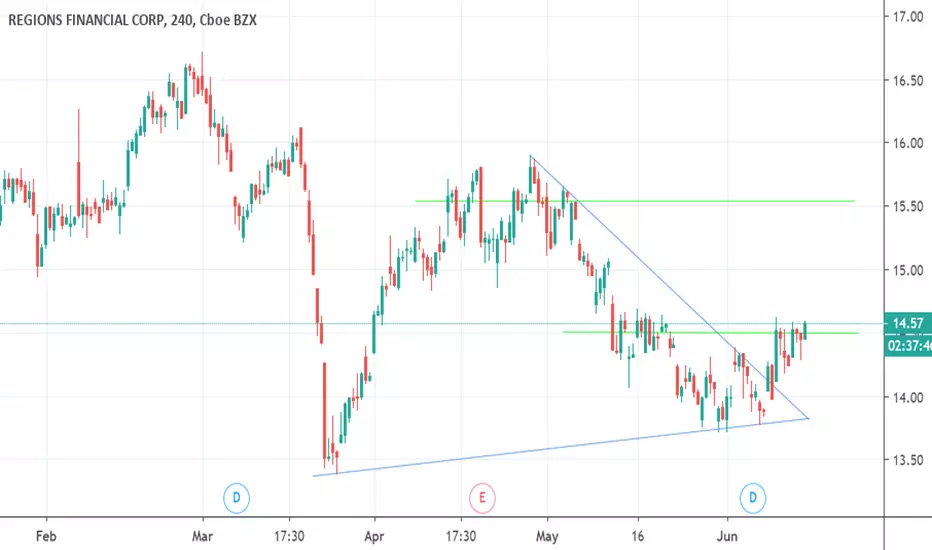
$1.00 per share upside in Regions Financial?Regions Financial (RF) recently broke out of the top side of a triangle and appears to be working its way through all the sellers in the $14.50-$14.60 resistance range today. From there, the coast is fairly clear up to about $15.50. Analyst ratings are mostly bullish on the stock.
$30 in SightI'm looking for at least $30 in my case I need at least $30.10 for a call I made. My call closes Sept and it didn't take long to near my goal. The fear of yield curve inversion is legitimate but nothing is as quick and basing previous experiences on one indicator (which could be skewed based on current events: China, Brexit, the Fed etc..)
Most of the times from what I've gathered inversion brings about ATH's at least within the year. HOLD and try and play the game if you're down. I might consider a short position soon.

A Look At The Bigger Picture For InvestecInvestec plc is an international, specialist bank and asset manager that provides a diverse range of financial products and services to a niche client base in three principal markets, the United Kingdom, South Africa, and Australia as well as certain other countries. Investec plc is the controlling company of the majority of the group's non-Southern African operations.
Technicals
I have indicated the monthly structure in black and the weekly structure in pink. I expect the weekly structure to complete after either 3 or 5 waves to the downside and will be looking to trade the long from the end of both waves. Wave 5 of the weekly structure has a really good target and I will not miss the entry after a reversal confirmation.

Discovery Correction With Big TargetsDiscovery Ltd. is listed on the Johannesburg Stock Exchange and is an integrated financial services organisation, specialising in health insurance, life assurance, wellness, investments, savings products, short-term insurance and credit card products.
Technicals
The corrective structure indicated above has targets of between 19000 and 21000 which is a long way up. We are in wave 3 of a possible 5 of the correction. I will be looking for wave 3 to break the low of wave 1 before looking for reversal signs to enter the long.
Happy trading!
Linton

Cash money, but just how much?For those following the Financial Sector two big dates are coming up fast for Citigroup ($C): The 26th of September next week, when the Fed decides rate raising (decreasing/no hike) and mid October when $C and other banks report earnings.
The Sept 21 - $72 strike was just too tempting at $0.20/contract. Now that Citigroup, $XLF and the market in general is heading north, should gains be cut and collected today, tomorrow or are we gliding to the weekend on the wings of euphoria? $C beaten down MACD converged bullish, and the buy rumor sell news still has about 5 more days before expiration (unlike the Sept 21 contracts). The resistance at the $71.5 strike seems to be the only remaining obstacle before a short-term run on $73.
As always, do your own due diligence.
-Bayarizard

Bank of America Short signalTriangle has been completed for BAC since the beginning of the year. Price broke MA 200 which has represented a prominent support so far. MA 50 and MA 200 are close to each other. MA 20 broken with volatility stop on negative configuration. Due to the restricted volatility accrued since the beginning of the year strong price movement will be expected!

XLF Has Its Pre Financial Crisis High In SightsThe popular ETF, XLF follows the financial sector and after weeks of selling, it looks to have found support and be gearing up for a big move indicated by the Weekly Squeeze coiling for the past 8 weeks, with the momentum shifting to bullish this week. If you take a look at C (Citigroup), it too has a Weekly Squeeze. If you take a look at it on a Daily it also has a Squeeze which looks like it will fire long. If this move for the financial sector plays out long, I would expect a retest of its high back from January (30.33) then a retest of it's high of 30.84. This high (30.84 - May 28, 2007 - 11+ year ago) is an important one because this was the peak of the financial sector ETF ( XLF ) before the financial crisis of 2008.

Room to run for VisaVisa experienced a breakout on the weekly chart, breaking a trend back to January 2014 (nearly 4 years). If shares can maintain the resistance-turned-support trend line, shares are heading higher.


Amazon short term buyWe are long on the Amazon.
Targeting the near term resistance on the AMZN, at the 963 area.
AMZN in the near term is technically positive. We recommend an opportunistic buy with an entry below 944.76 with a primary target at 963.23.

FNCL chart review Currently hovering around its support and a possible inclining pennant forming; I bought in on this above 36$; so I am hoping for the break up.

US Financials Sector Under PressureWe have updated our monthly publication - US Sectors Relative to S&P500.
It is an overview of the major US sectors, and covers, amongst others, Consumer Discretionary, Consumer Staples, Energy, Healthcare, Technology and Financials.
Within several ratings changes, we have Downgraded Financials to Underweight.
On an absolute basis, the US Financials ETF XLF is showing signs of exhaustion. Prices are correcting back from the March highs at 25.30, with focus now on the 22.55/57 break level from November/December. Falling momentum studies suggest risk of a break beneath here, with subsequent focus then turning to the 20.00 break level.
Relative to the US S&P500 Index, price action is also looking vulnerable.
In the coming months, we see further Underperformance as institutional investors reduce exposure.
Individual names which are currently under pressure include Bank of America Corp (BAC), Citigroup Inc (C), Goldman Sachs Group (GS), JP Morgan & Chase Co (JPM), Morgan Stanley (MS) and Wells Fargo (WFC).
However, several names are managing to hold on to their relative strength. Investors who are maintaining a Financials portfolio are currently seeing safety in for example, American Express Co (AXP), BlackRock (BLK), Berkshire Hathaway (BRK), Moody's Corp (MCO) and Prudential Financial (PRU).

JPM H&S PatternJPM seems to be breaking our of a head and shoulders pattern, also backed by the Coppock curve breaking out of defending triangle and will probably rebound to carry on going even more negative. Also, I would short now, but if it breaks the 100 MA then its a definite short until the support of the last flag pattern. Furthermore the stock seems to be entering a new trend zone represented by the purple colour.

Potential Sell Zone towards FOMC24-25$ is a potential Sell Zone that includes:
1) Weekly Structure
2) Bearish Crab
3) The 78.6 Fib level (reversal level)
A close below 23$ can provide the confirmation signal - In such case, XLF target will be 21$

AUDCAD end of day structure (Still got bullhorns)bit.ly
#AUDCAD price structure appears to have corrected today forcefully to reinforce our earlier bullish bias. Revised price structure interpretation shown here. See chart!

short XLF @ 15 min @ trading capability for this 52nd week `16This is only a trading capability - no recommendation !!!
Next wkk i`ll confirm or change my opinion about this SetUp :)
Buying/Selling or even only watching is always your own responsibility ...
Best regards
Aaron
