FIO Breakout: Is This the Calm Before a Massive Move or a Trap?Yello Paradisers! did you catch the breakout on #FIOUSDT or are you still sitting on the sidelines while opportunity unfolds? The recent move is shaping up to be a high-probability setup, but only for those who understand the market structure and know how to manage risk properly.
💎#FIO has been consolidating inside a well-defined falling wedge on the 12-hour timeframe—a pattern known for its bullish reversal potential. After weeks of compression, we finally saw a clean breakout to the upside, followed by a textbook retest of the wedge’s upper boundary. This breakout-retest sequence confirms that the previous resistance has now flipped into a support zone, a key technical signal we always monitor closely.
💎Adding further conviction to the setup, FIO is currently supported by multi-timeframe EMAs, acting as dynamic support. When combined with horizontal levels, these EMAs offer traders additional confluence and often indicate that the market is preparing for a stronger impulsive move. What’s particularly notable here is the alignment with key Fibonacci retracement levels. The price is holding just above the 0.618 retracement level—a golden pocket that often acts as a springboard in continuation setups. This creates a high-confluence support zone between 0.0139 and 0.0143, where bulls have a clear technical advantage.
💎To the upside, should keep a close eye on two major resistance zones. The first lies at 0.01689, which marks moderate resistance and the likely first target should bullish momentum continue. The next level of interest is 0.01950—identified as a major resistance zone. A break above that could open up significant upside potential, but we’ll stay measured and reactive based on how price interacts at each level.
💎On the other hand, the invalidation level is clearly defined. A candle closing below 0.01213 would invalidate the current bullish structure. If this level is breached, it’s a strong signal that the setup has failed and the risk needs to be cut immediately. No second chances there—discipline is key.
💎All in all, FIO has triggered a technically clean breakout from a falling wedge, retested the breakout zone, and is now forming a strong base above multiple supports. However, confirmation is always key. As long as it holds above the 0.0139–0.0143 support cluster, the bias remains bullish and the probability favors continuation to the upside.
We are playing it safe right now, Paradisers. If you want to be consistently profitable, you need to be extremely patient and always wait only for the best, highest probability trading opportunities.
MyCryptoParadise
iFeel the success🌴
Fio

FIOUSDT Forming Falling WedgeFIOUSDT is starting to gain traction among crypto traders as it sets up a classic falling wedge pattern, which is widely known as a reliable bullish reversal indicator. After an extended downtrend, this pattern often signals that sellers are losing control and a potential upside breakout could be imminent. The fact that FIOUSDT is showing good volume adds further confirmation that market participants are accumulating at these levels, which could propel the price higher.
Currently, traders are eyeing an expected gain of around 50% to 60%+ from this breakout setup, which makes FIOUSDT an interesting pick for short- to medium-term swing trades. With the broader market sentiment gradually improving, coins with strong technical patterns like this often outperform as buyers look for fresh opportunities. Watching for a clear breakout above the wedge’s resistance line could provide a solid entry point for those looking to ride the next leg up.
Investors are also taking notice of the fundamentals behind the FIO project, which adds confidence to this bullish technical outlook. As more traders spot this wedge formation and volume trend, the likelihood of follow-through buying increases, potentially leading to a sustained move toward the target range. Be sure to keep an eye on support levels and trailing stops to manage risk as the setup develops.
✅ Show your support by hitting the like button and
✅ Leaving a comment below! (What is You opinion about this Coin)
Your feedback and engagement keep me inspired to share more insightful market analysis with you!

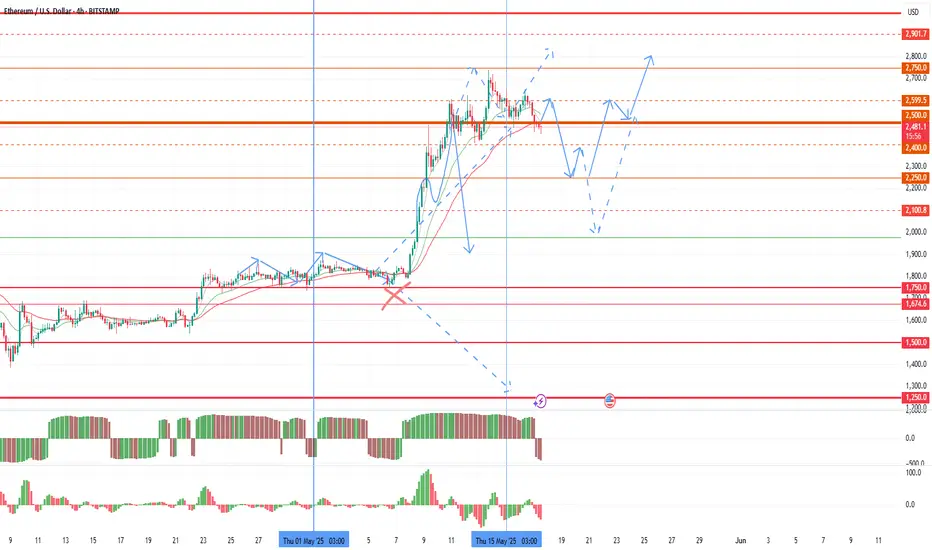
Monthly Candle volatility growthThe market remains extremely sluggish in the seasonal flat, but there is a possibility of increased volatility this week and next. In this regard, I would like to consider the market situation and the likely prospects. First of all, in the medium term, the probability of a flat of about 100k for bitcoin and 2500 for ether prevails until the opening of the new half-year. There are no sufficient arguments for a significant break and trend towards 210k for bitcoin and 5k for ether. In addition, strong statistics for the United States began to be released, which increases the likelihood of a retest of 1900-2100 on ether and 85-90k on bitcoin. That is, until August, I am still more likely to expect a flat of 95-110k and 2250-2750 under an optimistic scenario. With a more negative picture, there remains the possibility of a major drawdown of the market until the retest of the loyalties of the first quarter on the tops.
A significant spike and bullish trend may be facilitated by the cancellation of Trump's duties voluntarily or in court, a truce in Ukraine, or the consolidation of brent above $ 69-70 while maintaining growth. In the event of a resumption of duties or a collapse of oil below $ 60, the probability of a fall in the crypt will become extremely high.
Against the background of the closing of the last bullish monthly candle and above 2500 on ether, we have technical signals for continued purchases. This week, there is a possibility of a major wave of purchases in the first half of the month with an attempt to move. However, strong US statistics are likely to continue to dampen growth attempts. Starting next week, it is worthwhile to carefully consider the volume of positions in the work due to the high probability of a market drawdown in the second half of the month. At the end of the week, I will assess the probability of maintaining purchases in the second half of the month, depending on the statistics released this week and the dynamics of oil.
To date, I am still considering the most oversold coins for scalping that have not been assigned the chess fio adx monitoring tag with possible growth waves of up to 70-100% from current levels. Fan tokens with a growth potential of up to 100-200% remain in a highly undervalued position, among which I work with atm acm city porto Lazio alpine juv. For storing funds in the medium term, quick looks interesting with the main long-term support at 0.020-21. The cos slf data pivx token can also show growth waves of up to 30-40%.
As I wrote earlier, large-cap coins, against the background of a seasonal flat and likely sales, may continue to fall slowly until August, in the absence of major growth in the tops or the index of dominance of altcoins.

Continuation of the flat under the pressure of seasonal salesAnd so a difficult week is behind us, with overcoming the middle of the quarter. Against the background of positive factors, the week and the second half of the quarter opened above 2500, which provides market support and reduces the potential for decline. However, we have only come to a temporary consolidation of the market and it is too early to talk about a trend change to bullish. The final consolidation of the direction will take place in June. So far, the market has switched to seasonal sales from the 11th, as I warned about, and the bulls' task is to compensate for them. Technically, there is still a lot of potential for retest 2100-2150, which may happen in the coming week.
In an optimistic scenario, the new week will open above 2500. In this case, on Monday and Tuesday we will see insignificant sales again and the ether will not go below 2250 with a return to the hay in the second half of the week. In a more negative scenario, the week will open below 2500, in which case sales up to 2100-2150 are likely in the first half of the week, but with further purchases to 2500 due to the opening of the second half of the quarter above the level.
Today and tomorrow, there is a possibility of a wave of purchases, but I do not recommend keeping large-cap coins in operation, since seasonal sales in a negative scenario may last from mid-May to August, which will lead to their steady decline. Small-cap coins may show more significant growth impulses during this period.
We are also approaching the next assignment of the monitoring tag and delisting, which will have an additional impact on altcoins. So far, fantokens are in a good position, which successfully compensate for the drawdown of the altcoin index and are trying to grow, as they remain undervalued. I think they will remain interesting for speculators in the near future due to the drawdown of the rest of the altcoin market. ATM and city look the most interesting so far, which can continue to grow from their current positions, due to the lack of futures with active sales and the most oversold position. Under an optimistic scenario today and tomorrow, growth waves similar to acm are likely for them. Acm also has a high growth potential, but it may take time to accumulate with a retest probability of 0.75-90 before a new wave of purchases. Second of all, I am considering the alpine juv porto lazio. There is a possibility that binance will continue to add futures to fantokens every week, which will give new growth impulses.
In addition to fantokens, fio chess pivx adx quick, which remain in an undervalued position, can show a new wave of growth. I will be looking at them closer to the middle of the week.
A new probability for a bullrun over the weekendSince in the second half of the week there was an opportunity for the ether to take higher levels, I want to consider the events for the coming days in more detail. At the moment, the growth target is the test test of 2100-2150, then either the range will be broken, in which case a stable trend towards the test of 2250 can be expected on Saturday. If it fails to gain a foothold above 2100, then tomorrow a pullback to the opening of today's daily candle and a second test attempt of 2100-2150 on the weekend are likely.
With all the positivity, I would like to remind you that I mentioned purchases only in the first half of the month, in continuation of the April trend. From Sunday to Monday, there is a possibility of a major market drop if ether does not open the second half above 2250 and bitcoin above 100k. It is difficult to say what could serve as a signal, but positive statistics for the United States have already been released, as the first signal, there may be a collapse in oil at the beginning of the week to stimulate sales. It will be possible to judge further dynamics at the end of the week, but starting from Sunday afternoon, I recommend reducing work positions.
To date, following the tops, large-cap coins show a slight increase, and secondly, we can expect the start of a rampage through the rest of the coin market closer to Saturday. For large-cap coins, you should not expect large growth, since the growth period is still quite small, the probability of gaining large investments during such a period is small. In this regard, the growth waves can be up to 15-20%. Small-cap coins are likely to have a stormy weekend with breakouts of up to 70-100%.
I am primarily considering chess and fio for work, and koma adx pivx quick with slightly less potential for the latter. A bullrun is also likely for fantokens with speeds up to 3x, among which I primarily consider atm city acm.

FIO is ready for the trendLarge-cap coins showed growth yesterday following the tops, and memcoin bullying is subsiding today, followed by a high probability of bullying in the remaining altcoin market. I expect the main day of growth tomorrow until Sunday afternoon, then the probability of a major pullback prevails until the middle of the new week.
Today, fio, which I considered for work in the first place, continues to accelerate growth. The main goal is to retest the key level of 0.025, which will open the way up to 0.50-75. We can see a repeated breakdown and consolidation above today. If the second half of the month opens above the level by June, the fio may move into the range of 0.045-60. With sufficient volatility, a test of this range is likely tomorrow.
After working fio and chess up to 60-90% from current levels as the most undervalued assets in finance today, quick adx pivx can be additionally considered for scalping. There is also a high probability of a new blizzard on atm city acm fantokens with new hays.

Bull run over the weekend amid strong signals for market growthTo date, the crypt has been given a number of positive factors and the basis for a very stormy weekend.
Binance monitoring did not give a new assignment of the tag, which was immediately responded to by pivx, which I recommended for work. I think the holidays in China had an impact. In the new rules for assigning the binance tag, it obviously means the first working week of the month. Apparently, the assignment of the tag can be expected from Tuesday with the start of the working week in China.
This week, almost all important statistics on the United States came out negative, in addition to last week. For oil, the same picture is for purchases.
The combination of these factors sets the stage for an attempt at an annual turnaround of the crypt with disruptions to the tops. It's too early to talk about the consolidation of such a scenario before the second half of the month, but the signal itself for a possible trend for bitcoin at 210k and ether at 5000k+ sets the stage for a bull run on altcoins.
Due to this picture, a very stormy weekend is likely ahead, followed by a correction in tag assignment and a new wave of growth in the second half of the coming week.
This weekend, first of all, we can expect bull runs on fantokens, which remained the most oversold instruments after another delisting, which makes them extremely attractive to speculators. First of all, I am considering atm city acm asr. Their breakout potential is up to 3-5X, depending on volatility.
Among altcoins, bifi fio chess retains a good potential for breakouts of similar pivx. A repeated pulse on pivx can be considered already in the case of the start of a bull run. According to these coins, growth impulses of up to 50-70% are likely. Koma is also in an interesting position on binance alpha, which can show growth up to 0.050-75.

FIOUSDT - GLIMPSE of MAJOR PUMP AHEAD!The Wyckoff Cycle explains market price movements in four phases driven by supply and demand. In the Accumulation Phase, smart money quietly buys assets at low prices, leading to a sideways market with limited volatility. This sets the stage for the Markup Phase, where demand outweighs supply, causing prices to rise in a clear uptrend. As prices peak, the Distribution Phase begins, where smart money sells off their holdings, resulting in another sideways market but at higher levels. Finally, the Markdown Phase occurs as selling pressure dominates, causing prices to decline in a clear downtrend, eventually leading back to a new Accumulation Phase. This cycle reflects how market participants’ psychology drives price trends.
Now as per weekly chart, as shown below, it clearly shows well accumulation before supply, many a times ive seen weekly bounce of dead sideways coin get a move and thats usually a dead cat bounce. As mentioned and seen here, I dont think its a dead cat bounce
Eying on monthly charts ,a TPO lies there stating active vol where buyers are defending thieirpositions. Henceforth, Ideal buys goes from 0.05902 where a days retest is needed.
Soon a candle to be seen big enough strong to give you good bucks!

FIOUSDT | Massive Upside PotentialI want to get involved in fiousdt as a long-term investor, but I also want the price to give a reasonable place to enter.
The green box is the area where the price may retest on the daily chart, but we can see that cryptos do not give these retests in many cases.
Therefore, if there is an upward break in the low time intervals, I will take entries from the retests there.
The green box is worth waiting for as the old high and demand zones, and the 41 cent and 30 cent zones are also worth waiting for. Don't get fooled by buying large amounts quickly. Crypto is a market that gives big corrections as well as extremely fast rises.
If you buy the levels you planned in advance on the days when everyone says the bull market is over and you have plans in case it falls even further, then you have done well. The only help I can give you is to provide these levels professionally, you can see examples of this below.
🐶 DOGEUSDT.P: Next Move
🎨 RENDERUSDT.P: Opportunity of the Month
💎 ETHUSDT.P: Where to Retrace
🟢 BNBUSDT.P: Potential Surge
📊 BTC Dominance: Reaction Zone
🌊 WAVESUSDT.P: Demand Zone Potential
🟣 UNIUSDT.P: Long-Term Trade
🔵 XRPUSDT.P: Entry Zones
🔗 LINKUSDT.P: Follow The River
📈 BTCUSDT.P: Two Key Demand Zones
🟩 POLUSDT: Bullish Momentum
🌟 PENDLEUSDT: Where Opportunity Meets Precision
🔥 BTCUSDT.P: Liquidation of Highly Leveraged Longs
🌊 SOLUSDT.P: SOL's Dip - Your Opportunity
🐸 1000PEPEUSDT.P: Prime Bounce Zone Unlocked
🚀 ETHUSDT.P: Set to Explode - Don't Miss This Game Changer
🤖 IQUSDT: Smart Plan

FIOUSDT 1WFIO ~ 1W
#FIO If you have Conviction on the coin,. Buy gradually on this resistance block if you are an aggressive trader.
But if you are a trader who plays it safe, buy gradually when retesting this resistance line. minimum target 20%+

FIOUSDT Long-Term View:Hey there, crypto traders!
If you like my graphics, send some 💙💛
Today let's discover the chart of BINANCE:FIOUSDT consolidated in the Falling Wedge pattern.
This chart formation suggests a substantial move, potentially revisiting previous support-resistance levels.
Waiting for a confirmed breakout is crucial, guarding against premature moves that might lead to new All-Time Lows.
🎯 Key Resistance Levels:
0.019 - 0.026 - 0.036 - 0.059 - 0.088
Patience is key!

FIOUSDT (FIOProtocol) Updated till 21-09-24FIOUSDT (FIOProtocol) Daily timeframe range. it had a nice pump made some profit from local low myself. a valid close above 0.04168 can resume the push if the retrace point can hold. recent support at 0.03104.

FIO Good opportunityI see a good opportunity to buy some FIO. Price is moving on daily and hourly support, and it's also trying to bounce from main trendline. If the price will reclaim and break the resistance on H1 timeframe (0.0256) we can see a decent pump.

FIOUSDT(FIO Protocol) Daily tf Range Updated till 26-01-24FIOUSDT(FIO Protocol) Daily timeframe range. 0.02355 - 0.02921 range level still intact. if it cant break 0.02355 it will try again at 0.02921. depends on volume whether it can cross it or not.


FIO / USDT Got Some PotentialFIO in the process of the rebound near support range.
Long-term view live chart is below:

FIO might follow FRONTHello Traders,
As you can see, everything is visible on the chart. Front started wallet season. So, FIO can follow it.
Please hit the boost button and follow me for more ideas.
Thanks

FIO/USDT looking good on chartWill be waiting for good rise on FIO/USDT overall a down on BTC till 24K-23K will be good for alts if it holds that price. Otherways if down on BTC won't happen, then this chart is active on short term.
Not financial advice. DYOR.

$FIO/#USDT [#FIO Protocol]: Resistance_Breakout◳◱ A Resistance Breakout has been identified on the $FIO / $USDT chart. The price has broken above a key resistance level, indicating a potential bullish trend. The next resistance key levels are located at 0.0364 | 0.0403 | 0.0478, and the major support zones can be found at 0.0289 | 0.0253 | 0.0178. Consider entering at the current price zone of 0.0319 and targeting higher levels.
◰◲ General info :
▣ Name: FIO Protocol
▣ Rank: 487
▣ Exchanges: Binance, Huobipro, Gateio, Mexc
▣ Category/Sector: Payments - Interoperability
▣ Overview: The FIO Protocol is a Layer 1 blockchain built as a usability solution for the entire blockchain ecosystem. It sits beside and works with all other blockchains to securely facilitate workflow, confirmation, and other data between any and all blockchain/crypto user applications in a decentralized and self sovereign manner.
FIO Protocol augments blockchain interactions to enable usability features like human-readable wallet names (e.g. jane@smith), decentralized payment requests (e.g. for invoicing, order carts, etc.), cross-chain metadata (e.g. to note invoice ID, order #, etc.), and NFT forgery prevention. It can be integrated into any wallet, exchange, payment processor, NFT marketplace, or staking platform.
◰◲ Technical Metrics :
▣ Mrkt Price: 0.0319 ₮
▣ 24HVol: 275,994.603 ₮
▣ 24H Chng: 5.281%
▣ 7-Days Chng: -11.65%
▣ 1-Month Chng: -12.63%
▣ 3-Months Chng: -3.02%
◲◰ Pivot Points - Levels :
◥ Resistance: 0.0364 | 0.0403 | 0.0478
◢ Support: 0.0289 | 0.0253 | 0.0178
◱◳ Indicators recommendation :
▣ Oscillators: NEUTRAL
▣ Moving Averages: BUY
◰◲ Technical Indicators Summary : BUY
◲◰ Sharpe Ratios :
▣ Last 30D: -2.51
▣ Last 90D: -0.37
▣ Last 1-Y: -0.69
▣ Last 3-Y: 0.43
◲◰ Volatility :
▣ Last 30D: 0.83
▣ Last 90D: 0.75
▣ Last 1-Y: 0.93
▣ Last 3-Y: 1.46
◳◰ Market Sentiment Index :
▣ News sentiment score is N/A
▣ Twitter sentiment score is 0.58 - Bullish
▣ Reddit sentiment score is 0.73 - Bullish
▣ In-depth FIOUSDT technical analysis on Tradingview TA page
▣ What do you think of this analysis? Share your insights and let's discuss in the comments below. Your like, follow and support would be greatly appreciated!
◲ Disclaimer
Please note that the information and publications provided are for informational purposes only and should not be construed as financial, investment, trading, or any other type of advice or recommendation. We encourage you to conduct your own research and consult with a qualified professional before making any financial decisions. The use of the information provided is solely at your own risk.
▣ Welcome to the home of charting big: TradingView
Benefit from a ton of financial analysis features, instruments and data. Have a look around, and if you do choose to go with an upgraded plan, you'll get up to $30.
Discover it here - affiliate link -

$FIO/#USDT [#FIO Protocol]: Resistance_Breakout_Confirmation◳◱ We've detected a Resistance Breakout and Confirmation on the $FIO / $USDT chart. The price has broken above a key resistance level and has been confirmed by a strong candle, indicating a potential bullish trend. The next resistance key levels are at 0.0472 | 0.0536 | 0.0678 and the major support zones are respectively at 0.033 | 0.0252 | 0.011. We may consider entering a trade at the current price zone at 0.0453 and targetting higher levels.
◰◲ Technical Metrics :
▣ Mrkt Price: 0.0453 ₮
▣ 24HVol: 1,388,249.465 ₮
▣ 24hChng: 7.092%
◲◰ Pivot Points - Levels :
◥ Resistance: 0.0472 | 0.0536 | 0.0678
◢ Support: 0.033 | 0.0252 | 0.011
◱◳ Indicators recommendation :
▣ Oscillators: BUY
▣ Moving Averages: STRONG_BUY
◰◲ Technical Indicators Summary : STRONG_BUY
◳◰ Market Sentiment Index :
▣ News sentiment score is N/A
▣ Twitter sentiment score is 0.56 - Bullish
▣ Reddit sentiment score is 0.73 - Bullish
▣ In-depth FIOUSDT technical analysis on Tradingview TA page
▣ What do you think of this analysis? Share your insights and let's discuss in the comments below. Your like, follow and support would be greatly appreciated!
◲ Disclaimer
Please note that the information and publications provided are for informational purposes only and should not be construed as financial, investment, trading, or any other type of advice or recommendation. We encourage you to conduct your own research and consult with a qualified professional before making any financial decisions. The use of the information provided is solely at your own risk.
▣ Welcome to the home of charting big: TradingView
Benefit from a ton of financial analysis features, instruments and data. Have a look around, and if you do choose to go with an upgraded plan, you'll get up to $30.
Discover it here - affiliate link -

$FIO/#BTC [#FIO Protocol]: BBand_Breakout Resistance_Breakout_CoHey traders, we've identified bullish signals on the $FIO / $BTC chart through the detection of both a Bollinger Band breakout and a Resistance Breakout. The Bollinger Band indicates a potential bullish trend as the price has moved outside of the upper band, while the Resistance Breakout confirms this trend by showing the price breaking above a key resistance level. Given the alignment of these signals, it may be a good idea to consider entering a long position and targeting higher levels. Our analysis indicates that the key resistance levels are at 0.00000181 | 0.00000198 | 0.00000233 and the major support zones are at 0.00000146 | 0.00000128 | 0.00000093. However, it is important to also consider other factors such as overall market conditions and other technical indicators before making a trade decision.
Technical Metrics :
Current price: 0.00000175
24H Volume: 12.4347 Ƀ
24H Price change: 5.422%
- Pivot Points - Levels :
Resistance: 0.00000181 | 0.00000198 | 0.00000233
Support: 0.00000146 | 0.00000128 | 0.00000093
Indicators recommandation :
Oscillators: NEUTRAL
Moving Averages: STRONG_BUY
Technical Indicators Summary : STRONG_BUY
- In-depth FIOBTC technical analysis on > Tradingview TA page
What do you think of this analysis? Share your insights and let's discuss in the comments below. Your like, follow and support would be greatly appreciated!
Welcome to the home of charting big: TradingView
Benefit from a ton of financial analysis features, instruments and data. Have a look around, and if you do choose to go with an upgraded plan, you'll get up to $30.
Discover it here

FIO CAN PUMP
Hi, dear traders. how are you ? Today we have a viewpoint to BUY/LONG the FIO symbol.
For risk management, please don't forget stop loss and capital management
When we reach the first target, save some profit and then change the stop to entry
Comment if you have any questions
Thank You

FIO/USDT SMALL PUMP EXPECTEDHi folks , FIO is looking strong
Entry :0.044-0.0444
Tp1: 0.0484
Tp2: 0.052
Tp3: 0.058
SL: 0.043
Please buy into parts and set limit for tps , for stoploss I would say close it manually because there can chance for fake bearish wick
For more signals please like my post and follow me , thanks 😊
