25) FKLI : uptrend and expecting it to resumes its bullresumes frm 22), I need to continue writing bcox I find out that once I stopped writing, my trading becomes sucks. I lack the critical thinking that is needed to trade and my performance dropped. Although time is demanding, I try make out the time to write. keep it as simple as possible.
so, fkli is simple. it is in uptrend and no sign of reversing. expecting retracement back to 1525-1535 range for a possible long position. fkli-may needs to fall below the previous higher-low 1508-1510 to signal a possible reversal of trend. that's all...
PLS remember, I am not a guru and this is not a signal service provider. THIS is mere for fun.
#tradersupporttrader #FCPO #FKLI #futurestrader #cpop #malaysiatrader #bursa #BursaMalaysia
Disclaimer : "I am not a guru and I am working hard to make profit same as everyone else. This is not a recommendation of buy or sell, just a mere idea of trading and trading journal. Please consult your financial advisor for any thought of buying or selling. Trade at your own risk."
Fkli

FKLI Week 19 2025: Clear path bullish.A push higher on Friday clear the path towards 1560. That should be the target for next week. Depending on price action at that level, a move towards 1580 area is possible.

FKLI Week 18 2025: Bullish.The index will continue higher next week. First it will take out the current high at 1515 before continuing towards 1530.
However there are two ways for it to do it:
Scenario1: Early of the week at market open price will straight making a move higher. This is supported by the higher closed of the weekly candle that already mitigated the bearish condition.
Scenario2: The index might retrace into 1490 area before creating a support to continue higher. However a closed below 1490 will give a hint that there is a shift towards a bearish condition.
Overall bullish condition into next week.

FKLI Week 15 2025: To regain 1500 level.A rally today has provided a rebound for FKLI to regain the 1500 level. From the chart the lower low are not able to create a new lower low and price rebound today created a based where a move higher towards 1500 is likely. If price close above and stay above 1500 then a move towards 1600 is possible. Let's see.

FKLI Week 10 2025: Bearish.I think the FKLI is bearish right now. It might tested the 1500 level. The momentum lower is strong and we will reach 1500 very soon. From there on it will be depending on the price action on whether 1500 will hold or break lower.

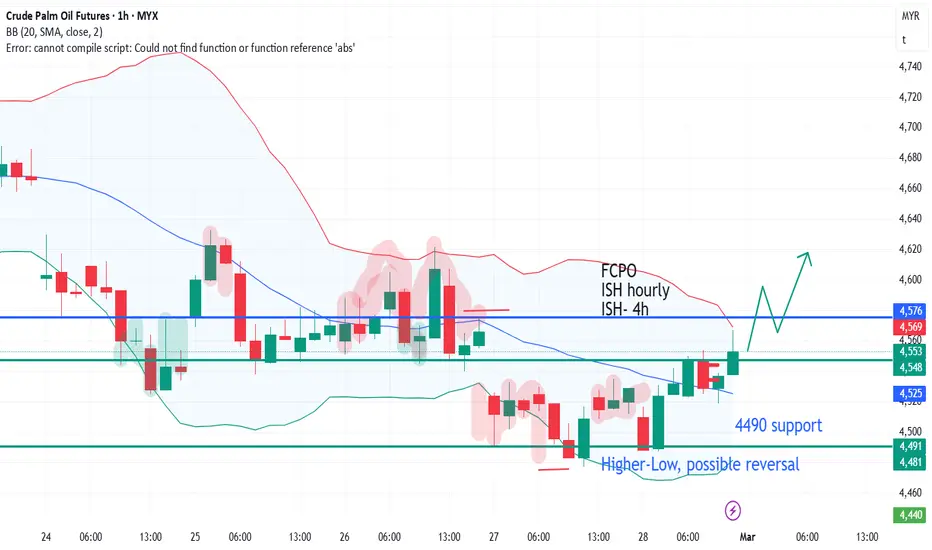
23) FCPO : Bear is making its call, but possible reversal...?update frm 20), Fcpo-May were in bearish last week but price frm 4500 is still holding. At least, it is still holding at 4490 and what so special about the end of the week was, formation of Double-Bottom which seemed more like a "Higher-Low" was formed. Price was able to rebound frm low and was tapped out at 1560 resistance.
Fcpo-May needs to break above 4576, the previous lower-high (blue-line), to confirm a possible shift-of-trend. Higher resistance is at 4622-4634 and 4700.
-IF the bear pulls back the price, THEN market will find some support at 4528-4490.
-IF price is below 4490-4500, THEN lower support is at pretty far at 4400, 4300.
PLS remember, I am not a guru and this is not a signal service provider. THIS is mere for fun.
#tradersupporttrader #FCPO #FKLI #futurestrader #cpop #malaysiatrader #bursa #BursaMalaysia
Disclaimer : "I am not a guru and I am working hard to make profit same as everyone else. This is not a recommendation of buy or sell, just a mere idea of trading and trading journal. Please consult your financial advisor for any thought of buying or selling. Trade at your own risk."
22) FKLI : downtrend but possible rebound?resumes frm 21), fkli-feb did the exact opposite of my expectation! On my titled "reverse-to-bullish", it didn't reversed to bullish at all! But what had happened was it formed some kinda "head" at 1591, then trapped in tight range frm 1581-1585, then rollover all the way down. Price formed lower-low at 1560++, then shoot all the way up to...1591!
At the end of February, last-day pull-up oso did not happen. Some of the stocks gave out disappointing quarter results such as Genting, Genm, etc...MOst probably this was one of the reason for the sudden fall. More bad news to come? Well, we have to wait for US then. One of the thing to look out was this current support level,1537-1540, which was a strong critical area bcox it was tested multiple times in the past.
-IF no more bad news and this support level hold, THEN fkli-march might test back 1565-1585 level.
- IF the bear is strong, THEN lower level of support range frm 1500-1510.
-IF bull is trying to reverse the trend, THEN it has to fight back higher than 1565-1585 level, reaching the closest high frm 1600-1605. I am not ashamed if my prediction is wrong because this is part and parcel of trading. IF I am right, THEN I go for it. IF I am wrong, THEN cutloss. Simple.
GUd luck and gud hunting.
PLS remember, I am not a guru and this is not a signal service provider. THIS is mere for fun.
#tradersupporttrader #FCPO #FKLI #futurestrader #cpop #malaysiatrader #bursa #BursaMalaysia
Disclaimer : "I am not a guru and I am working hard to make profit same as everyone else. This is not a recommendation of buy or sell, just a mere idea of trading and trading journal. Please consult your financial advisor for any thought of buying or selling. Trade at your own risk."

21) FKLI : reverse to bullishresumes frm 18), fkli-feb dropped down to slightly lower than the expected 1575, reaching low at 1572(1571.5 precisely), THEN a rebound on FRiday! A classic false breakout to the downside. A reversal is said to be formed when the price broke abv the previous lower-high at 1583 (the red marker) and closed at 1589.5 on FRiday, 21st Feb25. Now, bull is in charge.
IF the market is aggressive to the upside, THEN it will retest 1595-1600. IF the market breaks above the strong resistance 1600, THEN it will go to the next level at 1613 and 1628.
IF the market is slow-ish, THEN fkli-feb will hover from 1584-1588 immediate support till 1595. Deeper consolidation will touch range from 1585-1572. Price below 1572 indicate another round of bearish market appears. Since next week is the last week of February month, I will bet on "end-of-month bull rally". End of the month typically is a bull rally for fkli on some special months but most of the time it is just the last-day-of-the-month rally!
PLS remember, I am not a guru and this is not a signal service provider. THIS is mere for fun.
#tradersupporttrader #FCPO #FKLI #futurestrader #cpop #malaysiatrader #bursa #BursaMalaysia
Disclaimer : "I am not a guru and I am working hard to make profit same as everyone else. This is not a recommendation of buy or sell, just a mere idea of trading and trading journal. Please consult your financial advisor for any thought of buying or selling. Trade at your own risk."

20) FCPO : Bull might come to an end...or juz correction?update frm 19), Fcpo-May will continue next MOnday, 24-28th Feb 2025, the last week in month of February. What happened last week was fcpo-May made what seemed like a false breakout, 4700-4720, then quickly went down. The range of 4634-4700 is important for bull to stay afloat. Price breaking below 4634 indicates the possible reversal of trend. Price within 4634-4700 is bull...IF bull is aggressive, THEN it may gap up abv 4720 and higher.
IF the market is mild drop, THEN it will range frm the 4555-4634 but it is still bearish. IF market falls below the 4500-4560, THEN the next level is pretty low at 4400-4300, THEN it is a strong bearish market.
PLS remember, I am not a guru and this is not a signal service provider. THIS is mere for fun.
#tradersupporttrader #FCPO #FKLI #futurestrader #cpop #malaysiatrader #bursa #BursaMalaysia
Disclaimer : "I am not a guru and I am working hard to make profit same as everyone else. This is not a recommendation of buy or sell, just a mere idea of trading and trading journal. Please consult your financial advisor for any thought of buying or selling. Trade at your own risk."

19) FCPO : uptrend resumes...???update frm 16), price frm fcpo-apr has come to an end. Fcpo-May will appear next MOnday, 17-21st Feb 2025. What happened last week was unpredicted. Price gapped up to 4640-4700 then sank lower to the 4630-4650 range. The next day, it gapped down 30pts to 4620 and fell to 4540, then rebound back to 4630...
IF the market is aggressive drop, THEN it will hit the 4540-4490. IF market falls below the critical 4490(4487 to be precise) which is also the previous higher-low, THEN market has probably reverses.
IF the market is slow-ish, THEN it will lower back to 4600-4540. IF the market continues bullish, price has to break abv 4600-4630, and retest the latest high at 4700.
PLS remember, I am not a guru and this is not a signal service provider. THIS is mere for fun.
#tradersupporttrader #FCPO #FKLI #futurestrader #cpop #malaysiatrader #bursa #BursaMalaysia
Disclaimer : "I am not a guru and I am working hard to make profit same as everyone else. This is not a recommendation of buy or sell, just a mere idea of trading and trading journal. Please consult your financial advisor for any thought of buying or selling. Trade at your own risk."

18) FKLI : bull and bear plays tug-of-warresumes frm 17), the latest high has broken above previous high of 1590 and creates higher-high at 1600-1605. Basically, bull is still IN CONTROL but a possible "head" has been formed. At the end of the week, price falls at 1592.5. Bull still maintains till 1575 closest higher-low is broken.
This could be a mere consolidation phase of a bull or a reversal...
IF the market is aggressive to the downside, THEN it will retest 1575-1585. IF the market breaks lower than the previous higher-low at 1575, THEN market has reversed into bear.
IF the market is slow-ish, THEN current point 1590 - 1595 is the range for possible continuation to higher price. Deeper consolidation will touch range from 1585-1590.
PLS remember, I am not a guru and this is not a signal service provider. THIS is mere for fun.
#tradersupporttrader #FCPO #FKLI #futurestrader #cpop #malaysiatrader #bursa #BursaMalaysia
Disclaimer : "I am not a guru and I am working hard to make profit same as everyone else. This is not a recommendation of buy or sell, just a mere idea of trading and trading journal. Please consult your financial advisor for any thought of buying or selling. Trade at your own risk."

17) FKLI : uptrend continues...resumes frm 14), the previous Lower-high 1564 has been broken. NOw, fkli-feb has been creating more and more higher-low and higher-high till now, reaching 1590.
IF the market is aggressive, THEN it will hit 1600-1613 and probably hit higher.
IF the market is slow-ish, THEN watch out 1583-1588 support, where it is playing tug-of-war with bear.
IF the market breaks lower than the previous higher-low at 1575, THEN market has reversed into bear.
PLS remember, I am not a guru and this is not a signal service provider. THIS is mere for fun.
#tradersupporttrader #FCPO #FKLI #futurestrader #cpop #malaysiatrader #bursa #BursaMalaysia
Disclaimer : "I am not a guru and I am working hard to make profit same as everyone else. This is not a recommendation of buy or sell, just a mere idea of trading and trading journal. Please consult your financial advisor for any thought of buying or selling. Trade at your own risk."

16) FCPO : uptrend resumes...update frm 15), price frm fcpo-apr has resumed to break to higher-high, above the previous 4400-4420, making the uptrend continues higher at 4600 now (close to). Previous resistance is now the support level, which is 4500-4540. The overhead resistance ranges frm 4630-4650.
IF the market is aggressive(since fcpo-apr ends this week), THEN it will hit the 4630-4650 immediately and go further up.
IF the market is slow-ish, THEN it will lower back to 4500-4540 and play some tug-of-war with bear but Bull is still the major preference. OR tangling between 4540 -4630 region.
IF market falls below the critical 4490(4487 to be precise) which is also the previous higher-low, THEN market has probably reverses.
That's all for tdy. Happy Thaipusam and hapi holiday. Happy hunting.
PLS remember, I am not a guru and this is not a signal service provider. THIS is mere for fun.
#tradersupporttrader #FCPO #FKLI #futurestrader #cpop #malaysiatrader #bursa #BursaMalaysia
Disclaimer : "I am not a guru and I am working hard to make profit same as everyone else. This is not a recommendation of buy or sell, just a mere idea of trading and trading journal. Please consult your financial advisor for any thought of buying or selling. Trade at your own risk."

15) FCPO : uptrend persists this week update frm 13), price frm fcpo-apr has broken abv the previous HL, 4280 on 28th and 31st Jan 2025. Again, I have missed some really exciting moves bcox of my absence in holiday. Price might move back to 4300-4330 or even 4280 IF it is a deep retracement, form some kinda base thr and rebound.
price could oso gap up further around 4420-4480 as bull pushes further, after testing 4400-4415 tdy. previous Higher-Low was at 4265-4255 and IF this level is broken, THEN the trend has reversed.
PLS remember, I am not a guru and this is not a signal service provider. THIS is mere for fun.
#tradersupporttrader #FCPO #FKLI #futurestrader #cpop #malaysiatrader #bursa #BursaMalaysia
Disclaimer : "I am not a guru and I am working hard to make profit same as everyone else. This is not a recommendation of buy or sell, just a mere idea of trading and trading journal. Please consult your financial advisor for any thought of buying or selling. Trade at your own risk."

14) FKLI : possible reversal
Fkli-feb has shown a possible reversal, creating a higher-low tdy. price to watch out is at 1564, the previous Lower-High, before descending further into the previous support level...1540...that was the lowest point set (around that level) on 17th Jan 2025, forming double bottom in daily chart. IF this price 1564 is broken to the upside, THEN we have a confirmation shift of trend and uptrend has come back.
tug-of-war between bull and bear happens between 1540-1560 level...
IF price breaks below 1540 support level (lowest point 1536?), THEN bear continues...
PLS remember, I am not a guru and this is not a signal service provider. THIS is mere for fun.
#tradersupporttrader #FCPO #FKLI #futurestrader #cpop #malaysiatrader #bursa #BursaMalaysia
Disclaimer : "I am not a guru and I am working hard to make profit same as everyone else. This is not a recommendation of buy or sell, just a mere idea of trading and trading journal. Please consult your financial advisor for any thought of buying or selling. Trade at your own risk."

13) FCPO : bull and bear are playing tug-of-warAs I continue frm the previous 11), I quoted that fcpo might test the 4280 soon. Well, this wasn't the case for last week, 20-24th Jan 2025. fcpo was trading within the range frm 4135 - 4280. Although price had fallen frm 21-23rd Jan, market has rebounded in the last minute, which was on the Friday, 24th...so it is possible that a reversal has happened.
Price moving above 4280 will confirm a bullish comeback while price below 4135 indicates a bearish move that eventually hits 4100 and 4000.
PLS remember, I am not a guru and this is not a signal service provider. THIS is mere for fun.
#tradersupporttrader #FCPO #FKLI #futurestrader #cpop #malaysiatrader #bursa #BursaMalaysia
Disclaimer : "I am not a guru and I am working hard to make profit same as everyone else. This is not a recommendation of buy or sell, just a mere idea of trading and trading journal. Please consult your financial advisor for any thought of buying or selling. Trade at your own risk."

12) FKLI : bad news breaking out? Thing is not looking gud for my last week paper trading in fkli as a "downtrend channel" is formed (red color "bridge" heading downside). The immediate support is at right now, 1560. Price needs to test immediate resistance at 1570, and if it is successful, then it will go back to the recent high at 1585. Further above 1585 signals the recent uptrend continues or IF it falls below 1540-1538, THEN the strong bear continues.
I am still of the opinion that somethg bad is going to break out frm the end of January 2025 either frm US or Japan based on recent market performance. However, not all going doom and gloom. Happy Chinese New Year and Gong XI Fa Cai!
PLS remember, I am not a guru and this is not a signal service provider. THIS is mere for fun.
#tradersupporttrader #FCPO #FKLI #futurestrader #cpop #malaysiatrader #bursa #BursaMalaysia
Disclaimer : "I am not a guru and I am working hard to make profit same as everyone else. This is not a recommendation of buy or sell, just a mere idea of trading and trading journal. Please consult your financial advisor for any thought of buying or selling. Trade at your own risk."

11) fcpo : play predict the market againinstead of super huge 4280 yesterday, I shall focus on what is happening now. price will fluctuate between 4170 -4200 and move higher to retest 4280 IF it is a real rebound.
...fcpo is a fast moving market, so before u know, it is ald testing higher and higher price at like 4400 and 4530...
IF it is not a real rebound, THEN u will see price descend lower to 4100 and 4000
PLS remember, I am not a guru and this is not a signal service provider. THIS is mere for fun.
#tradersupporttrader #FCPO #FKLI #futurestrader #cpop #malaysiatrader #bursa #BursaMalaysia
Disclaimer : "I am not a guru and I am working hard to make profit same as everyone else. This is not a recommendation of buy or sell, just a mere idea of trading and trading journal. Please consult your financial advisor for any thought of buying or selling. Trade at your own risk."

10) FKLI : another losing day, but wait for next roundit is very obvious! nothing is wrong with the strategy. it is me. ok. long story short, I short fkli at 1546, SL 1552...and yes...it was stopped out...bcox market is heading for rebound...so wait for price to break abv 1570, then retraces back...see how...
be patient...wait...
PLS remember, I am not a guru and this is not a signal service provider. THIS is mere for fun.
#tradersupporttrader #FCPO #FKLI #futurestrader #cpop #malaysiatrader #bursa #BursaMalaysia
Disclaimer : "I am not a guru and I am working hard to make profit same as everyone else. This is not a recommendation of buy or sell, just a mere idea of trading and trading journal. Please consult your financial advisor for any thought of buying or selling. Trade at your own risk."

9) FCPO : slipping down further by the time I am writing this, fcpo-apr has slipped down further to 4140...fcpo has gone tru a 100pts gap down on the exchange date and another two more gaps after that. My bias, fcpo-apr is oversold! of course, my bias, not the market. I tried to long the market three times and all losers. down 40pts++. maybe I should have stopped as my plan. when it hits 10% drawdowns. now it marks somewhere to 15%. maybe I should juz short the market when it looks like falling.
fcpo needs to challenge 4280++ to reverse the trend and now it is heading to 4000.
PLS remember, I am not a guru and this is not a signal service provider. THIS is mere for fun.
#tradersupporttrader #FCPO #FKLI #futurestrader #cpop #malaysiatrader #bursa #BursaMalaysia
Disclaimer : "I am not a guru and I am working hard to make profit same as everyone else. This is not a recommendation of buy or sell, just a mere idea of trading and trading journal. Please consult your financial advisor for any thought of buying or selling. Trade at your own risk."

8) FKLI : missing trades and repeating mistakeI don't know what is the news but the market has broken way lower than my expected 1580 and are now in the next range of 1530-1550 region. I really have my own bias and I thought the market is oversold. That is the "counter-trend's bug" in my head. When I tried to short the market, there will be a voice in my head saying "it will rebound!" and making it worse is my short-selling the market was right but I put trail-stop too soon and it was hit. Making a profitable trade becoming just a breakeven trade, yet again. short fkli at 1562, then took it out at 1660, whr it hit my tp at 1552...
3 fcpo trades and all losers, well done!
so i am paying attention to fkli for rebound. fkli has to break abv 1570 to reverse the condition. Further down, market will retest 1500-1510, the low since August 2024. Probably, the same bad news, end of January 2025, BOJ might raise interest rates again...who knows?
PLS remember, I am not a guru and this is not a signal service provider. THIS is mere for fun.
#tradersupporttrader #FCPO #FKLI #futurestrader #cpop #malaysiatrader #bursa #BursaMalaysia
Disclaimer : "I am not a guru and I am working hard to make profit same as everyone else. This is not a recommendation of buy or sell, just a mere idea of trading and trading journal. Please consult your financial advisor for any thought of buying or selling. Trade at your own risk."

7) FCPO : hit 10% drawdowns. what next?my earlier prediction that fcpo might go on strong bullish action has gone bad. three trades, two losses, one breakeven. now since I have hit the 10% drawdowns, I think I need to stop trading real ones and wait till Feb. let see how it goes. haiz. maybe I should set "stop-and-reverse" straight away. tmr is the last day of fcpo-march, at least break for one day first to cool things out.
PLS remember, I am not a guru and this is not a signal service provider. THIS is mere for fun.
#tradersupporttrader #FCPO #FKLI #futurestrader #cpop #malaysiatrader #bursa #BursaMalaysia
Disclaimer : "I am not a guru and I am working hard to make profit same as everyone else. This is not a recommendation of buy or sell, just a mere idea of trading and trading journal. Please consult your financial advisor for any thought of buying or selling. Trade at your own risk."

6) FKLI : I screw up the last time, what is next? - as a respond to the previous no 3), YES! I am reacting too fast and miss out on a big fall. That feeling was devastating. Just entering the second weeks of new year and I made a horrible mistake by cutting the profits short. These are indeed bad, winning trades. Repeat these actions more then I will end up "retiring" early this year.
- next week, IF bear continues to "kill" the market, THEN we will probably see price moves to 1580, a critical support. This level was hit several times last year in June, NOv and Dec 2024 and it will most likely hold unless there is more bad news from the market. THEN, we will see level like 1530-1550, or 1500-1510, which was tested during the early August fall 2024.
-IF the market is to rebound, THEN first it must get above the "overhead" resistance at 1605 and
test higher level at 1610-1615.
PS : there is a myth saying that if you want to know what will happen to the bursa malaysia for the rest of the year, you must first look at the first week in January of that year. Now, the first and second week fkli ald dropped frm high at 1640 to now below 1600, so the whole year is "roasted"? haha...kidding'.
PLS remember, I am not a guru and this is not a signal service provider. THIS is mere for fun.
#tradersupporttrader #FCPO #FKLI #futurestrader #cpop #malaysiatrader #bursa #BursaMalaysia
Disclaimer : "I am not a guru and I am working hard to make profit same as everyone else. This is not a recommendation of buy or sell, just a mere idea of trading and trading journal. Please consult your financial advisor for any thought of buying or selling. Trade at your own risk."
