8) hibiscus - top 20 jewel series of malaysia stockstop 20 jewels frm a very popular local bank...
technical : let's look at some price action...
after a huge "head-and-shoulder" pattern, hibiscs has been tru a gap down in mid-March, and a slow, rebound has occurred...
recent move, hibiscs is in asymmetrical triangle pattern, breaking to the upside is RM0.71-0.76 resistance while to the downside, is the RM0.55 support level...
current support : RM0.55
lower support : RM0.40-0.25
resistance : RM0.71-0.76
Overall, hibiscus is still in consolidation phase, breakout to either side shall signal us a buy or a sell...
WARNING : this is juz a trading idea...trade at your own risk!
**your "LIKE" and "FOLLOW" are my main source of motivation to continue posting more valuable contents...TQ**
this is trade 88)
Fkli

FKLI TRADING : 87) testing 1616-1620 resistanceuptrend persists...might test resistance 1620-1640 soon...
overhead resistance : 1616-1620
higher resistance : 1636-40
support level : 1587-1595
psychological support : 1600

FCPO TRADING : 86) full steam ahead...uptrend persistsgap up go up scenario tdy...
support : 2580 -2560
resistance : 2620-2630...
higher resistance : 2690-2700

July15 - FKLI (1h) - Quick Update: Weakness towards 156x-8xTemporary top on FKLI, companied by weakening momentum, short-term favouring bears. 🐻
Quick Short idea, in line with the major Bearish ABC correction wave view.
Refer: July06 FKLI post below 👇🏻👇🏻
Happy Hunting! 🏹🎯
-jk-

FKLI TRADING : 83) 1st support level reaching the 1st support level --- 1587 -1590...
1) long 1587, 1st tp 1606, 2nd tp 1616
This is trade no 83) frm haidojo trading. this is one of the trade in the last 2 possible trades...fkli-july din make a Double-Top as expected...reaching the 1st support level at 1587-90...
or if you can wait, the second support level at 2560-2555...
support level : 1587-1590
lower support level : 2555-2560
resistance : 1616-1620
still indecisive of the direction yet...but overall, market still in uptrend...
WARNING : THIS IS JUZ FOR EDUCATIONAL PURPOSE ONLI, TRADE AT YOUR OWN RISK
**your LIKE and FOLLOW are greatly appreciated, they are my main motivators to proceed**

FKLI TRADING : 84) I have a confession to makethis is trade 84) frm haidojo trading..as predicted earlier, fkli has broken below the 1587 and went very close to the 1555-1560 level, but not touching it...
so now after breaking tru 2 level of supports, which are 1587 and 1570 (I have to confess, I totally missed this)...now price has found a new support level at 1563...somewhr in between 1560 and 1570...
support level : 1555-1560
lower support : 1512 -1500
resistance : 1587-1590
higher resistance : 1616 - 1620
in my opinion, some key level of support has been broken, therefore reversal has happened and ur trading trend should change...watch out for short instead of long...of course, I could be wrong...? hehe, no expert here but definitely a chart-luver...
WARNING : this is juz for personal use and educational purpose onli, pliz do not take this is hint of buying and selling, trade at your own risk...
**welcome to leave any comments and your "LIKE" and "FOLLOW" are highly appreciated bcox they have become my main motivation to continue posting high-value contents...**

FKLI TRADING : 81) 2 possible trading opportunitieshi, this is trade 81) frm haidojo trading. I am presented with 2 possible trading opportunities in fkli-july...
1) for a possible counter-trend trade, if formation of Double-Top happens near 1616-1620, and RSI OB(Overbought), then go for short with the 1st tp near support level 1580, 2nd tp near 1560...make your SL possible like 5-10pts abv entry...
2) if you are going for trend-continuation trade, then wait for some signals at 1580, tp 1616, SL 5-10pts below entry...
or long at lower support level, 1560, 1st tp 1580...2nd tp 1616...SL put 5-10pts below entry...
WARNING : This is just for educational purpose onli, it is not a hint of buying nor selling...pliz consult your financial advisor before putting any extra risk in your futures trading...

FCPO TRADING : 82) reaching the 1st resistance-2560still uptrend, reaching the 1st resistance -2560...
might retest the next level at 2630...or retraces back to previous resistance-turn-support, 2476-2500...the end of fcpo-sept, new active month is fcpo-oct...
current support/resistance : 2560
higher resistance : 2630
lower support : 2476 - 2500 psychological number
WARNING :THIS IS FOR EDUCATIONAL PURPOSE ONLY. NOT FOR HINT OF BUYING OR SELLING.TRADE AT YOUR OWN RISK.
**your FOLLOW and LIKE are my best motivation to continue posting valuable contents...**

FKLI TRADING : 80) bearish divergence formation in daily chartthis is trade no 80) frm haidojo trading... bearish divergence is formed in daily chart for fkli-july so it is possible a signal for reversal...
fkli is facing resistance for 1620-1640 range...
current support level : 1580
lower support level : 1560
thr is no confirmation shift of trend yet...therefore shorting the market seems to be a bit too early...however, eyes wide open for more reversal signals to come...
WARNING : juz for educational sharing, not for buying nor selling hints, pliz trade at your own risk

FCPO TRADING : 79) imminent breakout to the upsidethis is trade 79) frm Haidojo trading...fcpo-sept has broken to the upside to test further resistance frm 2560-2630...
full steam ahead...! with 2 more days before the exchange date on 16th of the month, so I guesss the price is going to go wild...
overhead resistance : 2560 -2630
support : resistance-turn-support 2474-2500 psychological number
market is bias to the upside so trend-continuation trade is preferred...
WARNING : no hint of buying nor selling, pliz trade at your own risk...
**"LIKE" and "FOLLOW" frm you guys are my main motivation to create more valuable contents...**

FCPO TRADING : 78) false breakout shows its ugly head again...!this is trade no 78, an added info to the same fcpo chart...
introducing a breakout killer - "false breakout"...today false breakout has yet shown its ugly head again...if you trade a breakout strategy then you need to add extra filter to eliminate those bad trades...well, I have found one...hehehe...let's share yours if you got one...tell me in the comment section below...
I was waiting for my entry signal today and at last...found none...saved by the bell...
gud luck and gud trading
**PS : as a token of encouragement to motivate me further, I am really in need of some "LIKE" and "FOLLOW" **

FKLI TRADE : 77) imminent upside to retest 1620-1640fkli continues its uptrend, despite having some political issues in the Parliament...which is not suitable to be discussed here...however, for most of South-East Asia's countries, politic cannot be separated from its economy...that's the hardcore facts...
current resistance : 1620-1640
support : 1587-1600
strong support : 1556-60
I am no expert, but I am definitely a chart's maniac...hehehe...
gud luck and gud trading
**PS : as a token of encouragement to motivate me further, I am really in need of some "LIKE" and "FOLLOW" **

July06: FKLI(1D) - Midterm ABC Correction to 140x-5x in ProgressMid-term ABC Correction went as expected, see prev post from June15.
June15 - FKLI (1D) - Mid-term Correction towards 140x... 👇🏻👇🏻
Currently, we are in waveB (see: baby blue arrow marker), which may find resistance near R1, 154x-6x.
Declining volume suggests/confirms the correctional-upwave.
I'm positional Short for FKLI, holding thru next potential down-waveC, targeting S3,S4.
Levels to Watch:
R2: ~158x
R1: 154x-6x
Major S1: 147x-149x
S2: 142x-4x
Major S3: 138x-140x
Happy Hunting! 🏹🎯
-jk-

The ONLY path after banning short selling is FLY Hi!Securities Commission (SC) of Malaysia, which has banned short selling on Bursa Malaysia, has further extended its date from June 30 to Dec 31, 2020
finally, a breakout...fcpo finally gave a breakout on last friday, breaking through the immediate resistance frm 2400-2420...uptrend continues
resistance : 2470
next level resistance : 2580- 2600
support level : 2440
lower support level : 2400 - 2420
pls give a like and follows, thx

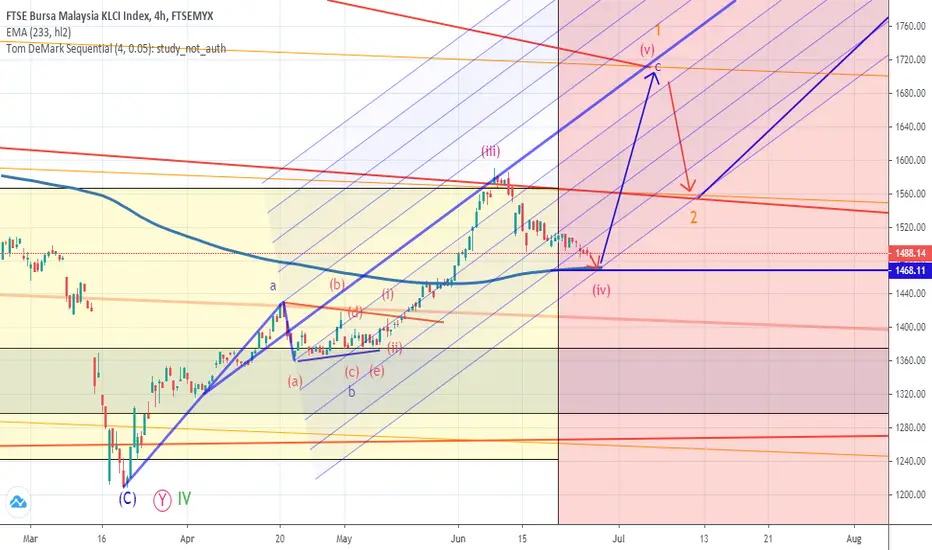
KLCI Future shortterm waves updated 18 June 2020Detail @ The Chart. p/s Inside any impulsive, there is ONLY abc waves not 1,2,3,4,5 waves.....
checking the trend using MA linenormally, I dun use indicator as buying or selling signal...juz use them as tools to check trend...try this one, Moving Average-200 day for checking fkli daily chart...SMA works better, but this one juz fine...
EMA normally goes with lower timeframe....
leave me a message if I were wrong...
look like the bull and bear are still playing "tug-of-war" between them...1514 is the immediate support level where the SMA-200 falls into...

sideway tradingsideway since 3rd June 2020...market more bias to trending to the downside, but as long as the competition of bull and bear has not shown any edge over the other, sideway market will continue...
resistance level : 2380 -2420
support level : 2300 -2320
if you trade trend, this is the time you "die"...either by the untrending pattern or because of boredom...

a trading method called "2618" fkli"2618" means 2 tops or double tops, then follow by retracement back to 618...then usually a downtrend...
of course, this is juz a trading idea, no indication of buying or selling...
strong resistance : 1584-1600
current resistance : 1560
current support : 1500-1520

head and shoulder pattern in fcpo possible formation of "head-and-shoulder" pattern in fcpo hourly chart...
resistance : 2400 - 2420
support : 2300
lower support level : 2200


fcpo possible reversal or formation of the "head"current resistance : 2400-2420
current support : 2300
lower support level : 2200
the price might come to a reversal region...

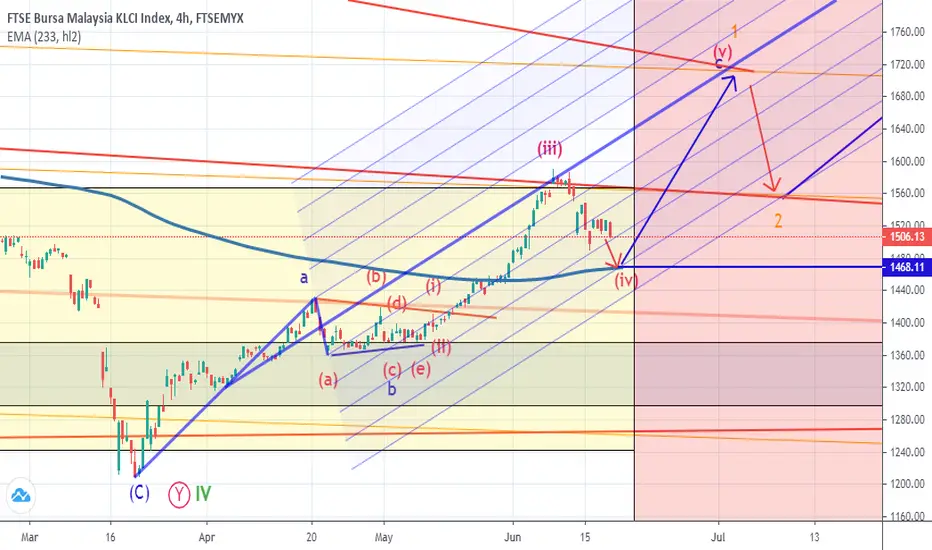
KLCI will make history high again! Before having>50% discount!Expanding Ending Diagonal Pattern. Detail @ The Chart. p/s Inside any Impulsive there is only abc subways
