The "marubozu" Candlestick is roaring..Overall momentum remains strong, underpinned by “marubozu” candlestick pattern. Expected the index will test the psychological resistance in the near term.
Due to Malaysia Government is struggling to fight back the economy, in Q3 is seen a little bit of hope to recover back for a short period.
Fkli

simple bracketing market again...FCPO active month
current resistance : 2300
current support : 2250
strong support : 2200-2210
waiting for a breakout
this is a trading journal, not recommendation of buying or selling
fcpo trading


FKLI - Hovering at Key HurdleFKLI - Bullish engulfing candlestick formation, with indicators continue to rally. But resistance is clear at middle BB, this level is crucial to define index next direction.

FKLI - Unfortunate BullFKLI
Trend: Tech rebound
Rst: 1,320
Spp: 1,300/ 1,275
Strong technical rebound which we see 4H candle pierced through middle BB, but unfortunately this may be brought down again next Monday by weaker US and European market last night. Big direction - still pointing to south.

FKLI - No Trustable Support NowFKLI
Trend: Bearish
Rst: 1,240
Spp: 1,205
Bearish candle formed below lower BB, still way weak and dominated by bear. Any chance the index rebound, grab the chance to short.

FKLI - Bullish BatFKLI has fallen over 423 points (16th Apr 2018 - 24th Feb 2020)
A bullish bat pattern formed at 1524.00
Currently the price is hover in the PRZ Zone & there is a lower gap between 1515 - 1503. We are waiting for the price moving back upwards and above 1524 then we could looking for a high probability long trade.
PRZ: 1524.00
SL: 1421.5
TP1: 1666.00
TP2: 1753.5
Ideally looking for RSI bounce back out of the oversold zone and climbing towards the PRZ.


FKLI - All Way DownFKLI
Trend: Bearish
Rst: 1,500
Spp: 1,468
Technically in recession as our index plunges more than 20% from its peak over extended period of time.
Current progress - weekly chart telling the index has arrived Fibo Retracement 61.8%, if it fails to grip its support here, next will be 50%.

FKLI - Sign of Further Technical ReboundFKLI
Trend: Tech rebound
Rst: 1,552
Spp: 1,535
4-hour chart indicates the index has tendency to cast further technical rebound after the emergence of long bullish engulfing candle plus bullish MACD crossover.

FKLI (Weekly Chart) - Bearishness PersistsFKLI
Trend: Bearish
Rst: 1,535
Spp: 1,515
Since our index has fallen like nobody business, we have to turn our view into broader one - weekly chart. This week candle formed at lower BB, means further downside cannot be escaped next week. MACD casting bearish crossover as well, more downside.

FKLI - Juggling At Formidable Resistance LevelFKLI
Trend: Semi-bull
Rst: MA200
Spp: 1,600
Green candle pushed the index to retest formidable resistance at MA200 again but the challenge hits snag. Require to break through from this level to welcome more upside.

FKLI - Bull Spells Stronger ToneFKLI
Trend: Tech rebound
Rst: 1,619
Spp: 1,600/ 1,588
Super bullish candle pushed the index to break multiple resistance levels, strength in RSI continues to unleash. Let's apply BB theory again here, candle close above upper BB means more upside can be expected.

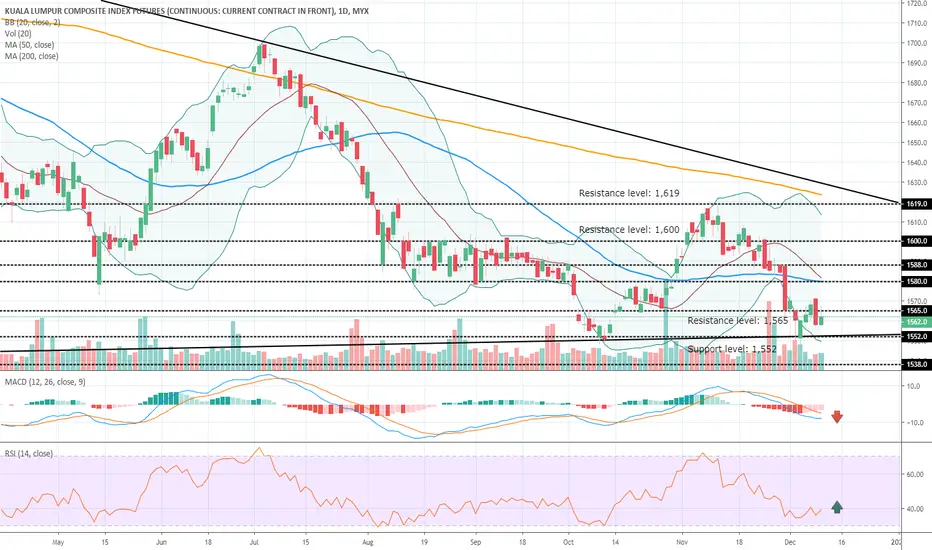
FKLI - Bear Dominating The GameFKLI
Trend: Bearish
Rst: 1,565
Spp: 1,552
Trying to recover above resistance level at 1,565 but hit snag, good thing is RSI slowly recovering northward. But the overall momentum remains sluggish.
FKLI - Bearishness Remains Even Green Candle Done TodayFKLI
Trend: Bearish
Rst: 1,580
Spp: 1,565
Bearishness remains as latest candle is closed below lower BB, and MACD continues to drive lower. No sign of recovery on spot.

FKLI - Shooting Star Candlestick Carries Bearish ToneFKLI - Attempt to recover above 1,600 hit challenge, pushing the formation of shooting star/ bearish candle, MACD on the verge casting bearish crossover. Downside risk remains.

FKLI - 4H Chart Has Further Softening SignalFKLI - 4H breaks down from Head & Shoulder formation, has latest candle close below lower BB, and well below crucial support at 1,600. Further downside likely to unfold towards 1,586.

FKLI - 4 Hours Chart Morning Doji FormationFKLI - Strong support observable above 1,600 and 4-hours chart has morning doji formation which is bullish. MACD remains bullish. Chance to reach 1,619 intact.

FKLI - No Sign of Slowing Down/ More Bullishness ForwardFKLI - Bullish engulfing candle pushed above upper BB, MACD & RSI continue to stay bullish. Upward momentum persists. Resistance at 1,619

FKLI - Widening Bollinger Band & Bullish MACDFKLI - Congrats those longing the index, hit forecasted resistance at 1,600, with widening BB & surging MACD, we expect further bullishness will continue to unleash. Next resistance observable at 1,619

FKLI - Positive Tone for The Index Got StrongerFKLI - 4 hours chart just experienced bullish breakout and MACD bullish crossover and rising RSI. Immediate resistance at 1,580 if break shall lead the index higher towards 1,600

FKLI - Soften But New Support Is FormingFKLI - 4 hours chart has RSI & MACD continue to soften, but the index is trying to forge support new above MA50/ level close to 1,565. If the formation successful, shall lead the index to retest strong resistance level at 1,580

FKLI - Sustaining Above Middle Bollinger Band, Good Things AheadFKLI - 11 points added since we highlighted, the index is now testing to break short term resistance trendline, with the facilitate of MACD & RSI, chance to break is high. Support at middle BB/ 1,572
