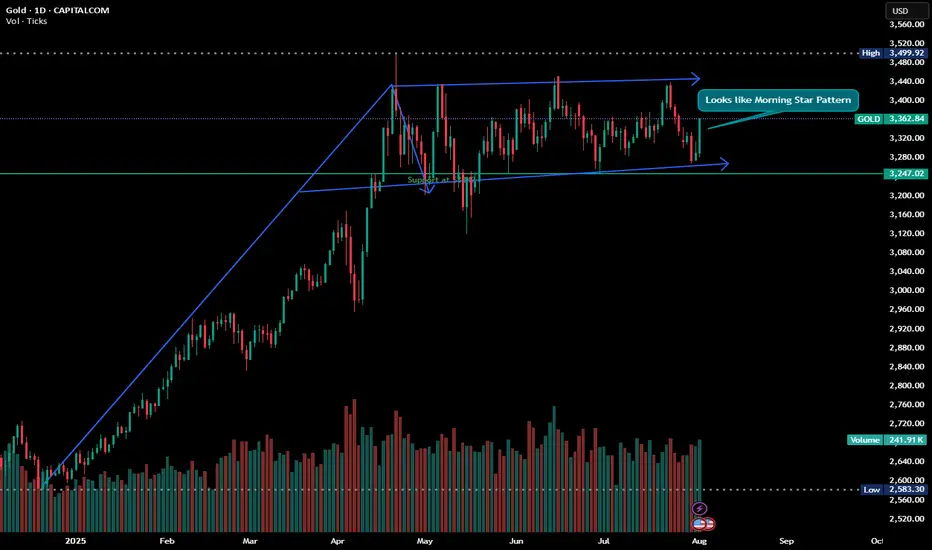
Glitters of Gold - Looks like Morning Star and Bullish Flag Disclaimer : Do your own research before investing. This is just a chart analysis. No recommendation to buy and sell.
With the up and down of stock market, there is always a safe investment place and its shine increase as the time passes with the increase in price, yes its GOLD. Everyone love it. if you look at gold from last couple of years, there is continuous growth in this metal.
while doing my chart analysis i found gold charts are quite interesting.
Gold is currently trading in range and formation of 2 patterns can be seen in the daily chart with my support and resistance level marked in CHART.
For some its investment and for some its trading however my recommendation is always do some SIP in GOLD.
Happy Investing.
Flag-pattern
NEAR - Flag pattern - Next Target is 27$#NEAR #Analysis
---------------------------------------------------------------
Description
---------------------------------------------------------------
+ Near has formed a nice flag pattern and price is waiting for breakout from the flag
+ Next target for near is 27 as per flag pattern, this could happen in the peak of bull run
+ next push could break the resistance and you can enter a position at the current price.
---------------------------------------------------------------
VectorAlgo Trade Details
------------------------------
Entry Price: 5.2
Stop Loss: 3.499
------------------------------
Target 1: 6.290
Target 2: 8.069
Target 3: 13.503
Target 4: 17.690
Target 5: 28.022
------------------------------
Timeframe: 1W
Capital Risk: 1-2% of trading amount
Leverage: 5-10x
---------------------------------------------------------------
Enhance, Trade, Grow
---------------------------------------------------------------
Feel free to share your thoughts and insights.
Don't forget to like and follow us for more trading ideas and discussions.
Best Regards,
VectorAlgo

Arabian Cement : Opportunity after breakout - Target 14Daily chart, the stock EGX:ARCC is trading in a descending channel, and a long flag chart pattern may be completed.
After crossing the Resistance line R, the target will be 12.
Closing above 11.3 for 2 days, the target will be 14 extending to 14.5
A new buy entry should be safer above 11.5 with the stop loss below 11.1
For an immediate entry, the Stop loss below SL line at 10.8 should be considered.

All About the Flag Pattern (Beginner-Friendly)Hello everyone,
Today, I’ve prepared an educational guide on chart patterns, specifically focusing on the Flag Pattern.
This content is designed to be easy for beginners to follow, so I hope you find it engaging and informative. :)
Below is the outline I’ll be using for this post:
————
✔️ Outline
1. What is a Flag Pattern?
Definition
Key Components
Characteristics
2. Bullish Flag Pattern
Basic Characteristics
Examples
3. Bearish Flag Pattern
Basic Characteristics
Examples
————
1. What is a Flag Pattern?
1) Definition
A Flag Pattern forms during a brief consolidation phase after a strong price movement, often signaling the continuation of a trend. It typically appears when prices make a sharp move, either up or down, followed by a period of sideways or slightly counter-trend movement.
Flag Patterns can occur in both uptrends and downtrends, named for their resemblance to an actual flag. After a strong price move, the market consolidates briefly before continuing in the original trend direction.
2) Key Components
Flagpole: The initial strong price movement that sets the overall trend direction before the consolidation phase.
Flag: The consolidation period where prices move sideways or slightly counter to the trend, often forming a rectangle or parallelogram. This phase typically occurs with a decrease in trading volume.
Breakout: The moment when the price resumes its original trend direction. In an uptrend, this is an upward breakout, and in a downtrend, a downward breakout, confirming the continuation of the trend.
3) Characteristics
Duration: The Flag Pattern typically lasts longer than the Flagpole but varies depending on the timeframe.
Volume: Volume usually decreases during the Flag’s formation and increases once the breakout occurs.
Reliability: The Flag Pattern is considered a reliable indicator of trend continuation, making it a favorite among traders using trend-based strategies.
————
2. Bullish Flag Pattern
1) Basic Characteristics
A Bullish Flag forms after a strong upward price movement, signaling a temporary consolidation phase. During this consolidation, volume typically decreases, suggesting that the market is pausing rather than reversing. After this phase, the price often continues its upward trend, accompanied by an increase in volume. Bullish Flag Patterns also help relieve overbought conditions in technical indicators, providing the market with a chance to prepare for another move up.
2-1) Example 1
This chart from May 2023 shows a strong Flagpole followed by a long consolidation phase (Flag). The volume then increased as the price broke out, completing the Bullish Flag Pattern.
2-2) Example 2
In this chart from March 2021, we see a similar setup: a strong Flagpole, followed by a consolidation phase, leading to a breakout that continued the upward trend.
————
3. Bearish Flag Pattern
1) Basic Characteristics
The Bearish Flag Pattern is the inverse of the Bullish Flag. It follows a strong downward move (Flagpole) and is followed by a period of consolidation (Flag) with decreasing volume. Like its bullish counterpart, the Bearish Flag can relieve oversold conditions, leading to a continuation of the downtrend after a breakout.
2-1) Example 1
This chart from May 2022 displays a Bearish Flag Pattern: a strong downward Flagpole, followed by a Flag consolidation phase. After the consolidation, a breakout occurred, continuing the downtrend.
2-2) Example 2
This chart from February 2022 also illustrates a strong downward Flagpole, followed by a consolidation phase (Flag), leading to a breakout that completed the Bearish Flag Pattern.
This guide will help you better understand the Flag Pattern and how it can be used in your trading strategy effectively!
————
✔️ Conclusion
I hope the various Flag Patterns and market analysis techniques covered in this post prove helpful in your investment journey. Chart analysis is not merely a technical skill but also a deeper understanding of market psychology and movement. Flag Patterns, along with other chart patterns, visually reflect the psychological dynamics of the market. Mastering their use can greatly contribute to successful trading.
That being said, the crypto market is inherently unpredictable and fast-moving. While technical analysis is a valuable tool, it’s important to adopt a comprehensive approach that considers broader market trends and external factors. I encourage you to apply the insights gained from this post with a balanced and cautious perspective when making investment decisions.
New opportunities are constantly emerging, and those who are prepared to seize them will find success. The chart represents the market’s voice. Listening to it, interpreting it, and making informed decisions based on that interpretation is "the essence" of chart analysis.
I sincerely hope that, through continuous learning and experience, you’ll evolve into a more confident and successful investor.

FET - Flag pattern - Waiting on Breakout - Daily ChartBINANCE:FETUSDT (1D CHART) Technical Analysis Update
FET is currently trading at $2.6813 and showing overall bullish sentiment
FET has formed a nice flag pattern and the price is waiting for breakout. IF the price breaks out then we have a good opportunity for long trade
Entry level: $ 3.01
Stop Loss Level: $ 2.04
TakeProfit 1: $ 3.73
TakeProfit 2: $ 4.4
TakeProfit 3: $ 5.7
TakeProfit 4: $ 6.8
TakeProfit 5: $ 8.6
Max Leverage: 2x
Don't forget to keep stop loss.
Follow Our TradingView Account for More Technical Analysis Updates, | Like, Share and Comment Your thoughts.
Cheers
GreenCrypto

BINANCE:DUSK/USDT - Flag Pattern Formed---------------------------------------------------------------
Description
---------------------------------------------------------------
+ DUSK just formed a nice flag pattern
+ Once flag breakout we can enter a trade.
+ This pattern has high accuracy so you can confidently enter the trade.
---------------------------------------------------------------
VectorAlgo Trade Details
------------------------------
Entry Price: 0.2783
Stop Loss: 0.2402
------------------------------
Targets 1: 0.2943
Targets 2: 0.3124
Targets 3: 0.3390
Targets 4:0.3764
------------------------------
Timeframe: 4H
Capital: 1-2% of trading capital
Leverage: 5-10x
---------------------------------------------------------------
Note: Enhance, Trade, Grow
---------------------------------------------------------------
Agree or Disagree with the ideas ? lets discuss in the comments.
Like and follow us for more ideas.
Regards
VectorAlgo

EURUSD Bearish Flag PatternThe EURUSD broke through the upward trendline at the end of last year, due to USD strength. This downward move saw the formation of a bearish flag pattern during the first half of January.
The EURUSD has now broken the channel and the support level (61.8% Fibonacci retracement level) to signal a bearish continuation.
The target level could be the next support level at 1.0745

🔥 Bitcoin Break Out! 2024 Starts Off AMAZING 🚀Over the last couple of weeks I've been posting a lot of analyses on Bitcoin's bull-flag pattern. My expectation was always that the price would break out through the top resistance, with a target of 48k.
As of this morning, BTC has rallied hard on bullish ETF news. The break out is strong with a lot of volume, so 48,000$ seems imminent at this point.
Why 48k you ask? Well, it's the strongest resistance area before the all-time high. If the bears will fail to defend 48k, chances are were going straight to new all-time highs. For now I'm bullish untill 48k, neutral at 48k, and bullish again if we manage to break through 48k.
To all patient bulls: congratulations. The trend is your friend. But be wary, the bears might be lurking at 48k.

What is the ( Flag pattern) ?A flag pattern is a technical analysis chart pattern that can be observed in the price charts of financial assets, such as stocks, currencies, or commodities. It is considered a continuation pattern, indicating that the prevailing trend is likely to continue after a brief consolidation or pause.
The flag pattern is formed by two main components:
Flagpole : The first part of the pattern is a strong and sharp price movement, either upward (bullish flag) or downward (bearish flag). This initial move is known as the flagpole and represents a strong surge in buying or selling activity.
Flag : Following the flagpole, there is a period of consolidation where prices move in a rectangular or parallelogram-shaped pattern. This consolidation phase is referred to as the flag. The flag is characterized by decreasing volatility and typically forms a channel or a rectangle.
There are two types of flag patterns:
Bullish Flag: The flagpole is an upward price movement, and the flag is a downward-sloping consolidation. This pattern suggests a temporary pause in the upward trend before a potential continuation.
Bearish Flag: The flagpole is a downward price movement, and the flag is an upward-sloping consolidation. This pattern indicates a temporary pause in the downward trend before a potential continuation.
Traders often look for flag patterns as they may provide insights into the market sentiment and offer potential trading opportunities. The breakout direction (up or down) from the flag pattern is considered a signal for the potential future price movement. However, it's important to note that not all flags result in a continuation of the previous trend, and traders often use other technical indicators and analysis to confirm signals and manage risk.


SILVER Will Go Down! Sell!
Hello,Traders!
SILVER broke out of
The bearish flag pattern
While trading in a local
Downtrend so I will be
Expecting bearish continuation
Sell!
Like, comment and subscribe to help us grow!
Check out other forecasts below too!

Bearish and Bullish Flag Chart PatternsFlag Pattern:
A flag is a chart pattern formed during a counter-trend move after a sharp price movement.
Why is it called Flag?
It is named because of the way it reminds the viewer of a flag on a flagpole.
What does the Flag Pattern represent?
It signifies trend reversals or breakouts after a period of consolidation.
The five main characteristics of a Flag Pattern are:
1. The preceding trend
2. The consolidation channel
3. The volume pattern
4. A breakout
5. A confirmation occurs when the price moves in the same direction as the breakout.
How to identify the Flag Pattern:
The most important part of the flag pattern is to identify a strong trend (in either direction, as the flag may be inverted, triggering a bearish move!). Take a look at the higher time frames when you find a flag pole to ensure the price is not simply ranging. It could be meeting a large area of resistance!
Bullish Flag Pattern:
When the prices are in an uptrend, a bullish flag pattern shows a slow consolidation lower after an aggressive uptrend. This indicates that there is more buying pressure moving the prices up than down and indicates that the momentum will continue in an uptrend.
Traders wait for the price to break above the resistance of the consolidation after this pattern is formed to enter a long position.
The breakout indicates that the prior uptrend will continue.
Example of a Bullish Flag Pattern:
Bearish Flag Pattern:
When the prices are in a downtrend, a bearish flag pattern shows a slow consolidation higher after an aggressive downtrend. This indicates that there is more selling pressure moving the prices down than up and indicates that the momentum will continue in a downtrend.
Traders wait for the price to break below the support of the consolidation after this pattern is formed to enter a short position.
Example of a Bearish Flag Pattern:
Conclusion:
A flag pattern is a type of chart continuation pattern that shows candlesticks contained in a small parallelogram. When the prices are in an uptrend, a bullish pattern shows a slow consolidation lower after an aggressive uptrend. When the prices are in a downtrend, a bearish pattern shows a slow consolidation higher after an aggressive downtrend. It is formed when there is an increase in demand or supply that causes the prices to move up or down.
May you all be PROFITABLE,

USDCAD - Continuation of bullish trend Hi Traders, lets take a look at USDCAD on the H4. We have price breaking out of the correction phase and also taking out the LH which indicates a change of character .We are expecting a push to 1.38070 level

Channel continuation or Trading Range?Market's atmosphere is good and we can have more upward movements in coming days.
If it is fail , it is more likely to have some trading ranges after a little correction for a few days!
Strong Bearish Bo at current point will increase the chance of falling down!
Do not enter until it is completely clear for you!!

BULL FLAG IN MATIC !!Just I Saw a Bull Flag In the MATIC Coin, Which is a Continuation Pattern, the trend of MATIC is Bullish right now which means, if MATIC breaks the Flag's vertical Resistance it will pump very quickly.
Your TARGET should be at $0.9700 and your Stop loss should be at $0.8942, which is the flag's Bottom.
Thanks for reading carefully, please follow me and write your thoughts.

EURGBP - Bullish expectationEURGBP can trade at 0.86905 looking at the current pattern that has been presented

AUDJPY Gonna Down SELL !After a Flag Pattern I think price will go Down From Resistance
Wait And SELL
Hope Luck For you All


Bearish Flag pattern in tata power The bearish flag pattern found in tata power waiting for break down....
Trade with proper stoploss
Target 1 and 2 are given as per analysis


GOLD - bearish by next weekNoticed an bearish Abcde pattern until it goes long again. I expect it to hit the 50% fib before it goes bearish again.

#SQ Bull Flag SetupSquare has been hit really hard lately but the good thing is the chart has painted for us a really nice Bullish Flag setup to add to our watchlists for a reversal or a breakout to jump in with shares or for my option traders like myself a good call setup, i'm looking at the FLOW on Unusual Whales closely to see when to jump in exactly Especially now that Jack Dorsey has stated this will be his main focus moving forward it paints good picture for the outlook of SQ.
