LTC/USDT - Bearish move expcted!i am expecting large bearish move in ltc from 95$
target will be 90$ - 88$ - 82$
sl at 97.6 almost 2% stoploss and 13% target
FLAG

GBPJPY FLAG BREAOUTThe price of GBPJPY has a breakout below the flag, and also has the potential for a bullish butterfly pattern.
This is a good trade opportunity to take.
Trade with care.
I will update at here if the trade opportunity is given.
Do follow and boost if you found this idea helps.

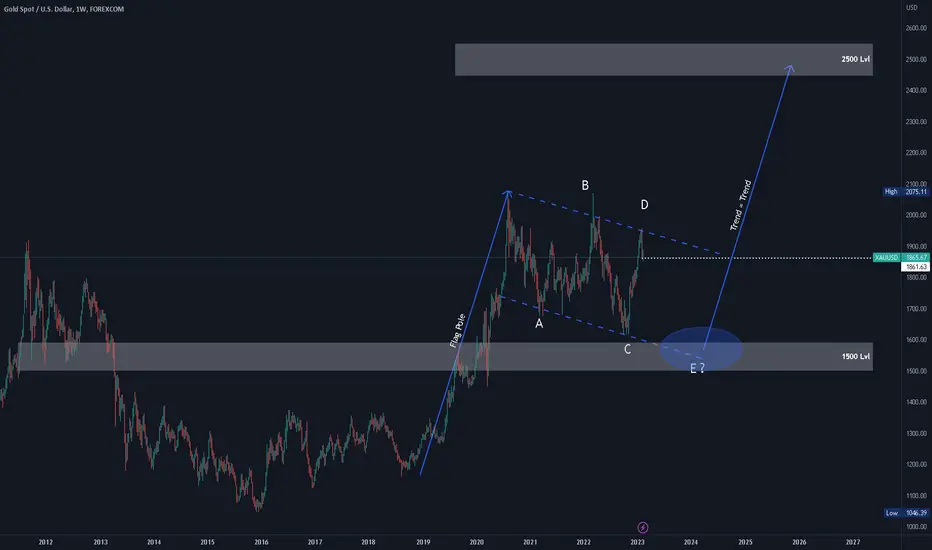
Gold - Massive flag on the makingGold is drawing a massive Flag, that could see it go all the way to 1500. After it went to 2050 and gat rejected two times in the recent years, the D point retraced to 1950, the 78.6% fib level, which isn't uncommun for gold as it likes to retrace deep. The 1500 level drawn on the chart is also the 50-61.8% Fib level of the uptrend that made up the flagpole. Looks like in the textbooks init? what you guys think??
✅EUR_USD WILL GO DOWN|SHORT🔥
✅EUR_USD broke out of the
Bearish flag pattern so we
Are bearish biased and
I think we will see
A further move down
SHORT🔥
✅Like and subscribe to never miss a new idea!✅

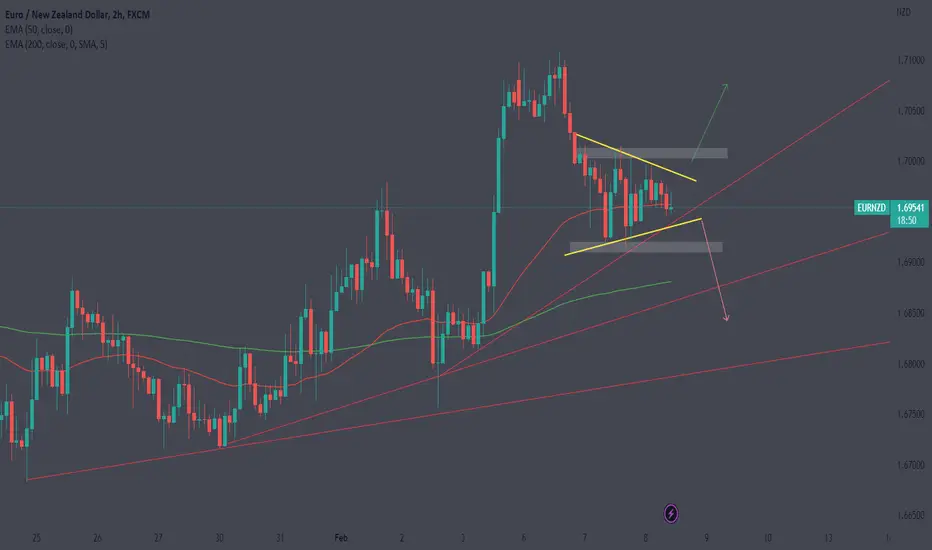
EURNZDEURNZD - A break to either direction
Pennant/ Inverse Cup & Handle / Bear flag - Whatever is on your trade plan...
It's a break above Highs of: 1.70115 It would take you towards 1.70725
A break below the lows of: 1.69170 it would take you towards 1.68560
Ideally wait for the break for further confluence. However, be sure to stick to your own trade plan.
Trade Journal

✅GOLD WAIT FOR BREAKOUT|SHORT🔥
✅GOLD is going down now
And the pair has formed
A bearish flag pattern
Which makes me bearish biased
And after the breakout
I believe we will see bearish continuation
SHORT🔥
✅Like and subscribe to never miss a new idea!✅

VRA making Bull flag?hey hey
rebuilding VRA while still in a bull flag.
new entry: 0.0058, 0.0061, 0.0063, 0.0067
TP=?
SL= 5x no SL, liq. 7% on 10x
lets see!
de

Bearish FlagCAdJPY is retesting its resistance wait for the perfect entry with proper risk and money management

Bull flag Bull flag of GBPAUD has broke out and retesting we can enter in long position according to risk management and Money management

AVAX FLAG!KUCOIN:AVAXUSDT
AVAX has broken the falling wedge and sitting in a Flag with potential targets to 72%
Possible entry on retest of "Breakout" and "Possible Pullback" levels.
As usual, Bitcoin drags the altcoins around.
If you liked this idea or if you have your own opinion about it, write in the comments.
The information and publications are not meant to be, and do not constitute, financial, investment, trading, or other types of advice or recommendations.

gbpchf short trade after price has closed impulsively outsideshort positions activated after price has closed outside the flag

Bitcoin surprise moveIt might not make much sense in the current mood because the majority of market participants expect either more downside or sideways price action for the next 12/18 months, but I feel the real surprise would be an upside move.
A strong move, forcing the many in disbelief to rush in mid-to-late on the way to an early top somewhere in the low 6 figures range.
I give this idea a 60% confidence rate.

GBPAUD D1 (BUY) Bullish Continuation Price action is shaping up for an bullish run as sellers failed to push any lower at the bottom of a HTF expanding structure, creating a reversal impulse followed by continuation.
I expect more growth on this pair, we can potentially see price make its way back up to upper boundary of channel, mid 1.8300 range for a high probability set up.
Find an entry that meets your trading plan.
Trade Safe
Thanks

AXS/USDT - (LOOKING BEARISH)axs/usd looking bearish technically
iam taking trade in axs at the price of 11.60$
chart patterns
harmonic patterns

AXS/USDT (Looking bullish)axs usdt technically looking bullish
my buy zone is 11.4$
stoploss 11.15$ - 2.4%
target 13$ - 15%

EURAUD STILL TO CONTINUE ITS BEARISH MOVEOn the daily timeframe price have seemed to show that EURAUD is on a bearish move, and on this 4h timeframe, we can note that price just broke a strong support zone and I expect price to make a retracement to the resistance zone for a sell to 1.52550 zone.
This is what I expect on this pair.
Please do share and give a follow if you agree to the setup.

HBAR Bull FlagHBAR is flagging on the 12 hour. Also you can go to lower timeframes and see it as well. This however is more obvious. Looking for new highs soon.

PVE Flag BreakoutLevel 2 has like nothing on the sell side. I Took the final offered at 7.3 (probably a lot of re stacking to come) with a SL at 6.6

$CHF $CHF - A break to either direction
We are within this channel, you could say flag/pennant pattern a break to either direction!
Break above 50 EMA expect 200 EMA TP
Break below .91 half areas expect that spike low TP
Have a great day ahead!
Trade Journal

US100 Potential buyI have been trading US100 off this flag pattern for a few days. We currently have not broken this pattern so if we get a bullish 1hr stick off this pattern, we could go up again. Also the next zone is at 11756.7, So I am expecting price to reach there at some point...Lets be patient and see how this 1hr ends.
Also from last week, I also showed the uptrend on the weekly and daily chart, So I am expecting overall buys in this market

$CAD - Patience $CAD - Interesting...
At this current moment of time we are in a range but - Pattern forming of Flag a break to downside of these ranges to confirm taking CAD towards 1.32/1.31 areas. Good R/R -However, if we break above the TL above 200 EMA would be your target.
Follow your own trade plan.
Trade Journal

💡 Don't miss the great Buy opportunity in USDJPYHello my dears
It seems that we are witnessing the formation of a Flag pattern in the USDJPY chart. I think the possibility that the price will break above the Flag of the chart is very high. What do you think?
If you liked my analysis, please support me with comments and likes.
