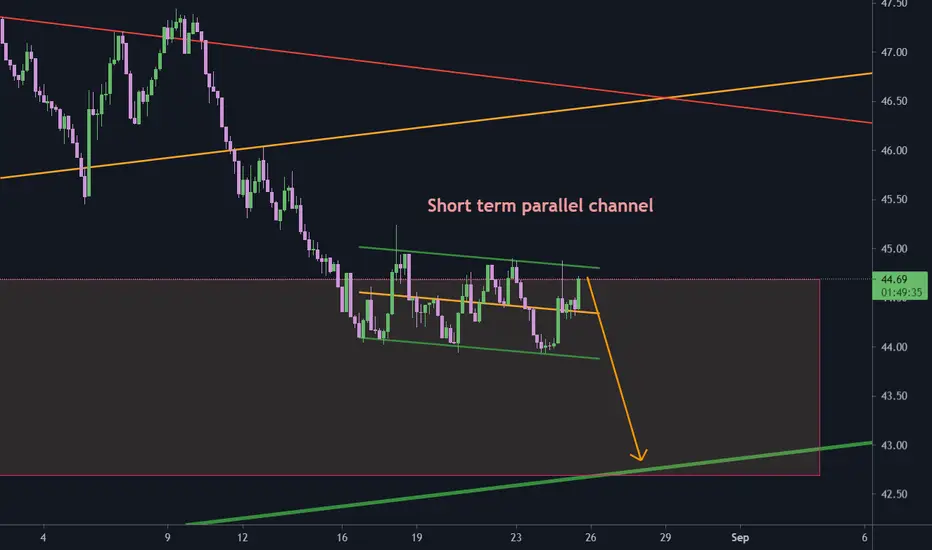
POTENTIAL SHORT TERM DROP ON UJLooking to enter this swing trade anticipating a short move downwards. Set your pending sell orders with good risk management. This will surely turn out to be a profitable trade
FLAG

Litecoin breakoutBull flag, bullish divergence on lower TFs, STC to cross from the oversold
Limit buy @ 216.5
SL: 209.5
TP1: 226
TP2: 240
DISCLAIMER: not a financial advice, just personal perspective

XLMUSDT flag or trianglea we have flag in 4h XLM ,if we break out of pattern, XLM rise up. teh other dea is that pattern change to a triangle, so XLM going down and then coming back to break the uper line


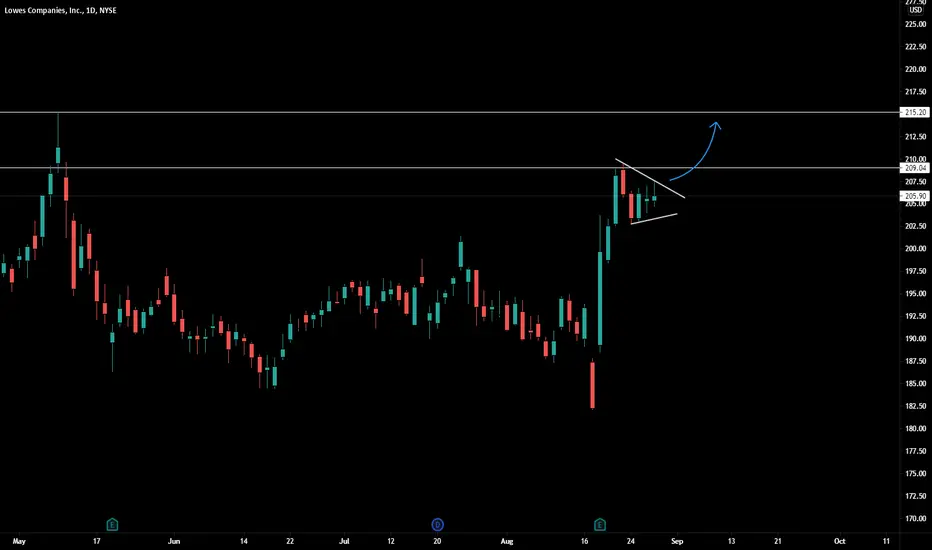
LOW flaggingNice symmetrical triangle / flag forming after a crazy few days last week.
It has very strong resistance above ( 209 and 215.20)
However if we break the triangle, we might see a strong push towards ATH


EURCHF 31 August 2021Waiting for confirmation for EURCHF to break the bullish flag pattern.
When pattern break. Then we are looking for prices to go up as targeted.
Manage your own risk.
Disclaimer: This content is intended to be used and must be used for information and education purposes only. It is very important to do your own analysis before making any investment based on your own personal circumstances. Accordingly, the writer will not be liable in respect of any damage, expense, or other loss you may suffer arising out of such information or any reliance you may place upon such information.


How to use trendline to identify price action structure/patternHi everyone:
Many have asked me about how to properly use trendlines to identify price action structures and patterns. So in today’s educational video, I will go over this topic in more detail.
First, I use the trendline as a “frame” to identify structures and patterns, and NOT use it as a Support/Resistance.
What I do is to put in the trendline for the highs and lows of the price action that can help me to pinpoint what the price is doing, what kind of a correctional structure that it is currently in.
Typically after an impulse phase of the market, then we start to identify a structure/pattern by connecting the swing highs and lows.
Second, as I always point out in my videos/streams, a structure/pattern needs at least 2 swing highs and lows to classify as a structure.
Certainly more swing highs and lows are good, but it's not necessary. Often I get asked about the “third touch” or more. To me it's not necessary, but if price does form the third touch, I would proceed the same as the price has a second touch.
Third, we are identifying the price action correctional structure, and sometimes the market is not perfect, it will not give you a textbook looking bullish flag as an example.
Hence the backtesting and chartwork from each trader is important to get your mind familiarized with the market and its “imperfect” development of the price action.
After identifying the impulse phase, then look to see what the market is doing. Is it falling into a consolidation ?
Not much movement except sideway price action, or ascending/descending like consolidation will give you a clue on whether the price is correcting to continue, or correcting to reverse.
Take a look at the educational videos I have made in the past regarding the type of correctional structures we typically see in the market. All the videos are down below.
Continue to backtest and do chart work to get familiar with drawing in the structures/patterns. The more you do these, the better and easier it is for you to identify them in your trading journey.
Remember, the market is not perfect, so not all the structures/patterns will be “Textbook” like on the real, live market. Learn to deal with the “imperfect” market, so you can better utilize price action analysis to your advantage.
Any questions, comments or feedback welcome to let me know :)
Thank you
Below are all my price action structures/patterns videos on different type of corrections.
Continuation and Reversal Correction
Identify a correction for the next impulse move in price action analysis
Impulse VS Correction
Multi-time frame analysis
Continuation Bull/Bear Flag
Parallel Channel (Horizontal, Ascending, Descending)
Reversal Ascending/Descending Channel
Reversal Rising/Falling Wedge
Reversal Double Top/Bottom
Reversal Head & Shoulder Pattern
Reversal “M” and “W” style pattern
Reversal Impulse Price Action
Continuation/Reversal Expanding Structure/Pattern

SQ Nice setupIt seems that we are forming a descending channel,
We broke out of a larger time frame descending channel and now it seems it is setting up for another leg to the upside after the restest
I want to see how it is going to act at 270.50 level, with 274.20 target

Watching closely- Bull Flag Watching JWN closely here especially with the expected acquisition news- Personally am bullish and will be watching closely for a breakout (Broader Market Conditions Permitting). Just some FIB levels and RSI-based supply and demand zones to keep an eye on-
- Possible cup & handle forming
- Bull-flag on JWN's yearly chart
- Gap to fill on the upside

USD-CHF Small Short! Sell!
Hello,Traders!
USD-CHF is trading below a falling local resistance
While forming a small bear flag pattern
Which makes me locally bearish
And I think we will see a retest of the support below
Sell!
Like, comment and subscribe to boost your trading!
See other ideas below too!

DRAFT KINGS FLAG AND POLE Hello fellow traders .. I hope you all enjoying this bull run ..
Back with. DKNG flag and pole again ..
Self explanatory .. good 40% upside target
Stop loss at the flag resistence line .. small position size ..
Happy trading

BTCD flag for continuation of down trend#BTCD
bitcoin dominance is near upper line of parallel channel, that I consider it as a flag for more down trend.
correction is healthy for trends.
COS/USDT 4 HOUR RESISTANCEsupply had a good resting time and gather the power, now is the time to rise again.

Short 💥 Bearish FlagOur AI sees an upwards channel (red dots) on the BNB/USDT chart.
Upwards channels are usually bearish flags that break downwards (red arrow).
See our Target Price (TP - green area), Stop Loss (SL - orange area), Entry Price (EP - Pink area).

EUR-CAD Will Go UP! Buy!
Hello,Traders!
EUR-CAD has retested a local support level
While trading in a bullish flag
And now the pair broke out of this flag
Which means that the price will move up
With the final target being the local resistance above
Buy!
Like, comment and subscribe to boost your trading!
See other ideas below too!

ADAUSD bull flag consolidation continued Now that there was an initial push upward through the channel, you should expect a pullback and further consolidation which I have mentioned on the chart. I expect it to pullback and consolidate before the announcement of when the smart contracts go live. The announcement should be on Friday 8/20. I expect the price to push up further after the announcement and confirm the upward trend. You can see that the price has already pushed past the lower highs (the green lines). Friday should confirm or deny the upward trend for ADA.
This is not financial advice.

57,666 TARGET for BTC/USD!. WATCH IF THIS PLAYs OUT.We forming a large bull flag. there are two posibilities... a Head and Shoulder froming and retest on the braodening wedge support or a stright forward bullflag with a target of 57,666!!!

USDCAD ShortI will like to see price develop more, looking to enter a short position once I get a bearish flag confirmation.

BNTX original breakout Trades that will make you money. The BNTX charts gave us a beautiful tight range and BOOM! Made two moves from flags - 100% each.

✅EUR_NZD BEAR FLAG|SHORT🔥
✅EUR_NZD is trading in a downtrend
And we can see that the pair broke out
Of the massive bear flag pattern
In which it was trading for half a year
Now, the price is retesting the broken support
Which now became resistance, entering a supply zone
From where I am expecting bearish continuation
SHORT🔥
✅Like and subscribe to never miss a new idea!✅
