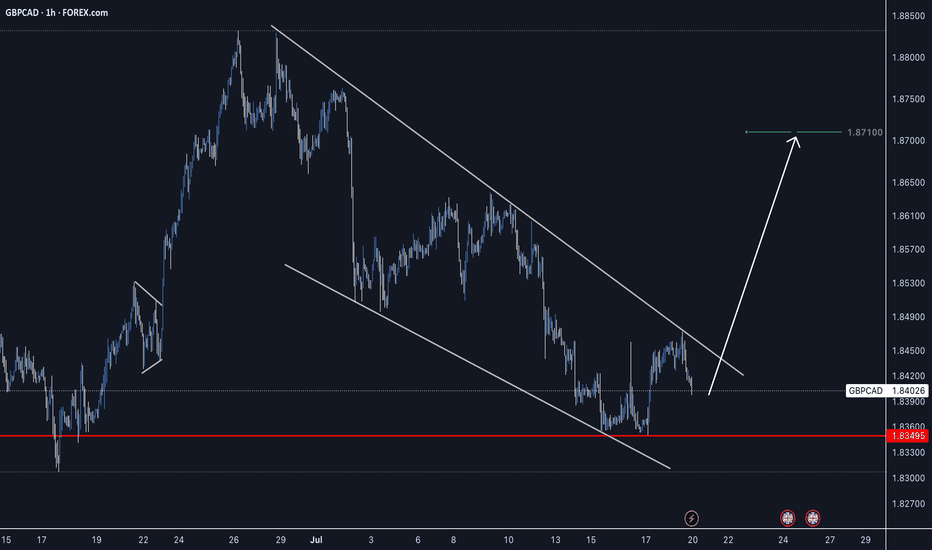
Flagbullish
QBTS bull flag dailyBetter look at quantum computing ticker QBTS bull flag on the daily timeframe. Previous post looked at the weekly timeframe to highlight the bullish momentum. Lots of retail money piled into this one in the last few months, a breakout of this bull flag will likely be followed by a parabolic move.
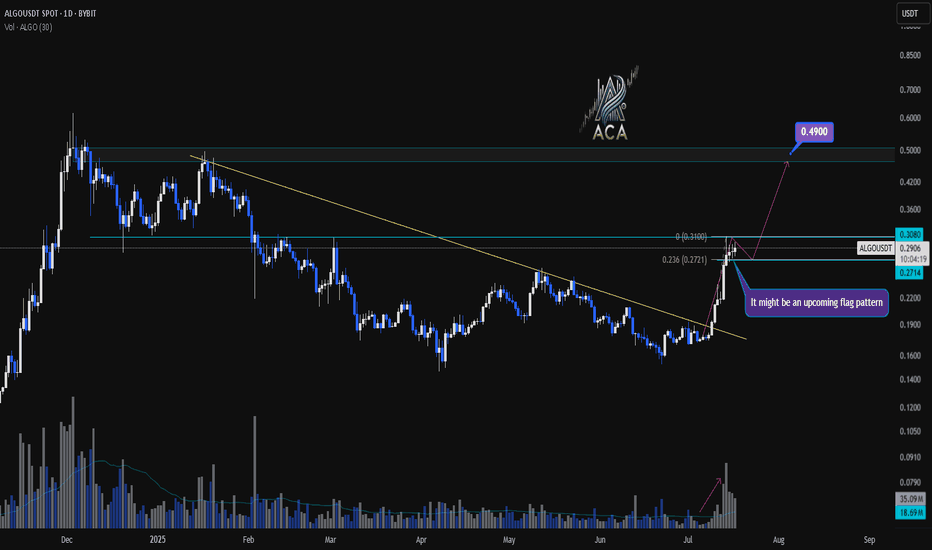
ALGOUSDT Daily Chart Analysis | Continuational patternsALGOUSDT Daily Chart Analysis | Momentum Picks Up on Higher Timeframe
🔍 Let’s break down the latest ALGO/USDT daily chart, highlighting a shift in market structure and key bullish signals.
⏳ Daily Overview
A decisive breakout above the long-standing descending trendline has flipped the narrative for ALGOUSDT. Increased volume during the breakout points to robust bullish momentum, suggesting buyers are regaining control at this multi-month inflection point.
🔔 Flag Pattern & Chart Structure
- Bullish flag pattern is emerging after the recent breakout, as price consolidates in a tight range—a classic continuation formation.
- Former trendline resistance is now acting as support, confirming a notable shift on the higher timeframe.
📐 Fibonacci & Target Levels
- The 0.236 Fibonacci retracement at $0.2771 is providing immediate support, with price consolidating above this anchor level.
- Upside targets:
- First resistance at $0.3080, which aligns with horizontal supply and previous pivot highs.
- If the flag pattern resolves upward, the next Fibonacci extension points to $0.4900, marking a significant confluence and potential for further gains.
📊 Key Highlights
- Strong daily candle and surging volume confirm momentum shift.
- Watch the developing flag pattern for breakout confirmation.
- Major trendline break on the daily signals structural reversal.
- $0.3080 is the immediate target; $0.4900 is the extended objective from the flag/Fibonacci alignment.
🚨 Conclusion
ALGOUSDT is setting up a compelling bullish scenario—keep a close eye on price behavior at the flag and $0.3080 level. A breakout may trigger the next impulsive move toward $0.4900.
SMCI - Bull Flag Breakout SetupSMCI formed a strong bullish impulse followed by a bull flag pattern.
A breakout above the flag structure may signal continuation if confirmed with strong price action.
Trade Plan:
• Entry: On breakout or retest
• Stop Loss: Below flag support
• TP1: Recent high
• TP2: Measured flagpole extension
This setup is worth monitoring for potential bullish continuation.
Disclaimer: This is not financial advice. For educational purposes only.
How to Spot Flag Patterns on TradingViewLearn to identify and trade flag patterns in TradingView with this step-by-step tutorial from Optimus Futures. Flag patterns are continuation formations that help traders join existing trends by buying high and selling higher, or selling low and buying back lower.
What You'll Learn:
• How to identify bullish and bearish flag patterns on any timeframe
• Breaking down flag patterns into two parts: the flagpole and the flag
• Finding strong flagpole formations with fast, obvious price moves
• Spotting flag consolidation areas that form tight ranges
• Why flag patterns work: buyer and seller psychology explained
• Real chart examples showing how flag patterns develop and play out
This tutorial may help futures traders and technical analysts who want to trade with market trends rather than against them. The concepts covered could assist you in identifying opportunities to join strong price movements when they pause before continuing.
Learn more about futures trading with Tradingview: optimusfutures.com
Disclaimer:
There is a substantial risk of loss in futures trading. Past performance is not indicative of future results. Please trade only with risk capital. We are not responsible for any third-party links, comments, or content shared on TradingView. Any opinions, links, or messages posted by users on TradingView do not represent our views or recommendations. Please exercise your own judgment and due diligence when engaging with any external content or user commentary.
This video represents the opinion of Optimus Futures and is intended for educational purposes only. Chart interpretations are presented solely to illustrate objective technical concepts and should not be viewed as predictive of future market behavior. In our opinion, charts are analytical tools—not forecasting instruments. Market conditions are constantly evolving, and all trading decisions should be made independently, with careful consideration of individual risk tolerance and financial objectives.
Gold Trade Setup – Bullish Flag Pattern🧠 Gold Trade Setup – Bullish Flag Pattern
📍 Pattern: Bullish Flag
📉 EMA 50: Acting as dynamic support
💰 Current Price: $3,333
📈 Bias: Bullish continuation
🟢 Trade Plan: Long Position
🔼 Entry: Around $3,333 (confirmed breakout from flag)
🎯 Target: $3,365
🛑 Stop Loss: $3,323
📊 Risk–Reward Ratio: ~1:3.2 → favorable setup
🔍 This Works:
Price breaks out of a bullish flag, a strong continuation pattern.
EMA 50 supports the trend, confirming momentum.
Room to run up to $3,365 resistance zone if momentum holds.
HDFC AMC – Bullish Flag Formation on Daily ChartHDFC AMC is currently exhibiting a bullish flag formation, a classic continuation pattern following a strong vertical rally. The recent price action is consolidating within a downward-sloping channel, typically seen as a pause before the next leg up.
Key Technical Levels:
Flag upper boundary (first resistance): Around ₹4,400
Flag high / prior resistance: ₹4,583.65
All-time high: ₹4,867.00
A breakout above the flag’s upper line could signal fresh buying momentum with the potential to first retest the flag high and possibly challenge the all-time high if the breakout sustains.
Fundamentals Snapshot:
Dividend Yield: 1.64%
ROCE: 43.3%
ROE: 32.4%
PE Ratio: 37.09 (vs Industry PE of 20.70)
Growth Metrics:
Compounded Sales Growth:
10 Years: 13%
Compounded Profit Growth:
10 Years: 19%
Stock Price CAGR:
5 Years: 10%
This combination of strong technical setup and solid financial performance suggests HDFC AMC remains a strong contender in the asset management space.
Recent escalations along the India-Pakistan border have led to military confrontations, increasing uncertainty in the broader market. If tensions worsen, volatility may rise, and market sentiment could turn risk-off, impacting financial market. Traders should stay alert for any escalation news.
Disclaimer:
This post is for educational purposes only and is not financial advice. Please do your own research or consult a financial advisor before making any investment decisions. Market conditions and geopolitical developments can change rapidly.
Compound 200% very soonHello dear readers!
Another quick one for you. Compound has been around for a while and has seen a massive retrace of around 73%.
There are now reasons to be bullish for the short term.
When we look at the charts we can see a bullflag breakout (fierce) and retest of the upper bound. Its on a hard support also. Any sellers have dried out, and the only way is up.
Target minimum: 132
Stoploss: you can pick
~Rustle
Orbs to provide a 20x?Welcome back dearest reader!
Today we will analyse another project called Orbs. Looking at their website the fundamentals look great! But other than that, the chart also looks fantastic!
When looking at past performance its clear orbs has been in a massive flag formation since march 2021, it has broken out in october 2023 and has just now touched a very important support zone! Expecting upside momentum from here untill august.
Target: 0.40$
Stoploss: 0.0145$
$LMND lagger in fintech, upside potential, EMA SMA crossingNYSE:LMND I'm a fan of financials, NYSE:MA , NYSE:V , NYSE:DFS , NASDAQ:PYPL , NASDAQ:AFRM , etc, even look at $SEZL. I think this name is a laggard in the sector and actually provides a good idea of business, something oversaturated but a different approach and ideas. With momentum and volume this name can trigger great upside potential in the next 3-6 months. Earnings are there and I look the setup here inside the triangle/flag. Long.
Also the 200ema and 200sma are riding nicely and the 50ema and 50sma are crossing over one another.
WSL
ADA can Increase a lot!BINANCE:ADAUSDT
cardano is creating a massive Flag pattern! which is a bullish pattern!👍
the Price will increase as much as the FlagPole ! that would mean the price would increase up to 1.9$😍
Note:No break out,No Bullish movement!
⚠️ Disclaimer:
This is not financial advice. Always manage your risks and trade responsibly.
👉 Follow me for daily updates,
💬 Comment and like to share your thoughts,
📌 And check the link in my bio for even more resources!
Let’s navigate the markets together—join the journey today! 💹✨
XAUUSD BULLISH PATTERN CHARTHEY,
all my trader friends if you see m30 there is strong support at 2895 to 2899 so posible to gold fall and retest the area of this level and pull back to 2915.
if powell speaks is good for currency that time so we see gold fall wanna gold again buy from 2895.
BUY scenerio target 2916 this position all trader booked their 50% profit and half for continue to 2940
Big XRP bullish move formingBYBIT:XRPUSDT has formed a (remarkably equaliteral) triangle flag pattern since breaking out of the parallel channel flag*. Given the previous 25% move upwards (i.e. the flagpole), text book technical analysis theory states that there is another upwards move imminent. This is a good opportunity for a medium term (approx. one month long) bullish swing trade.
A few things to note:
*The breakout move from the parallel flag channel was a text book move upwards where it moved outside of the channel (breakout move), then returned back to the resistance line of the parallel channel, which became support, and then continued the move upwards. This provided a very good entry opportunity upon the return move once the daily candlestick showed proved that resistance line is a now a line of support (i.e. the candlestick is of a dragonfly shape) - you enter on the dragonfly share confirmation
The triangle flag pattern is running out of room. i.e. the move is expected to come soon (this coming week) as the candlesticks are getting smaller and smaller in size, following, broadly speaking, the triangles lines of support and resistance, and there are not many days left until the candlesticks will naturally move out of the triangle.
The market psychology behind this is that the buyers who made a profit on the recent flagpole are now selling, with newer, bullish buyers entering the market. The price which the sellers are willing to sell and and buyers willing to purchase at is getting closer and closer, which usually means the continuation of the trend as there are more buyers (in this case) than sellers (i.e. people are willing to buy at a price closer and closer to the sellers ask price and sellers don't have to drop their prices as much to entire people to buy)
This is consistent with the optimistic and bullish sentiment for the economy in generally, stock market and crypto since Trump's election victory with Trump having recently announced that he would prefer lower interest rates i.e. The chart formation is showing that there are still more bulls than bears.
Risk to this move are that the RSI is overbought (which in this case can be ignored as it has been overbought for a few months and the nature of the indicator is that in a bullish market it remains at an overbought level regularly) and that the crypto market is prone to large gyrations on rumours and even minor US governmental policy announcements.
Technical Analysis on Visa (V)Visa's stock ( V ) shows a clear long-term uptrend.
Following a decline in 2022, it regained its 2021 highs in early 2024, breaking through resistance and continuing its upward trend.
The stock reached new highs around the $290 area, then retraced, forming a bullish flag pattern, down to a support area near $250.
Currently, it is testing the highs again in the $290 area, reached via a gap up after positive earnings and revenue announcements. If it confirms a breakout above resistance, with a potential retest, the stock could continue its bullish trend.


