Bitcoin Breaking Downtrend ChannelBitcoin is currently Bullish as it is breaking out of the daily downtrend channel in a big bullish candle.I think it will continue to 30k as the first target and then to 35k.Also there is a change of structure as it is breaking the previous lower highs and going higher.
This is not a financial advice.
Flagbullish

Now is completeHere it is a beautiful bullish flag, we will see bullish activity around this level, will be very interesting if fill the huge gap soon.

PRAJ INDUSTRIES FLAG WHICH RISE AGAIN flag pattern breakout on weekly chart pattern similar like my old script may be that took 3 to 6 month for breakout but when that range break that 395 share reached 600 double in any quarter non risky trade can wait for 350 risky trader can make entry now on 395 to 400 and if that go down so average on bottom that trade sure shot double in next recent time mark my words that perform well like my other script
PRAJ INDUSTRIES

4002_Cup and Hanlde Formation (Bullish)Classical Cup & Handle Formation
Series of HH, HL
SL and TPs are specified
Ride the trend with trailing stop loss
Manage Risk properly

GBPUSD I Possibly a break of the channel line +100 pipsWelcome back! Let me know your thoughts in the comments!
** GBPUSD Analysis - Listen to video!
We recommend that you keep this pair on your watchlist and enter when the entry criteria of your strategy is met.
Please support this idea with a LIKE and COMMENT if you find it useful and Click "Follow" on our profile if you'd like these trade ideas delivered straight to your email in the future.
Thanks for your continued support!

FLAG PATTERNas you can see there is a FLAG PATTERN forming in LORDS CHLORO ALKALI the possible upside according to the pattern is about 40% with 10% SL is a GOOD opportunity

NZDCAD...daily view-NZDCAD is runing in the phase of bullish flag patern after breaking the daily trend line.
-retest of the broken trend + minor daily demand level .
-expecting bouncing off that demand zone and the broken trend for more upward move.
-for long trade with good R/R ratio after confirmation of the signal using smaller time frames...be safe...

Bitcoin into Bullish Channal Flag #Bitcoin 4hr #TA at #KuCoin
After two consecutive #Bullish #FallingWedge, at present CRYPTOCAP:BTC movements under Bullish #ChannalFlag with next step forward towards $32k- BER:33K soon..
May be Next Downtrend starts after that in May-June..
Let's see, What's next market mood..

BITCOIN 1h Flag!BINANCE:BTCUSDT
Bitcoin sitting in a Bullish Flag.
Possible retest of 50MA providing re-entry ideas for further upside.
1h is quite low time frame so decision making is more rapid but have Plan A, Plan B scenarios.
Possible Short to support 28.8k zone on bearish retest of flag breakdown.
Possible Long once flag breaks for continued upside - for target ideas, please see yesterdays post: BITCOIN Massive Move!
Always having Plan A and Plan B scenarios so we can react once the markets provide an opportunity to execute our edge.
If you liked this idea or if you have your own opinion about it, write in the comments.
The information and publications are not meant to be, and do not constitute, financial, investment, trading, or other types of advice or recommendations.

📈ETH analysis above 1801 level📉BINANCE:ETHUSDT
COINBASE:ETHUSD
Hey everyone, first take a look at my previous analysis and positions.
For a long position, Ethereum needs to stay above 1800-01usdt.
Don't forget to risk-free your position.
Please share ideas and leave a comment,
let me know what's your idea.
CrazyS✌


📈BTC analysis above 28K resistance📉BINANCE:BTCUSDT
COINBASE:BTCUSD
Bitcoin analytical series S01E10
Hello, traders don't forget to risk-free your positions.
Long targets ----> super-trend resistance & 28875$
Please share ideas and leave a comment,
Let me know what's your idea.
CrazyS✌

BTC Bullish over small time-frame🔥BTC Bullish over small time frame (Scalping Trade)
As you can see theres is bullish flag pattern, breakout of Channel over upside and Taking entry at pullback with small Sl
Looks good trade to me as my R2R suits here lets see 🔥🔥🔥

APTUSDT LONG SIGNALSHello, friends. Nice to meet you.
Today, I'm going to share my perspective to show you the APT pattern.
I'm hoping for happy trading from my friends. Fighting!

US100 Price Breakout with Strong Support, But All Eyes on CPIThe US100, also known as the Nasdaq 100 index, has been making some significant moves recently that are worth keeping an eye on for traders. Specifically, there have been a few key levels that have been broken which are often seen as indicators of price momentum and potential future price movements.
One of these key levels is the 4-hour trendline. Trendlines are often used to help identify potential areas of support or resistance for a given security or index. When prices break above or below a trendline, it can signal a potential shift in price momentum. In this case, the US100 broke above a key 4-hour trendline, which is a bullish signal that suggests prices may continue to rise in the short term.
In addition to the trendline, the US100 also recently broke through a strong resistance zone. Resistance zones are areas where prices have struggled to break through in the past. When prices do finally break through a resistance zone, it can suggest a shift in market sentiment and a potential increase in buying pressure. In this case, the US100 broke through a key resistance zone and then retested that area as support, which is another bullish signal for traders.
However, despite these bullish signals on the charts, there is an important upcoming event that may have a significant impact on future price movements for the US100. This event is the release of US CPI (Consumer Price Index) data, which is scheduled for 5:30am PST.
CPI is a measure of inflation, which is one of the most important factors that the US Federal Reserve takes into account when making decisions about interest rates and monetary policy. Inflation that is too high can be a sign of an overheating economy, which can lead to increased borrowing costs and reduced economic growth. Therefore, the Fed is constantly monitoring inflation levels and using policy tools to try to keep inflation within a certain range.
The upcoming CPI release is expected to be a major market-moving event for the US100, as well as for other markets such as currencies and bonds. If the CPI data comes in below expectations (a "miss"), this may suggest that inflation is not as much of a concern as previously thought, which could lead to increased buying pressure for the US100. On the other hand, if the CPI data comes in above expectations (a "beat"), this may suggest that inflation is a bigger concern than previously thought, which could lead to increased selling pressure for the US100.
In either case, it is important to note that the Fed's next moves will likely be shaped by the CPI data. If inflation continues to be a concern, the Fed may take steps to raise interest rates or reduce asset purchases in order to try to curb inflation. This could have a significant impact on the US100 and other markets in the short and long term.
In summary, while the US100 has recently shown some bullish signals on the charts, traders should be cautious and pay close attention to the upcoming CPI release. The data from this release is likely to shape the Fed's next moves and could have a significant impact on future price movements for the US100 and other markets.

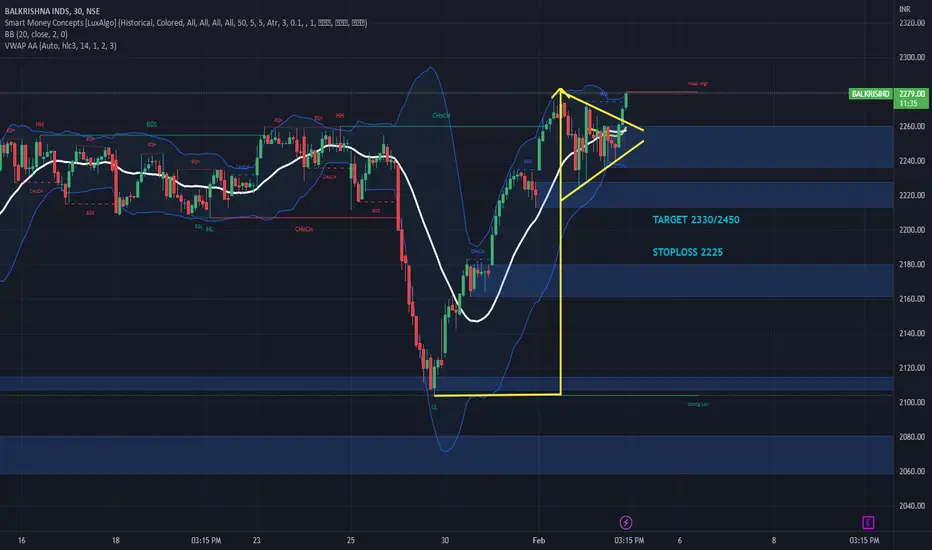
BalkrishnaBalkrishna made flag pattern & comfortably trading above breakout level.
Not to be missed breakout.
Risk:Rewar Ratio in favour of bulls.
Could be bought with mentioned stoploss & targets.
BTC/USDTi think btc going to break up side
i am looking target 17200$ & 18000$
if btc break 16200 then after retest i am taking my short position


Going LONG EURJPY By Trading StrategyBullish Indications
1. Higher Highs and Lows
2. Tweezer Bottom and Bullish Engulfing on HL
3. Break 0.5 fib support level
4. Break Upper Resistance Trendline
5. Formation of Bullish Flag
6.12 out of 16 years December remains bullish
7. Trend is not mature enough to make it a reversal
Seasonal Data for the Past 15-16 Years
Dec-06 => Green
Dec-07 => Green
Dec-08 => Green
Dec-09 => Green
Dec-10 => Red
Dec-11 => Red
Dec-12 => Green
Dec-13 => Green
Dec-14 => Red
Dec-15 => Green
Dec-16 => Green
Dec-17 => Green
Dec-18 => Red
Dec-19 => Green
Dec-20 => Green
Dec-21 => Green

Ultratech Cement Ultratech Cement is looking in a good momentum on up side, also it has done breakout of flag n pole chart pattern in daily time frame along with good intensity of volume, along with trend indicators confirmations, overall it looks good candidate to go long, all the key levels are mentioned in chart with Stop-loss and Targets.
All the key levels are mentioned in chart with Stop-loss and Targets
Chart pattern flag n pole breakout on daily time frame
Macd in daily positive crossover and Uptick and also above zero line
Macd in weekly positive and Uptick
Rsi in daily above 60 uptick
Rsi in weekly uptick and also above 60
Upper BBC in daily
Dmi adx also positive
RK buy signals
Most traders treat trading as a hobby because they have a full-time job doing something else. However, If you treat trading like a business, it will pay you like a business. If you treat like a hobby, hobbies don't pay, they cost you....!
Disclaimer
I am not sebi registered analyst
My studies are Educational purpose only
I am not responsible for any kind of your profits and losses
Please consult your Financial advisor before trading or investing

ETH/BTC FLAG PATTERN + ELLIOT + FIBO (6M)Inside of pennant finishes last price movements. By Elliot builds up 1st wave of 3 Main wave. Fibo shows where aims may to be put.

GlenmarkGlenmark made flag n pole pattern on hourly charts with good volumes.
Could be bought with mentioned stoploss & target

GBPAUD I Potential +250 pip upside Welcome back! Let me know your thoughts in the comments!
**GBPAUD - Listen to video!
We recommend that you keep this pair on your watchlist and enter when the entry criteria of your strategy is met.
Please support this idea with a LIKE and COMMENT if you find it useful and Click "Follow" on our profile if you'd like these trade ideas delivered straight to your email in the future.
Thanks for your continued support!
Brian & Kenya Horton, BK Forex Academy
