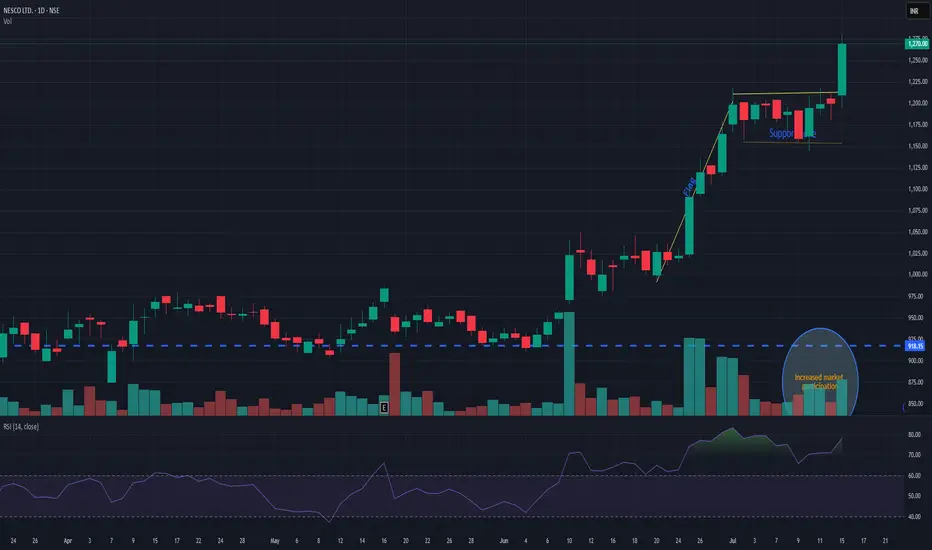
NESCONESCO giving flag pattern breakout with decent volume. Support is seen nr 1180. while pole initiation can be seen near 1010. Currently trading near 1270. It has a potential for new momentum. Keep it on radar.
Flagformation
SUNDARAM FINANCE Near at Support Zone | Keep an eye on it ||There are two charts of Sundaram Finance —on the Weekly timeframe and Daily timeframe.
On the weekly timeframe, the stock is moving within an ascending parallel channel, with the support zone between 4650-4550.
On the daily timeframe, the stock is moving within a descending channel, with the support boundary near 4600-4650.
If this level is sustain then we may see higher prices in SUNDARMFIN
Thank You...

QBTS massive weekly bull flagLots of eyes on quantum computing these days. Massive bull flag forming on the daily and weekly on QBTS which has already had a great run.
Another ticker with no resistance if/when the breakout occurs.

How to Spot Flag Patterns on TradingViewLearn to identify and trade flag patterns in TradingView with this step-by-step tutorial from Optimus Futures. Flag patterns are continuation formations that help traders join existing trends by buying high and selling higher, or selling low and buying back lower.
What You'll Learn:
• How to identify bullish and bearish flag patterns on any timeframe
• Breaking down flag patterns into two parts: the flagpole and the flag
• Finding strong flagpole formations with fast, obvious price moves
• Spotting flag consolidation areas that form tight ranges
• Why flag patterns work: buyer and seller psychology explained
• Real chart examples showing how flag patterns develop and play out
This tutorial may help futures traders and technical analysts who want to trade with market trends rather than against them. The concepts covered could assist you in identifying opportunities to join strong price movements when they pause before continuing.
Learn more about futures trading with Tradingview: optimusfutures.com
Disclaimer:
There is a substantial risk of loss in futures trading. Past performance is not indicative of future results. Please trade only with risk capital. We are not responsible for any third-party links, comments, or content shared on TradingView. Any opinions, links, or messages posted by users on TradingView do not represent our views or recommendations. Please exercise your own judgment and due diligence when engaging with any external content or user commentary.
This video represents the opinion of Optimus Futures and is intended for educational purposes only. Chart interpretations are presented solely to illustrate objective technical concepts and should not be viewed as predictive of future market behavior. In our opinion, charts are analytical tools—not forecasting instruments. Market conditions are constantly evolving, and all trading decisions should be made independently, with careful consideration of individual risk tolerance and financial objectives.

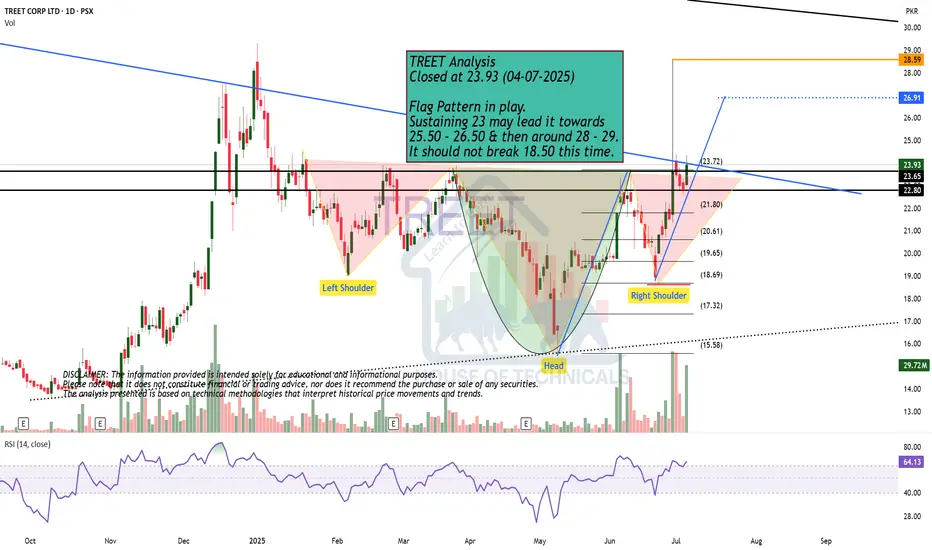
Flag Pattern in play. TREET Analysis
Closed at 23.93 (04-07-2025)
Flag Pattern in play.
Sustaining 23 may lead it towards
25.50 - 26.50 & then around 28 - 29.
It should not break 18.50 this time.
BTCUSDT at Best Resistance !!This is the Daily chart of Bitcoin .
BTCUSDT is trading near it Resistance Zone 108,600 - 107,400.
If this level is sustain , then we may see lower prices in BTCUSDT.
Thank You !!

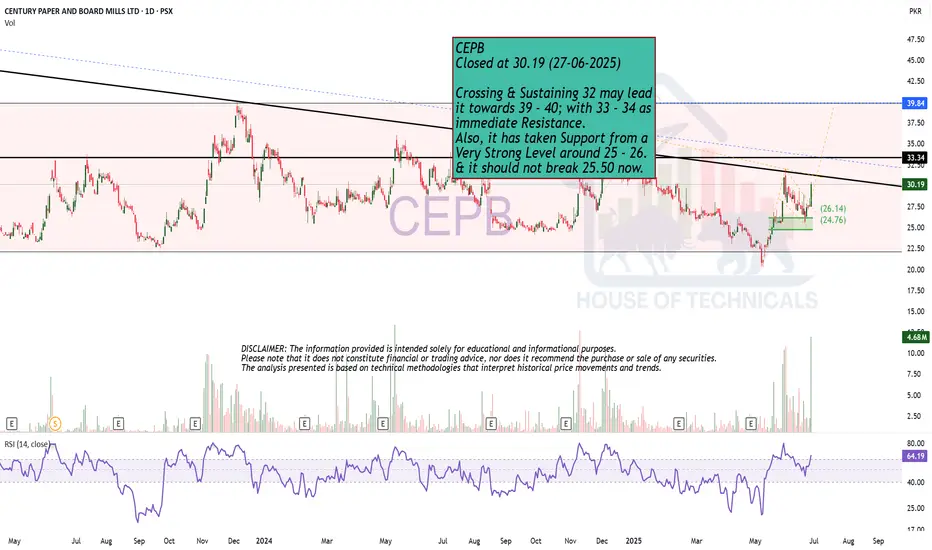
Bullish Flag!CEPB
Closed at 30.19 (27-06-2025)
Crossing & Sustaining 32 may lead
it towards 39 - 40; with 33 - 34 as
immediate Resistance.
Also, it has taken Support from a
Very Strong Level around 25 - 26.
& it should not break 25.50 now.
FLAGPIIND fut made flag n pole pattern after consolidation on daily hourly charts with all 4 indicators suggesting long.
Accum/Dist :- 4.40 m
OI :- -9.91% (short covering)
RSI:- 69
MACD :- 68
Could b bought wih stoploss of 4075 & target of 4235.

$ETH / USDT – 4H Time Frame Analysis 3,000 INCOMING?? CRYPTOCAP:ETH / USDT – 4H Time Frame Analysis
Structure: Bullish Flag | Outlook: Neutral-Bullish | Target: $3000?
🔹 Chart Overview
-Pattern: Bullish Flag (continuation structure)
Current Range:
- Supply Zone: $2,680.00 – $2,786.21
- Demand Zone: $2,319.79 – $2,417.61
Price Action:
- Tight consolidation between higher lows and lower highs, forming a symmetrical triangle within a flag structure.
Trend:
- Consolidation, but within a macro uptrend (prior strong rally).
Volume Profile:
- Anchored Volume shows high participation around $2,540–$2,600.
OBV:
- Flattening, signaling indecision and potential energy buildup.
Key Psychological Levels:
$2,860: Minor resistance from past S/R flips.
$3,000: Major round-number psychological resistance.
📐 Technical Confluences
Fibonacci Retracement:
- The 0.618 golden pocket aligns with the support trendline, reinforcing this as a critical zone.
Fair Value Gaps (FVG):
- Above Price: Acts as a magnet in bullish continuation.
- Below Price: Risk zone if price drops; aligns with liquidity and trendline support.
- Liquidity Zone: Aligned with 0.5–0.618 retracement; strong reaction expected.
📈 Bullish Scenari o
Breakout of Pennant Resistance:
- A clean break above $2,786 (supply zone & swing high) with volume.
Close above Upper FVG and Liquidity Zone:
- Confirms bullish intent. Targets psychological level at $2,860, then $3,000.
Volume Confirmation:
- OBV uptick and high breakout volume would validate the move.
Bullish Target Zones:
TP1: $2,860 (psych level + previous resistance)
TP2: $3,000 (major psychological level)
TP3: $3,120–$3,180 (1.618 Fib extension)
📉 Bearish Scenario
Rejection from Current Supply or Liquidity Zone:
- Fails to break above supply; rolls over from the upper pennant line.
Break Below Support Trendline:
- Break below golden pocket and $2,417.61 demand zone.
Invalidation of Bullish Flag:
- A breakdown below $2,319.79 (swing low) invalidates the bullish flag and may signal a trend reversal.
Bearish Target Zones:
TP1: $2,200 (local volume gap + structure support)
TP2: $2,060–$2,120 (previous accumulation zone)
TP3: $1,950 (macro support & last strong demand)
✅ Summary
Structure:
- Price is compressing within a bullish continuation pattern, awaiting breakout confirmation.
Bias: Slightly bullish unless the swing low at $2,319 is broken.
Confirmation Needed:
- Break above or below pennant boundaries with volume.

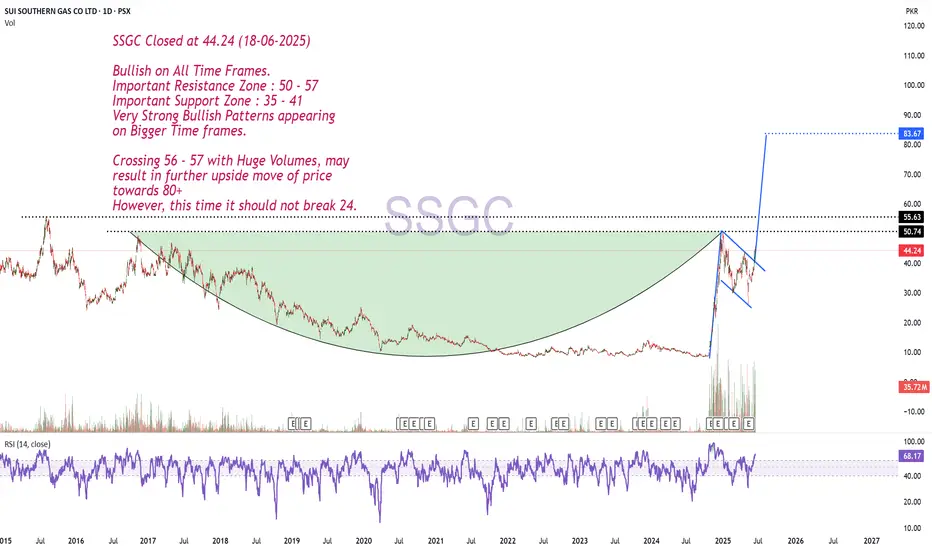
Bullish on All Time Frames.SSGC Closed at 44.24 (18-06-2025)
Bullish on All Time Frames.
Important Resistance Zone : 50 - 57
Important Support Zone : 35 - 41
Very Strong Bullish Patterns appearing
on Bigger Time frames.
Crossing 56 - 57 with Huge Volumes, may
result in further upside move of price
towards 80+
However, this time it should not break 24.
ENGINEERS INDIA LTD - Bullish Flag & Pole Breakout (Daily T/F)Trade Setup
📌 Stock: ENGINEERS INDIA LTD ( NSE:ENGINERSIN )
📌 Trend: Strong Bullish Momentum
📌 Risk-Reward Ratio: 1:3 (Favorable)
🎯 Entry Zone: ₹242.00 (Breakout Confirmation)
🛑 Stop Loss: ₹211.00 (Daily Closing Basis) (-12.6 % Risk)
🎯 Target Levels:
₹253.95
₹266.50
₹279.50
₹293.45
₹307.90
₹327.00 (Final Target)
Technical Rationale
✅ Bullish Flag & Pole Breakout - Classic bullish pattern confirming uptrend continuation
✅ Strong Momentum - Daily, Weekly & Monthly RSI >60 (Bullish zone)
✅ Volume Confirmation - Breakout volume 20.96M vs previous day's 3.64M (Nearly 7x surge)
✅ Multi-Timeframe Alignment - Daily and weekly charts showing strength
Key Observations
• The breakout comes with significantly higher volume, validating strength
• Well-defined pattern with clear price & volume breakout
• Conservative stop loss at recent swing low
Trade Management Strategy
• Consider partial profit booking at each target level
• Move stop loss to breakeven after Target 1 is achieved
• Trail stop loss to protect profits as price progresses
Disclaimer ⚠️
This analysis is strictly for educational purposes and should not be construed as financial advice. Trading in equities involves substantial risk of capital loss. Past performance is not indicative of future results. Always conduct your own research, consider your risk appetite, and consult a financial advisor before making any investment decisions. The author assumes no responsibility for any trading outcomes based on this information.
What do you think? Are you watching NSE:ENGINERSIN for this breakout opportunity? Share your views in the comments!

Good Stock for Medium to Long TermClosed at 181.52 (05-06-2025)
Printed HH on Daily tf.
Should retrace towards 177 - 178
& then may be around 165 -166 to print
HL.
188 - 195 is the resistance for now that
needs to be sustained.
Crossing this may move the price towards
235 - 236.
Medium to Long term target can be around
290 - 300 if 260 is crossed with Good Volumes.

Bearish Divergence on Bigger tf
CMP 105228.47 (02-06-2025)
Bearish Divergence on Bigger tf (Cautious
approach should be taken).
However, if 109350 is Crossed, we may
witness 115000 & then 120000 - 121000.
and if 112000 is crossed & sustained, be ready
to get New Highs :-)
Lets be more cautious & dig out 3 Important
Support Levels.
S1 around 103000 - 102500
S2 around 97800
S3 around 93400 - 93500.

HDFC AMC – Bullish Flag Formation on Daily ChartHDFC AMC is currently exhibiting a bullish flag formation, a classic continuation pattern following a strong vertical rally. The recent price action is consolidating within a downward-sloping channel, typically seen as a pause before the next leg up.
Key Technical Levels:
Flag upper boundary (first resistance): Around ₹4,400
Flag high / prior resistance: ₹4,583.65
All-time high: ₹4,867.00
A breakout above the flag’s upper line could signal fresh buying momentum with the potential to first retest the flag high and possibly challenge the all-time high if the breakout sustains.
Fundamentals Snapshot:
Dividend Yield: 1.64%
ROCE: 43.3%
ROE: 32.4%
PE Ratio: 37.09 (vs Industry PE of 20.70)
Growth Metrics:
Compounded Sales Growth:
10 Years: 13%
Compounded Profit Growth:
10 Years: 19%
Stock Price CAGR:
5 Years: 10%
This combination of strong technical setup and solid financial performance suggests HDFC AMC remains a strong contender in the asset management space.
Recent escalations along the India-Pakistan border have led to military confrontations, increasing uncertainty in the broader market. If tensions worsen, volatility may rise, and market sentiment could turn risk-off, impacting financial market. Traders should stay alert for any escalation news.
Disclaimer:
This post is for educational purposes only and is not financial advice. Please do your own research or consult a financial advisor before making any investment decisions. Market conditions and geopolitical developments can change rapidly.

FLAGHavells made flag n pole pattern on hourly charts after taking support @ 0.5 Fibb Retracement Level, with decrease in OI suggesting furthermore shourt covering.
Risk:Reward = 1:2.
Could b bought with mentioned stoploss & target.
Jai Hind.

"Nifty 50 Chart Turns Cautious: Downside Risk Builds"1. **Rising Wedge Breakdown:**
* The index had been trading in a **rising wedge** pattern (purple converging lines).
* A **bearish breakdown** has occurred, suggesting potential for further downside.
* The price broke below the lower trendline with strong red candles and rising volume, validating the bearish move.
2. **Bear Flag Breakdown:**
* A smaller **bear flag** or **descending channel** pattern within the wedge broke down as well, reinforcing bearish sentiment.
3. **Support Zone Tested:**
* Price is currently hovering around a critical **horizontal support zone** between **24,081 – 24,240**, marked with black lines.
* The index is sitting just above this zone, and a clean break below could accelerate selling.
4. **Long-Term Uptrend Line:**
* A longer-term ascending trendline lies just below the current price (\~24,050 area).
* This could act as **last-resort dynamic support** before a larger correction.
---
* **Immediate Resistance**:
* 24,240 – Minor horizontal resistance
* 24,400 – Former support now turned resistance
* **Immediate Support**:
* 24,081 – Horizontal support
* 23,900–24,000 zone – Next key demand area
* 23,700 – Long-term trendline & psychological support
---
**Volume Analysis:**
* Recent volume spike on red candles indicates **stronger participation from sellers**.
* Bearish momentum is likely to continue unless volume dries up and bullish candles appear at support.

Bullish Flag / Pennant Pattern Formation appearing.
Bullish Flag / Pennant Pattern Formation appearing.
87 - 88 is the Breakout Level; but Important Resistance
lies around 90 - 92
Closing above 100 - 101 would trigger more positivity.
Crossing & Sustaining this level may expose new Highs
around 130.
However, it should not Break 73.

Play wisely.Cup & Handle Formation.
But Bearish Divergence is there which is dragging
the price down.
Immediate Resistance now is around 678 - 680.
Next Support is around 638- 651.
The Bullish Momentum will resume once it
will Cross 725

The Flag Chart Pattern ExplainedHello, traders! 👋🏻
If price action had a way of saying, “HOLD MY BEER, I’M NOT DONE YET,”— it would be through a flag pattern. This classic continuation setup is where strong trends take a breather before launching their next move. Whether you're seeing a bullish flag chart pattern or a bearish flag pattern, you’re looking at a market that’s just catching its breath before running again.
Let’s break down how this works and what to watch for!
What Is a Flag Pattern?
A flag pattern forms when the market makes a strong move (called the “flagpole”), then consolidates in a narrow, counter-trend range that looks like a flag. Eventually, the price breaks out in the direction of the original trend.
Think of it like a runner sprinting, slowing down to recover, and then taking off again. That pause? That’s your flag.
There Are Two Main Types:
🟢 Bull Flag Pattern (Bullish Flag Pattern)
It appears after a sharp upward move. The flag part slopes downward or moves sideways.
It also might signal a continuation of the bullish trend. This is the kind of setup that gets traders excited — it’s all about momentum.
🔴 Bear Flag Pattern (Bearish Flag Pattern)
It appears after a sharp downward move. The flag part slopes upward or consolidates sideways. It also might signal a continuation of the bearish trend. When the market pauses in a falling trend, the bear flag pattern warns that sellers are just regrouping before the next drop.
How to Recognize a Flag Chart Pattern
Spotting a Flag Trading Pattern Is Fairly Straightforward — Just Look For:
✔ A Strong Price Move (the Flagpole)
✔ A Tight Consolidation That Slopes Opposite the Trend
✔ Lower Volume During Consolidation
✔ A Breakout in the Direction of the Original Trend
📊 Real Example: BTC Flag Pattern in 2024
Take a look at the chart above. From October to March 2024, Bitcoin made a massive upward move from around $40,000 to $72,000+ — this was the flagpole.
Then, from March through November 2024, BTC entered a long, downward-sloping consolidation channel, forming the flag itself. Despite the lower highs and lower lows, the pullback was contained within parallel trend lines — a classic setup.
Once the price broke above the top of the flag, it kicked off a second leg, surging to a new all-time high above $108,000. That breakout confirmed the bullish flag pattern and rewarded traders who recognized the structure early.
This BTC move is a textbook example of how a bull flag chart pattern plays out in real markets — offering clean entry signals and strong momentum if the pattern completes.
There are variations, too — like the rising flag pattern, which can appear in both bullish and bearish conditions, depending on the context. Some traders even debate whether a flag pattern is a continuation or a subtle reversal flag pattern — so CONTEXT MATTERS.
Final Thoughts: Trust the Flag, Not the Noise
The flag chart pattern is a reminder that not every pullback means the trend is over. Sometimes, it’s just the market catching its breath. Whether you’re spotting a bull flag pattern in a crypto rally or a bear flag pattern in a downtrend, learning to trade these setups can possibly add precision to your strategy.
So, next time you see a price taking a nap in a narrow channel, ask yourself: Is this a bullish flag chart pattern gearing up for another leg up? Or is it a bearish flag pattern just waiting to drop the floor out? Let the structure tell the story and the trend do the rest.
This analysis is performed on historical data, does not relate to current market conditions, is for educational purposes only, and is not a trading recommendation.

Stella, is she finally ready?Stella has been in a massive downtrend since it's run in 2021.
Looking at the above chart there is a reason to be bullish now and with a massive pricetarget.
It has been trading in a bull-flag for years and has recently broken out, AND retested the upper bound of the channel.
Target: 3$ (would mean an mcap of 3B, which is doable)
Stoploss: 0.035$ (would mean re entry of the channel and invalidates this idea)
Will update frequently when asked
Rustle

XRP Next Move !... $4 XRPUSD Ripple Just A Matter Of Time? $€£¥This space seems a bit quite now but if you liked XRPUSD / XRPUSDT at $3 what has changed now?
When the hype is around thats the time to be ⚠️ cautious IMO.
When there is little attention of the said market thats when 🟢SeekingPips🟢 likes to get to work.
⚠️This time is NO different⚠️
NOT SURE WHERE THE NEXT LOW WILL FORM❓️
ME NEITHER❗️❕️❗️
🟢 You don't need to know❗️ You just need to HAVE A PLAN ✅️

Morning Star Formation on Daily TF.Morning Star Formation on Daily TF.
No Bearish Divergence yet that has matured.
a Very Important Support lies arround 173.50 - 177.50
Beautifully printed HL & Moving Up now.
Crossing & Sustaining 194 may lead it towards
200+ with ultimate target around 230.

Big XRP bullish move formingBYBIT:XRPUSDT has formed a (remarkably equaliteral) triangle flag pattern since breaking out of the parallel channel flag*. Given the previous 25% move upwards (i.e. the flagpole), text book technical analysis theory states that there is another upwards move imminent. This is a good opportunity for a medium term (approx. one month long) bullish swing trade.
A few things to note:
*The breakout move from the parallel flag channel was a text book move upwards where it moved outside of the channel (breakout move), then returned back to the resistance line of the parallel channel, which became support, and then continued the move upwards. This provided a very good entry opportunity upon the return move once the daily candlestick showed proved that resistance line is a now a line of support (i.e. the candlestick is of a dragonfly shape) - you enter on the dragonfly share confirmation
The triangle flag pattern is running out of room. i.e. the move is expected to come soon (this coming week) as the candlesticks are getting smaller and smaller in size, following, broadly speaking, the triangles lines of support and resistance, and there are not many days left until the candlesticks will naturally move out of the triangle.
The market psychology behind this is that the buyers who made a profit on the recent flagpole are now selling, with newer, bullish buyers entering the market. The price which the sellers are willing to sell and and buyers willing to purchase at is getting closer and closer, which usually means the continuation of the trend as there are more buyers (in this case) than sellers (i.e. people are willing to buy at a price closer and closer to the sellers ask price and sellers don't have to drop their prices as much to entire people to buy)
This is consistent with the optimistic and bullish sentiment for the economy in generally, stock market and crypto since Trump's election victory with Trump having recently announced that he would prefer lower interest rates i.e. The chart formation is showing that there are still more bulls than bears.
Risk to this move are that the RSI is overbought (which in this case can be ignored as it has been overbought for a few months and the nature of the indicator is that in a bullish market it remains at an overbought level regularly) and that the crypto market is prone to large gyrations on rumours and even minor US governmental policy announcements.
