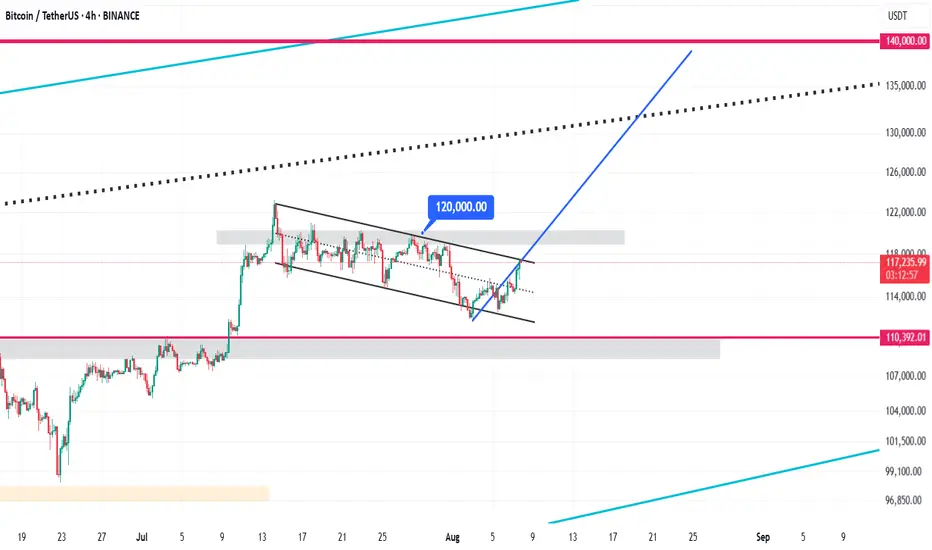
Bitcoin Bullish Flag Pattern Analysis & $140,000 Target🚩 Bullish Flag Pattern Formation
Bitcoin is currently forming a bullish flag pattern on the 4-hour chart. This pattern typically appears after a sharp upward move and represents a short-term consolidation within a descending channel. It usually signals a continuation of the strong bullish trend. Currently, the price is oscillating between the upper and lower boundaries of this channel, poised for a potential breakout.
⏳ Duration of the Correction Phase
The correction inside this channel has lasted from July 14 to August 8, 2025, spanning approximately 25 days. This relatively long consolidation period indicates a deep stabilization phase, allowing the market to gather momentum for the next upward wave. During this time, Bitcoin traded in a tight range between the channel’s support and resistance levels.
⚠️ Critical Resistance at $120,000
The key resistance level to watch is $120,000. If Bitcoin can break this level decisively with strong volume and confirming candles, the bullish flag pattern will be validated, signaling a continuation of the upward trend. This breakout point is considered an optimal entry for new long positions.
🎯 Price Target at $140,000
The target price derived from the bullish flag pattern, calculated by measuring the flagpole and projecting it from the breakout point, is around $140,000. This represents approximately a 20% gain from the breakout and may serve as a significant psychological resistance level.
Flag
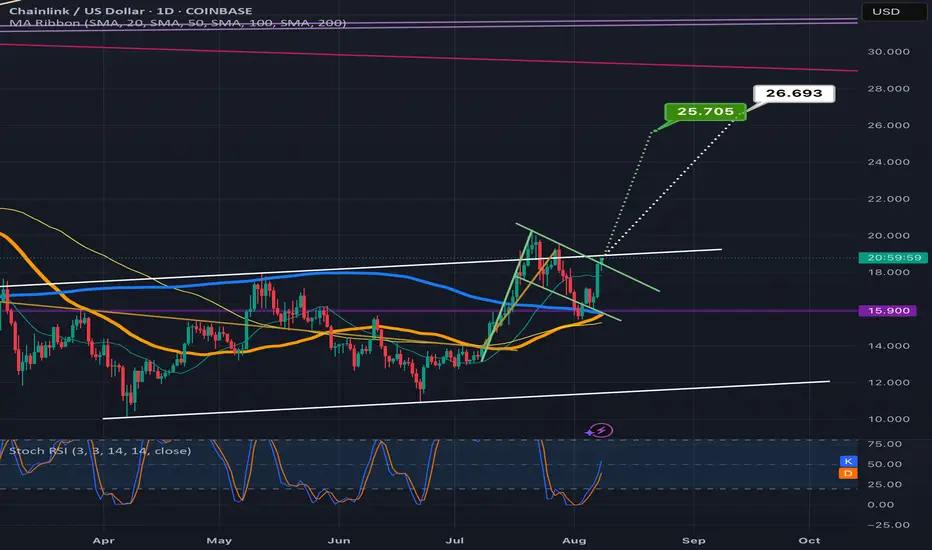
Chainlink looks ready 2 break up from bullflag & a double bottomGreen target is the bullflag white target is the double bottom. *not financial advice*
EURCAD: More Growth Ahead 🇪🇺🇨🇦
EURCAD broke a resistance line of a bullish flag pattern yesterday.
A consequent confirmed Break of Structure BoS indicates
that the rise will most likely continue.
The next strong resistance is 1.61.
The market is going to reach that soon.
❤️Please, support my work with like, thank you!❤️
I am part of Trade Nation's Influencer program and receive a monthly fee for using their TradingView charts in my analysis.

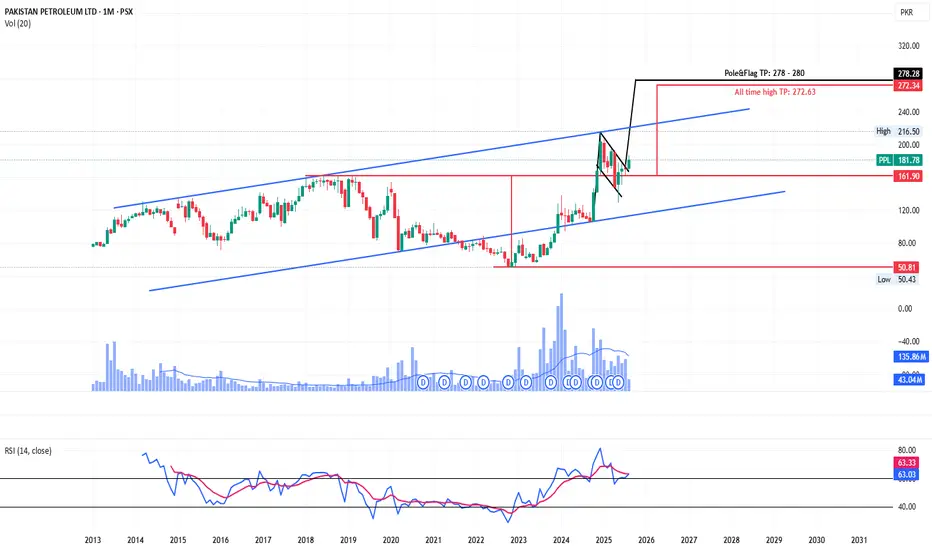
Bullish Flag Pattern.
Bullish Flag Pattern.
Crossing 435 with Heavy volumes will
trigger more positivity & will expose
New Highs targeting 700+
On flip side, breaking 300 now, will
bring more selling pressure.

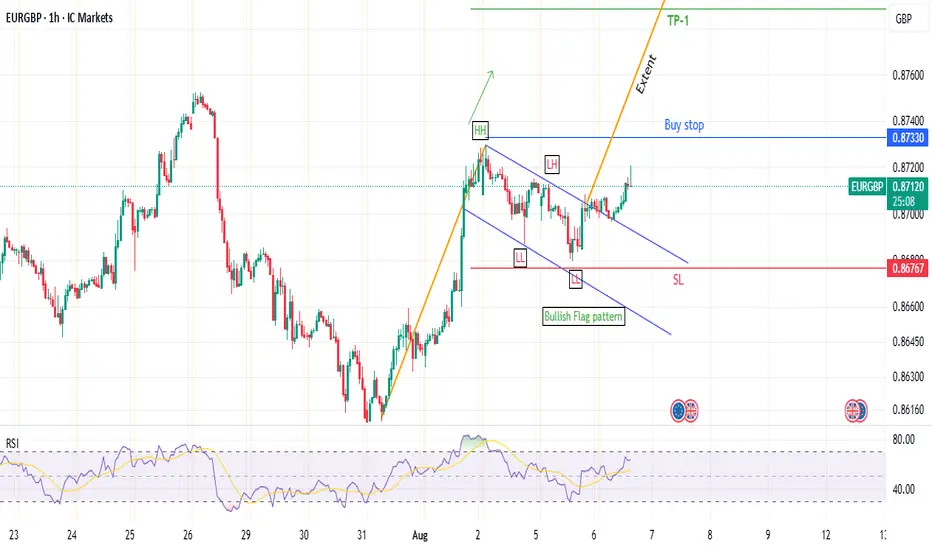
EUR/GBP: Bull Flag Forming for a Potential Breakout?Hey everyone,
Sharing my view on EUR/GBP on the 1-hour chart. I've spotted what looks like a classic Bullish Flag pattern developing after a strong upward surge. This is a continuation pattern, and I'm looking to trade the breakout.
My Game Plan: I'm playing this with a conservative entry, waiting for a clear break of the top of Flag pole. Here are the specific levels for my trade plan:
🎯 Entry (Buy Stop): $0.8733
🛡️ Stop Loss: $0.8677 (A break below here would invalidate the bullish setup for me)
💰 Take Profit 1: $0.8789 (A clean 1:1 Risk/Reward)
🏆 Take Profit 2: $0.8822 (Length of the flag pole)
ENAUSDT - Bullish Flag or Descending Channel?My operation is to eat the profits of this period, and then change the operation according to the market

Bitcoin still bullish.As long we stay above 112k support and keep building the channel that looks more and more like a bull flag, we are golden for a new ATH.

Pennant — Trend Is Your Best Friend 🚩 Pennant — Trend Is Your Best Friend 📈
drive.google.com
🔍 Introduction
The Pennant is a trend continuation pattern, resembling a small triangle that forms after a strong initial move (known as the “flagpole”). It is similar to the Flag pattern, but with one key difference: the body of the Pennant is formed by two converging trendlines, rather than parallel ones.
📐 Pattern Description
The Pennant forms after a strong, impulsive price move, indicating that the trend is likely to continue after a short pause.
Like the Flag, the Pennant consists of two main components:
The flagpole — a sharp, directional move (either bullish or bearish)
The Pennant body — a brief consolidation shaped like a symmetrical triangle 🔺
🟢 A bullish pennant forms after a strong upward move
🔴 A bearish pennant follows a strong downward move
🧠 Market psychology behind the pattern:
After a big move, many traders expect a reversal and begin taking counter-trend positions. But when the breakout occurs in the direction of the original trend, it triggers a wave of new orders, pushing price even further. That’s why the Pennant is often used to enter trades in the direction of the dominant trend.
📉 Volume behavior is also key:
High volume during the initial move
Low volume during the Pennant’s consolidation
Rising volume on the breakout
This volume pattern reflects renewed trader interest and often leads to a more explosive breakout compared to a Flag, due to the tightening nature of the consolidation.
⚠️ A weak or sloppy move before the Pennant weakens the signal and increases the risk of false breakouts.
🎯 Entry & Stop-Loss Strategy
📥 Entry: After a confirmed breakout above the Pennant’s resistance (or below it for bearish setups)
🛑 Stop-loss: Placed just below the last local low before breakout
💰 Profit Target:
Partial take profit at the top of the flagpole
Full target = the height of the flagpole projected from the breakout point (aka the Measured Move)
Always account for key support/resistance levels to define the potential range
💡 The Pennant often offers great risk/reward due to its tight structure and explosive potential.
💡 My Pro Tips for Trading Pennants
✅ Pennant Pattern Criteria
Trend continuation pattern
A strong, nearly vertical move preceding the Pennant
Triangle-shaped consolidation (two converging lines)
The Pennant body must be shorter than the flagpole
The lowest point of the Pennant should not exceed half the length of the flagpole
Breakouts should happen in the direction of the initial trend
Tight range before breakout increases accuracy
📈 What Strengthens the Signal
Sharp, clean, directional initial move (strong flagpole) ⚡
High volume on the initial move, and volume surge on breakout 💥
⚠️ What Weakens the Signal
Choppy or weak price action before the Pennant 🫤
Lack of volume during the flagpole or breakout 💤
✅ Examples of My Winning Pennant Setups
🔗 EURUSD Bearish Pennant — Ready to Drop
❌ Examples of My Losing Setups
🔗 XAUUSD Bullish Pennant — Failed Follow-through
💬 Do You Trade Pennants?
They’re one of the most powerful continuation patterns when paired with clean price action and volume confirmation. What’s your experience with Pennants? Share your wins — and fails — below 👇👇

AG: Short-Term Slap, Long-Term ConvictionAG: Short-Term Slap, Long-Term Conviction
Let’s talk positions — not just charts.
I’ve been holding Dec 18, 2026 $10 calls as my core AG thesis for a while now. These are not trades — they’re my conviction play on a long-overdue re-rating of First Majestic ( NYSE:AG ) relative to spot silver and the broader miner complex. I currently hold 90 contracts averaging $1.21.
On Friday, I added to that core, because the setup continues to confirm.
Now here’s where it gets fun:
Despite being fully sized on the long side, the chart slapped me in the face twice...once last week, and again yesterday. That bull flag? Still intact. Friday’s flush? Weak hands out. Volume? Telling the real story.
So I took a tactical swing:
Short-Term Trade: Sept 19 $9 Calls
✅ Started with 10 contracts @ $.61
✅ Added 10 @ $0.33 on Friday
✅ Added 10 more @ $0.38 on Monday
Average: $0.44 (trading at parity now)
This isn’t about guessing. This is about alignment:
✅ Silver strength
✅ Lagging miner catch-up
✅ Weekly & monthly volume expansion
✅ Time symmetry between past squeezes
Long-term thesis is the foundation.
Short-term trades like this are the bonus rounds when the setup screams.
If AG holds above $7.99 and clears $8.35 cleanly, the next key level is $9.35.
Above that? We’re talking $11.00+.
Position Breakdown
Core: 90 Dec 2026 $10 Calls (scaled in with average around $1.21)
Trading Position: 30 Sept $9 Calls, avg $0.44
Will consider adding/rolling longer if $9.35 breaks with volume

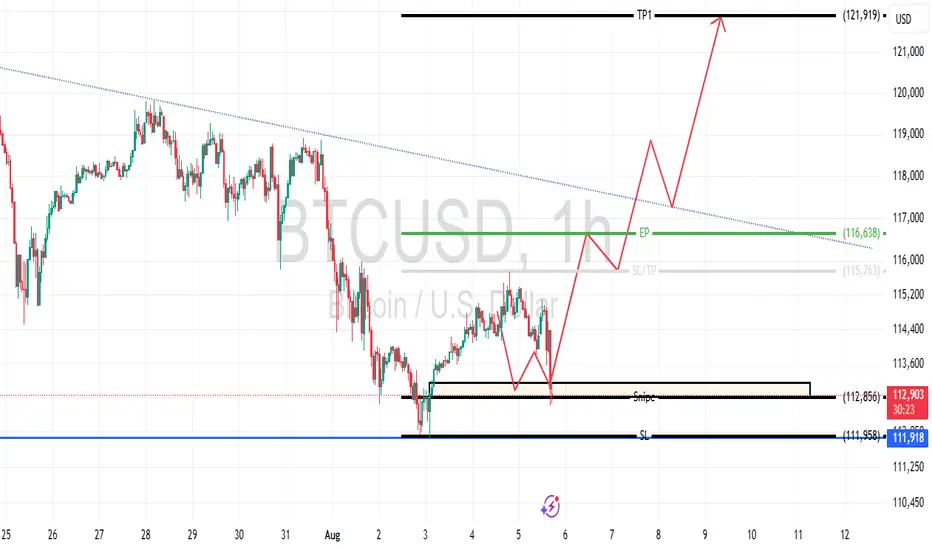
Bitcoin Possible new ATHPrice targets TP1 at $121,919, with an entry point (EP) at $116,638, stop loss (SL) at $111,987, and a support/slip level at $112,856. Expecting a rise from current levels near $113,085, driven by a breakout above the descending trendline.
Gold - Breakout and retest of a bullish FlagBullish flag break out and price is in a demand zone. As long as the demand holds, pressure will be to the upside.

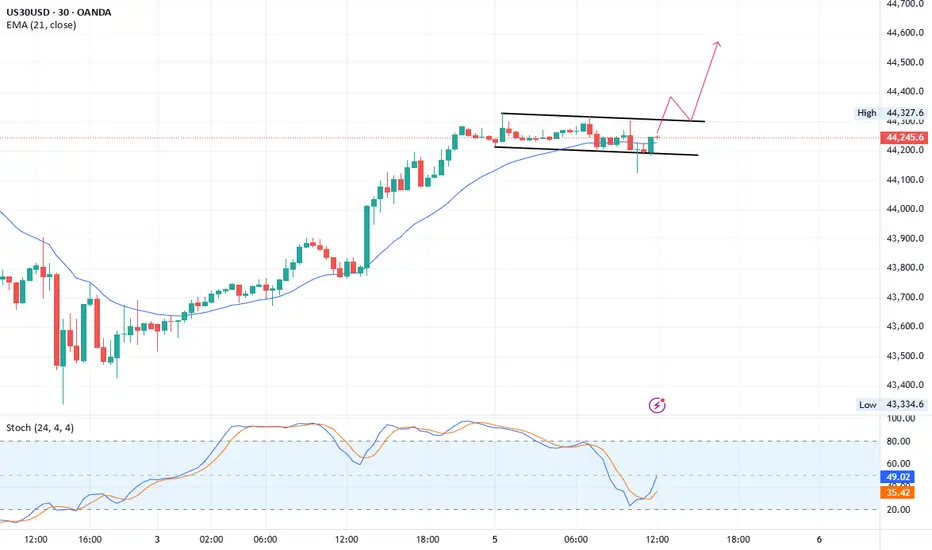
US30 Bullish flag patternUS30
M30 chart bullish flag pattern
Buy: current rate 44238
Stop Loss: 44125
1st TP: 44388
2nd TP: 44570

Lemonade may be ready for a squeezeNYSE:LMND broke dramatically into overbought territory on the weekly chart earlier this year. It's taken understandable time to digest those gains and now looks like it could be building steam to revisit prices reached during that breakout.
The shorter term 4H chart, more suitable for entry and exit signals, illustrates a recent break above a cup and handle formation. That little pump appears to be consolidating rapidly.
Should the shorter term move find traction, the the weekly chart could provide a reasonable target as a trading range is formed for a larger move in the long run. A swing trade looks attractive at this point with potential 50% upside.

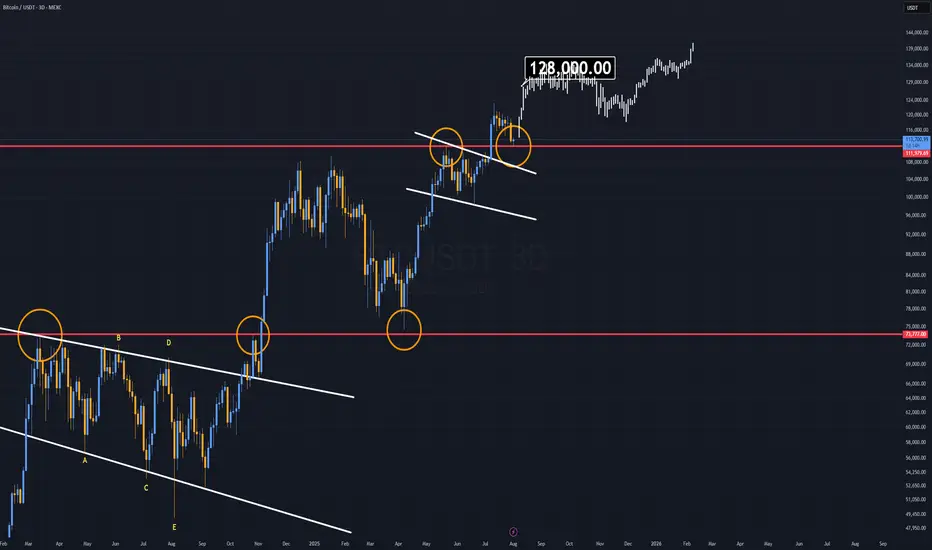
Bitcoin Analysis (3D)Bitcoin is currently trading in a very specific zone that resembles a classic bull flag continuation pattern, similar to the one we saw during last year’s rally.
Back then, a slow-forming bull flag broke to the upside, pushed to new all-time highs, and then retested the top of the same flag before continuing higher.
Now, we are witnessing a similar setup, but this time the formation has developed much faster.
The key difference:
While last year’s bull flag took a longer time to mature, the current one is more compressed, indicating a potentially sharper move if confirmed.
The $108K daily level is critical.
As long as Bitcoin remains above this level, the structure favors a new rally.
This could be the start of another impulsive leg, targeting the $128K Area.
EURJPY in bearish trendwith no major sign of reversal trend is bearish, and with a bearish flag pattern, it has added another confluence of the continuity of its current trend trade can be taken when the price breaks the lower trendline of flag

XAUUSDXAUUSD breakout falling channle and resistance zone.
Buy above 3295
Stop Loss: 3291
1st TP: 3308
2nd TP: 3313
3rd TP: 3322
4th TP: 3333

My bullish view on BTCIf we break upwards in this channel we will see 134k and/or 140k depending on the resistance on the trend lines!


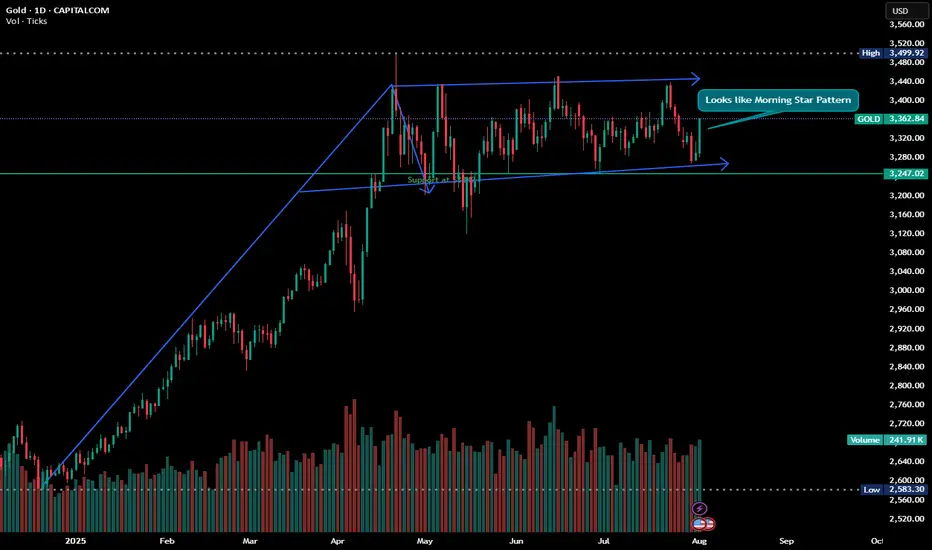
Glitters of Gold - Looks like Morning Star and Bullish Flag Disclaimer : Do your own research before investing. This is just a chart analysis. No recommendation to buy and sell.
With the up and down of stock market, there is always a safe investment place and its shine increase as the time passes with the increase in price, yes its GOLD. Everyone love it. if you look at gold from last couple of years, there is continuous growth in this metal.
while doing my chart analysis i found gold charts are quite interesting.
Gold is currently trading in range and formation of 2 patterns can be seen in the daily chart with my support and resistance level marked in CHART.
For some its investment and for some its trading however my recommendation is always do some SIP in GOLD.
Happy Investing.
Telusdt Buy opportunitySpotted a potential ascending formation with price currently developing a mini bullish flag. This structure suggests an underlying accumulation phase ahead of a potential breakout.
The strategic focus is the Buy Back Zone, a key area for strong accumulation entries. Targets are clearly mapped on the chart, with 0.009896 as the first short-term objective, followed by 0.061317.
The final critical area to monitor is the Crucial Resistance Zone, acting as the neckline of the entire setup—its breakout will confirm a long-term structural shift. Watching closely for sustained momentum.
