HUBTOWNHUBTOWN giving trendline breakout with decent volumes. Support can be seen near 301-2 level. On upper side resistance may be nr 342-365. Stock has given around 80% return in last 1.5 months. So strong momentum is observed. Keep it on radar
Flag

NovoCure Limited (NVCR) to rally 100% ??** short term forecast, days and weeks ahead **
On the above 10 day chart price action has crashed 95% since support failed. Today sellers are trying to push that correction to 100%, are they right?
Unlikely.
1) Price action (not visible on LOG) and RSI resistance breakouts.
2) Support on past resistance confirms.
3) Trend reversal. Higher lows print.
4) Bull flag confirmation forecasting a 100% move to mid 30’s.
Is it possible price action corrects further? Sure.
Is it probable? No.
Ww
Type: trade
Risk: you decide
Timeframe for long: Yesterday
Return: 100%
Stop loss: Will say elsewhere

Is this a Bull Flag forming on the XRP daily timeframe?Although sentiment for XRP is strong and recent trend has been sharply upwards. I'm wondering if this is a bear flag forming on the daily?
Given the sharp rise it could be and may not be a negative signal as it could give the opportunity for a healthy pull back before rising again to new all time highs.
Let's watch how it progresses over the next few days. I will not be jumping into a trade until it confirms.

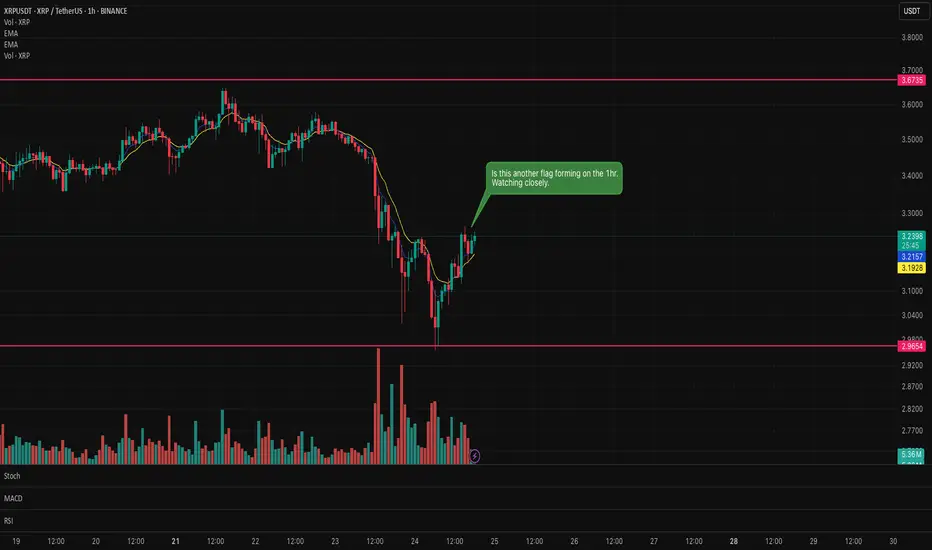
Is there another XRP flag forming on the hourly chart?Could be another flag forming on XRP. Waiting for the formation to prove confirmation as to whether it will be a bull or bear flag.
News of large amounts of XRP entering the exchanges from the CEO could mean a bear flag?
It's only appearing on the hourly so it could be a false flag.
Let's what and see what forms on the hourly candle.
Continuation flag ?Looks like a continuation flag, thoughts?
ETH is in a pullback, BTC didnt have one,
looks like a strong bullish flag

Ether is About to Break the FlagETH is making an attept to break flag formation. 3860 top could be the short term target for upward moves. Over the medium term, 4100 could be the main target. Our bull cycle top target is 6830 for the moment. This was a quick update,please check our earlier post for details.

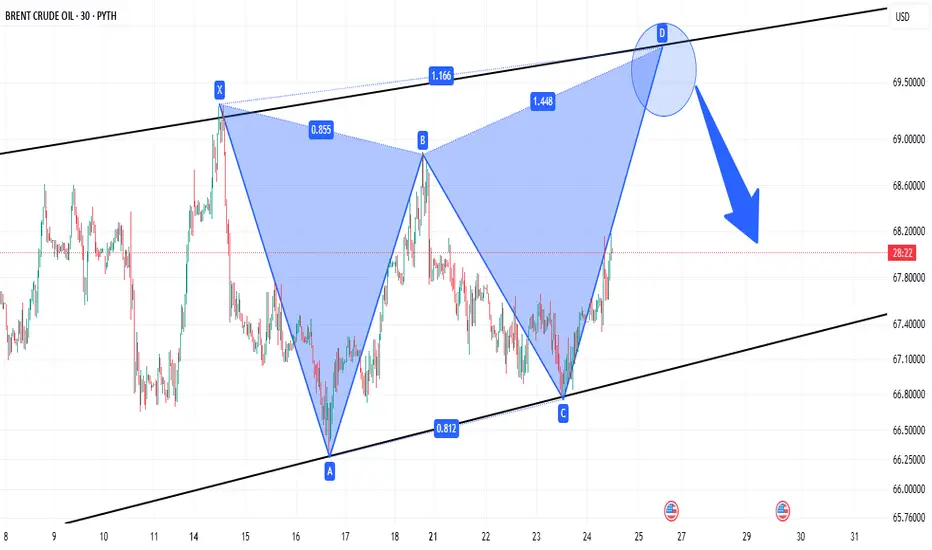
RANGING OIL PRICE HEADING FOR RESISTANCE.Price has been stuck in consolidation mode
Currently heading for resistance levels where we expect a decline
Backed-up by a bearish harmonic pattern
and a bear flag clearly visible on the 4HR time interval
EUR/USD Lots of bull flags formed on the recent chart. Buy/Long Lots of bull flags on this chart which confirmed a move to the upside.
Waiting for a little pullback to the 20MA before considering a buy long order
Waiting to see if this small bear flag forms.
A very interesting instrument to watch at the moment. Full of various signals.

XRP Bear flag confirmed. Looking for support in the decline.XRP bear flag identified on Monday 22nd has now confirmed with a nice 12% short sell.
This signals do not always confirm but when they do it is satisfying that the analysis and patience has paid off.
Trading is all about controlling emotions and being patient. Wait for the confirmation before executing.

2025 YTD Consolidation Hop-Out with Conviction - Metallicus $XPRCRYPTO:XPRUSD : You need to look back to 2021-2022 to see $XPR at these price levels to estimate resistance ranges: $0.0075, $0.008, and $0.01 but without good volume metrics it's difficult to substantiate other than using price alone.
But this YTD pennant/triangle's consolidation "hop-out" with conviction suggests, using the flagpole, a price target of $0.01, which is deemed conservative compared to bullish estimates (per @Grok : digitalcoinprice.com).
NASDAQ:LOAN is on its own trajectory, behaving with higher gamma than $XPR this year.

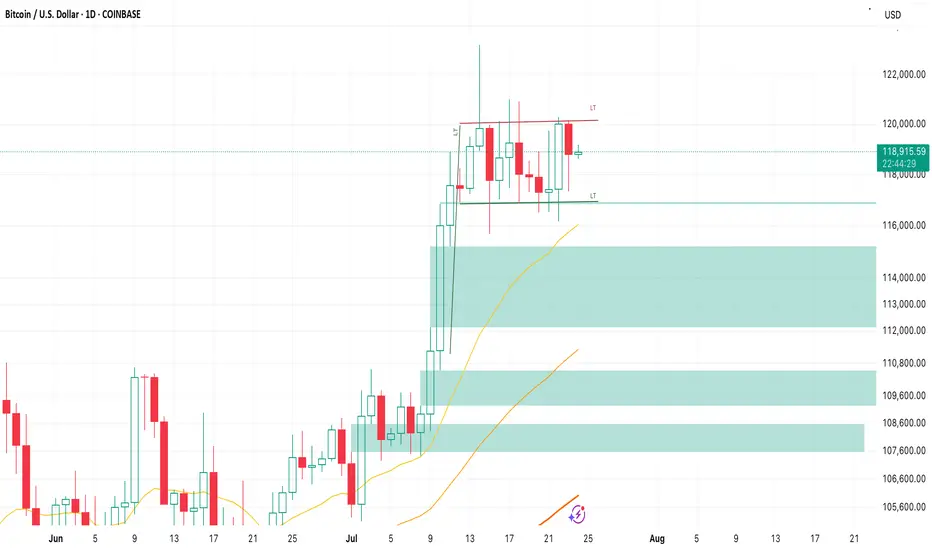
Bull Flag on BTCDecent sell-off today has been bought up nicely, my bullish thesis of
BTC and US equities remain.
- Bull Flag pattern forming on the daily
- Holding the 117k Support/FVG nicely
- Expecting some continued range-bound PA before the next leg-up begins
Dollar Index (DXY): Strong Bearish Price Action
Dollar Index broke and closed below a support line
of a bullish flag pattern on a daily.
Because the market is trading in a bearish trend,
this violation provides a strong bearish signal.
I expect a bearish movement to 96.75
❤️Please, support my work with like, thank you!❤️

GBPCAD SELLSH4 double top with broken neckline at a strong daily zone, bearish flag was also formed. Looking at next daily support around 1.81500

TEM - what do you see ?I love this stock, so much momentum and good follow through.
I see it's ready for a strong rally. I've huge position via shares and Aug calls

S&P500 INDEX (US500): Bullish Trend Continues
US500 updated a higher high this week, breaking a resistance
of a bullish flag pattern on a daily time frame.
I think that the market will rise even more.
Next goal for the bulls - 6359
❤️Please, support my work with like, thank you!❤️
I am part of Trade Nation's Influencer program and receive a monthly fee for using their TradingView charts in my analysis.

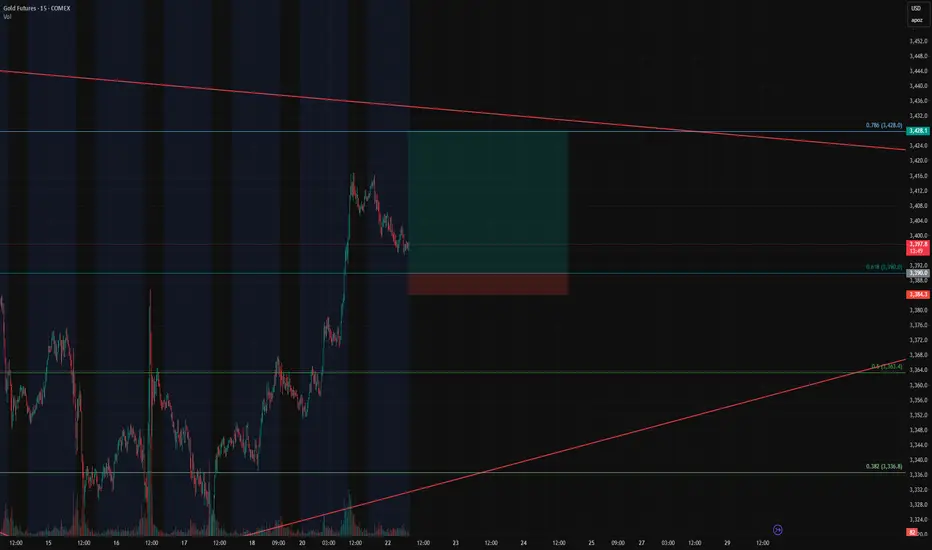
Gold Futures Long Setup – Breakout Continuation off the 0.618 FiGold Futures Long Setup – Breakout Continuation off the 0.618 Fib
Instrument: Gold Futures – COMEX ( COMEX:GC1! )
Timeframe: 15-Minute
Trade Type: Long – Breakout Continuation
Entry Zone: 3390 (0.618 Fibonacci retracement)
Take Profit: 3428 (0.786 Fib)
Stop Loss: 3384
Risk/Reward Ratio: 6.68
Setup: Bullish Flag on Retest
🔍 Trade Thesis
This trade is part of an ongoing breakout continuation strategy we've been trading, and now we're eyeing a pullback entry as price returns to a key retracement level.
Price nearly exploded through the 0.618 Fibonacci level (3390) during the prior breakout.
Now it's pulling back in a textbook bullish flag formation, suggesting healthy consolidation before the next leg.
The 0.618 retracement is aligning with previous intraday structure and trendline support — making this an ideal level to scale in.
This is a high R:R continuation play, with targets set at the 0.786 Fib level (3428) — right before macro resistance kicks in.
🎯 Entry & Exit Strategy
Entry: As price touches 3390 or forms bullish confirmation at the level.
Stop Loss: 3384 – tight and below key fib/flag structure.
Target: 3428 – based on 0.786 Fib extension and breakout continuation projection.
📊 Why This Works
Breakout behavior: Price respected the breakout impulse and retraced cleanly into a bull flag.
Fib confluence: 0.618 pullbacks are a classic entry in trending markets.
R/R of 6.68: Excellent reward profile vs. limited risk.
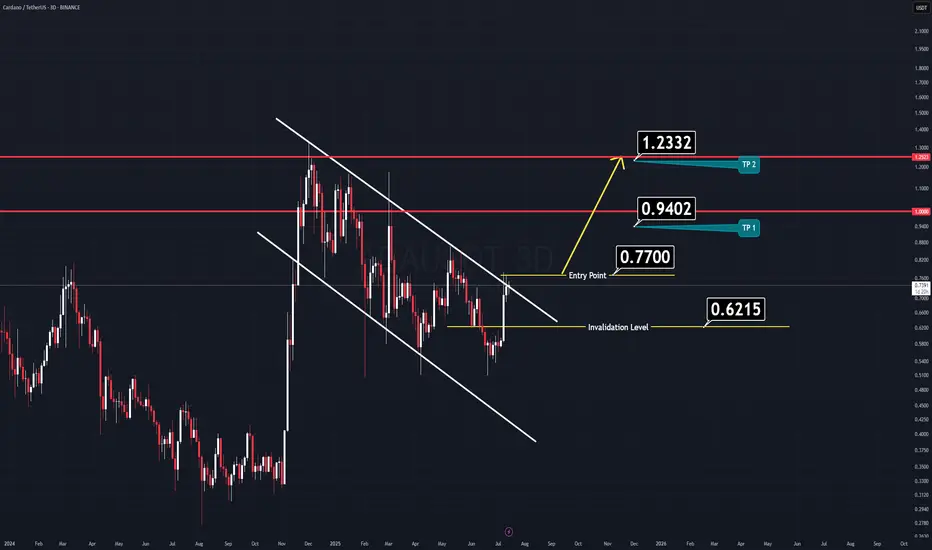
ADA Analysis (3D)Here’s another clean and straightforward chart, this time on Cardano (ADA).
ADA has formed a large flag pattern, which looks poised for a breakout soon.
Just like the previous setup, nothing complicated here.
✅ Entry Idea:
Consider entering when the price breaks above the previous daily candle’s high.
All the key levels are already marked on the chart for easy reference.
Keep it simple,
Good Luck.
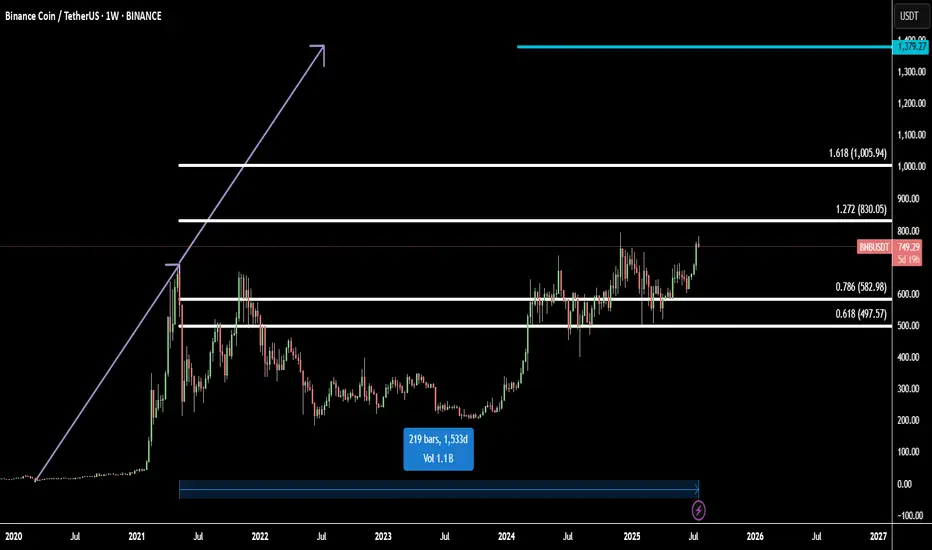
BNB Ready for All-Time High: Fibonacci + 1533-Day FlagBinance Coin (BNBUSD) is setting up for a major breakout, approaching its all-time high with strong momentum.
Technically, BNB has completed a 1533-day flag accumulation — a rare, long-term fractal consolidation that often precedes explosive moves. This massive base acts as a launchpad for the next bullish leg.
Using Fibonacci extensions, we identify two major upside targets:
Target 1: 1.272 Fib – 830.05 - the first resistance and profit zone
Target 2: 1.618 Fib – 1005.94 - key bullish extension from breakout range
Final Target: 1379.27
The final target is projected using fractal symmetry from previous bullish expansions, aligning with the broader market cycle and BNB’s historical price action.
This setup suggests a high-probability move toward new all-time highs and beyond, supported by strong technical structure and breakout energy.
Bitcoin Breakout Bonanza - Ride the Wave, BroYo, check this Bitcoin chart, fam! We’re sittin’ at 107,725, and it’s lookin’ like a wild ride. That break above 127,725 is screamin’ bullish—time to ride the blue arrow up! But watch out, a drop below could send us crashin’ to 107,475 with that red arrow vibe. Stay sharp, dude!

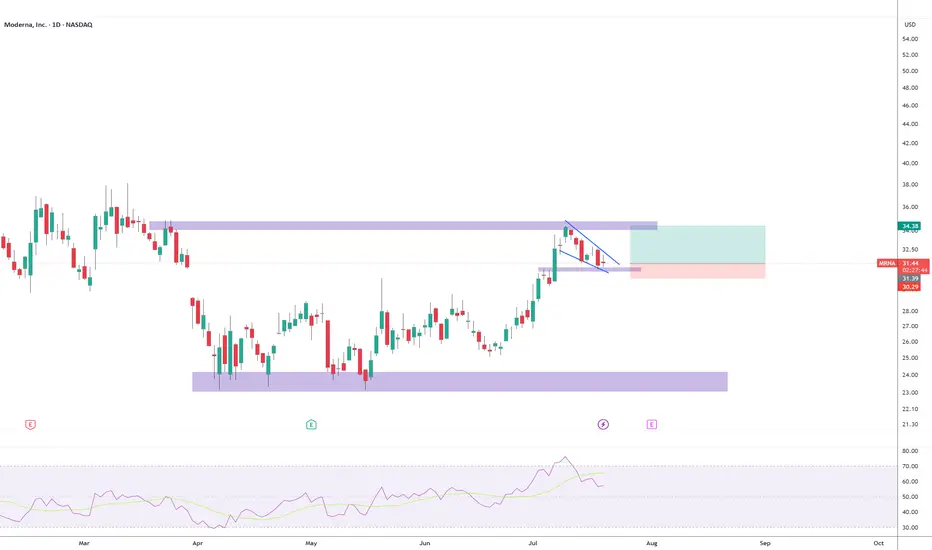
Retest comingBullish flag forming to test the ~$35 resistance again. Earnings coming up on 08/01. I expect the flag breakout before earnings. I have calls exp 08/01 strike 31.5. SL triggers if a daily candle breaks down the support area and closes below 30.30.
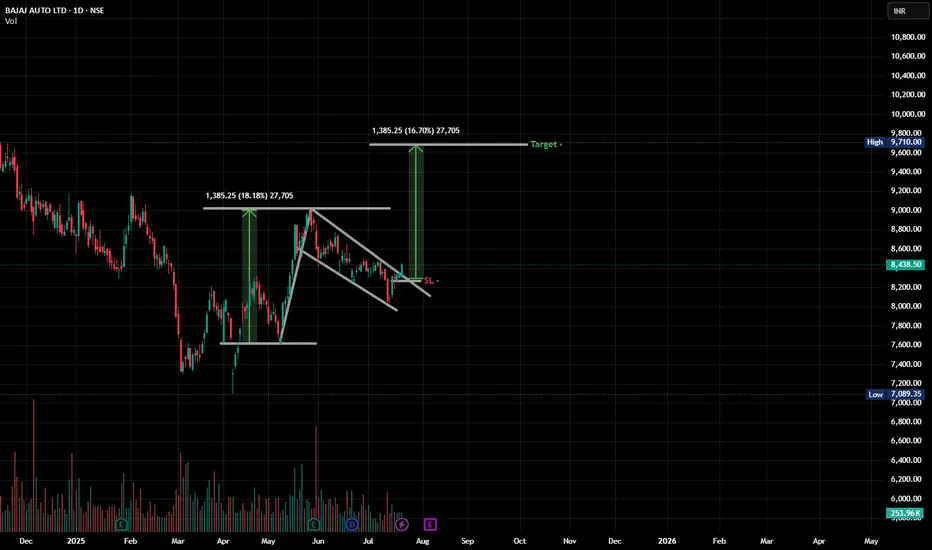
Ohohoho Pole and flag i see there!NSE:BAJAJ_AUTO Just did a noice breakout of a pole and flag there. minimal SL and a good enough target. 9020 may be a resistance
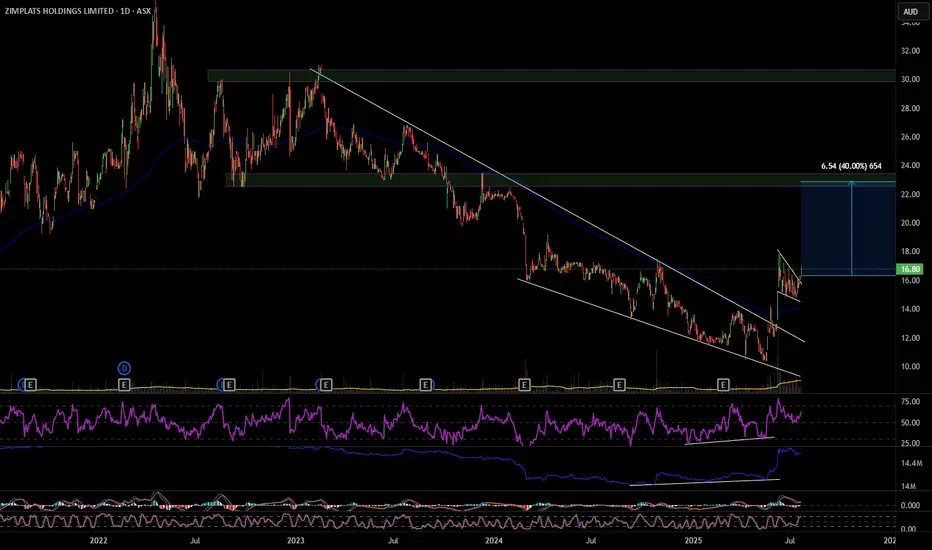
ZIM 40% move up
ZIM has broken out of a descending wedge with bullish RSI and OBV divergence, also multiple divergences on smaller time frames. On the hourly it's had a pull back and formed a bull flag that it has also broken out of. ZIM looks to have formed a change of structure forming higher highs and higher lows, my first target will be $22.90 a move of 40%. Definitely one to consider. Good luck and happy trading 🍀
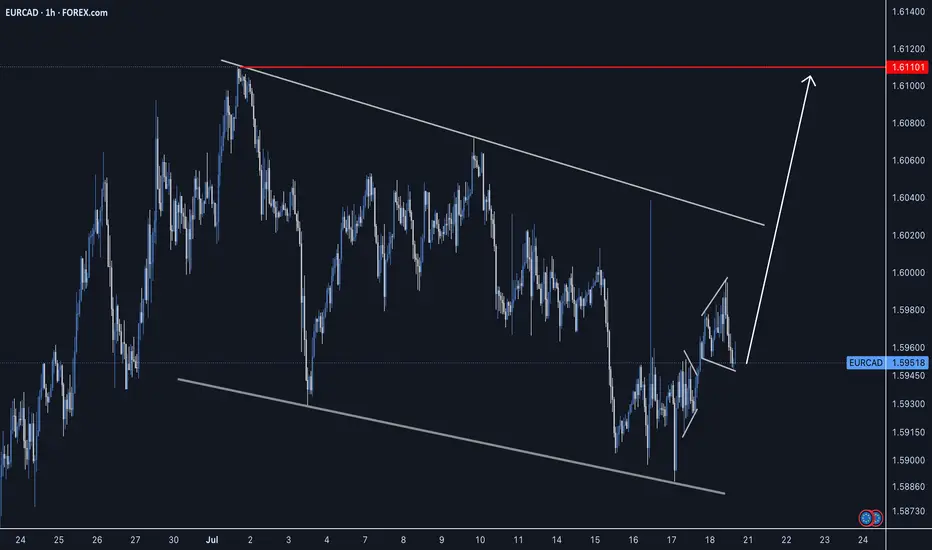
EURCAD - Long Setup - Impulse, Correction, ImpulsePrice action has been setting up for the next impulse phase as we can the bullish continuation is completing to indicate price has further growth. Looking for a long entry this upcoming week.
Good Luck