EURNZD with bullish flag patternbefore this bullish pattern, it can be seen that price action made a channel in which it made HHs and HLs, and then a flag pattern appeared. Now, the price is breaking flag in upward direction and if this breakout is real a bullish rally can be seen
Flag

TSLA (daytrading) break out and retest1. Still watching here (down trend is too strong)
We can see break out patterm
2. And came back to restest. But i worry about that tsla usually doesnt restest like that.
3. Hit sma 200 h1

Gold Trade Setup – Bullish Flag Pattern🧠 Gold Trade Setup – Bullish Flag Pattern
📍 Pattern: Bullish Flag
📉 EMA 50: Acting as dynamic support
💰 Current Price: $3,333
📈 Bias: Bullish continuation
🟢 Trade Plan: Long Position
🔼 Entry: Around $3,333 (confirmed breakout from flag)
🎯 Target: $3,365
🛑 Stop Loss: $3,323
📊 Risk–Reward Ratio: ~1:3.2 → favorable setup
🔍 This Works:
Price breaks out of a bullish flag, a strong continuation pattern.
EMA 50 supports the trend, confirming momentum.
Room to run up to $3,365 resistance zone if momentum holds.

Bear Flag Completed?This pattern in stock trading is called a bear flag, right?
Here's why:
Prior Downtrend (Flagpole): You can see a significant downward move leading into the pattern, which forms the "flagpole."
Consolidation/Correction (Flag): After the sharp drop, the price enters a period of consolidation within a defined, upward-sloping channel (or sometimes a rectangle). This forms the "flag" portion. It's a temporary counter-trend move where the bears take a breather.
Breakdown (Continuation of Downtrend): The price then breaks out of the lower boundary of the flag pattern, continuing the prior downtrend with renewed momentum.
Bear flags are considered continuation patterns, meaning they suggest that the preceding trend (in this case, a downtrend) is likely to continue after the pattern completes.
Is there a chance a reversal will follow the completed flag?

SOLUSDT Testing Resistance With Bullish Flag — Breakout in SightSOL is pressing against horizontal resistance after bouncing cleanly off trendline support twice (Rejection 1 & 2). Price action is now coiling inside a potential bullish flag — a breakout above $153 could send SOL toward $158 and beyond 🚀
📍 Bullish Scenario: Break above the flag → momentum toward $158
📍 Bearish Scenario: Break below trendline support → revisit $146
This post is for educational purposes only — not financial advice.
#SOL #Crypto #TechnicalAnalysis #BullishFlag #BreakoutSetup #TradingView #QuantTradingPro

XRP is ready ?XRP has been consolidating since last high from Jan this year. MACD shows that the momentum is picking up and I see it is ready for next move.
A weekly close will confirm it.

bullish flag emergingthis just an experimental idea help me with your knowledge feel free to comment and hope your portfolio to be green today

CRUDE OIL (WTI): Move Up Ahead!
Last week, I already shared a bullish setup on WTI Crude Oil
on a daily time frame.
I see a strong intraday bullish confirmation today.
After a test of an underlined blue support area,
the price went up strongly and violated a resistance line
of a bullish flag pattern on a 4H time frame.
The market is going to rise more.
Goal - 68.2
❤️Please, support my work with like, thank you!❤️
I am part of Trade Nation's Influencer program and receive a monthly fee for using their TradingView charts in my analysis.

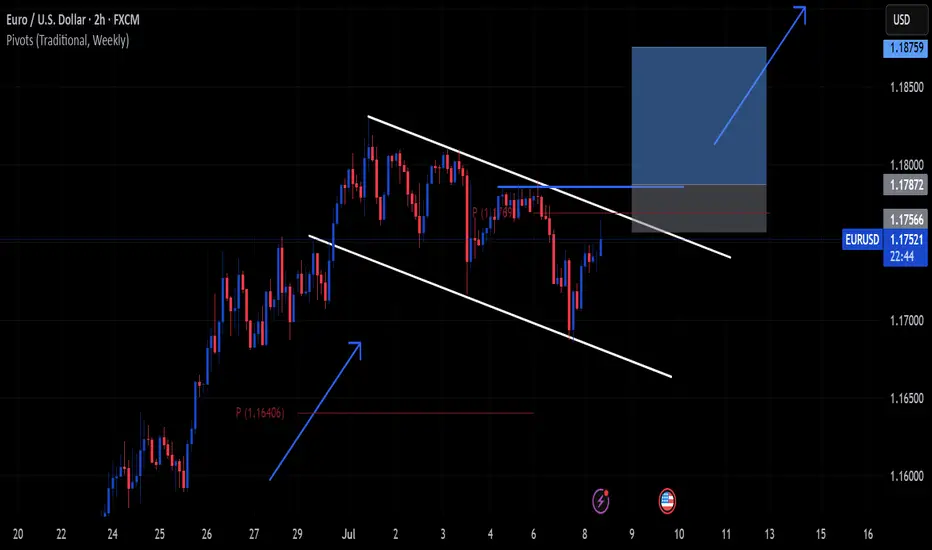
Where the coffee is strong (EUR/USD)Setup
EUR/USD is in a strong uptrend and recently broke above multi-year resistance just under 1.16. The pair looks to be targeting long term resistance at 1.23.
Signal
RSI is dropping back from overbought territory on the daily chart, offering a possible dip-buying opportunity above resistance-turned-support at 1.16.

EURJPY: Bullish Outlook Explained 🇪🇺🇯🇵
There is a high chance that EURJPY will continue rising
from an underlined horizontal support.
I see 2 strong price action confirmations:
the price violated a resistance line of a bullish flag
and a neckline of a double bottom pattern.
Goal - 170.4
❤️Please, support my work with like, thank you!❤️
I am part of Trade Nation's Influencer program and receive a monthly fee for using their TradingView charts in my analysis.

MarketBreakdown | USDJPY, USDCAD, BITCOIN, SILVER
Here are the updates & outlook for multiple instruments in my watch list.
1️⃣ #USDJPY daily time frame 🇺🇸🇯🇵
The market nicely respected a rising trend line
and bounced from that, forming a high momentum bullish candle.
I think that the pair will continue rising and reach 145.8 level soon.
2️⃣ #USDCAD daily time frame 🇺🇸🇨🇦
The price is currently approaching an important confluence
zone based on a falling trend line and a horizontal support.
I will expect a pullback from that.
3️⃣ #BITCOIN #BTCUSD daily time frame
The price successfully violated a resistance line of a bullish
flag pattern and closed above that.
It is a critical bullish signal. I believe that the price will test
a current high then and will violate that with a high probability.
4️⃣ #SILVER #XAGUSD daily time frame 🪙
The market broke a resistance line of a bullish flag.
Uptrend is going to continue, and the price is going to reach 37,14 level soon.
Do you agree with my market breakdown?
❤️Please, support my work with like, thank you!❤️
I am part of Trade Nation's Influencer program and receive a monthly fee for using their TradingView charts in my analysis.

EIHotel,1W , Bullish it has formed a flag Pattern and ready to breakout of pattern , wait until weekly strong close and take the trade with proper risk management and proper position sizing .
Follow for more Swing Ideas Like this

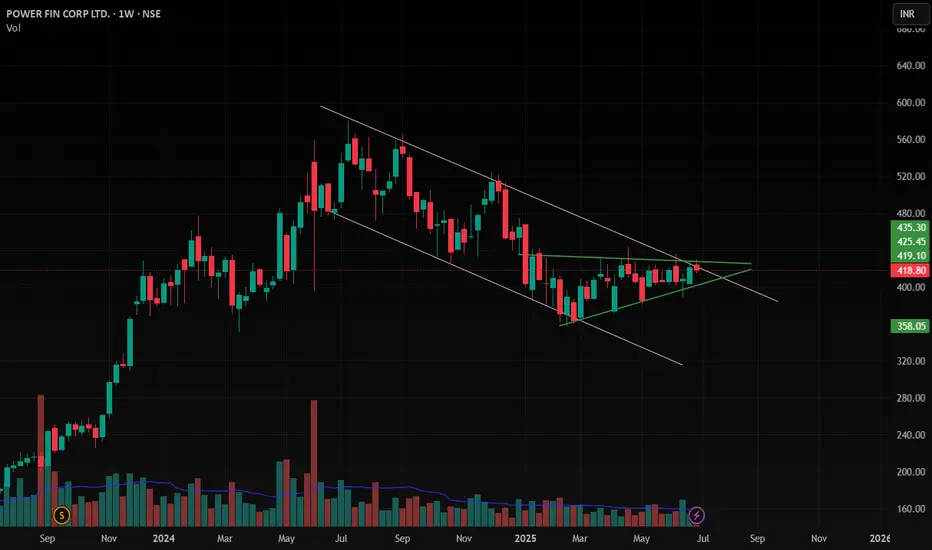
PFC , 1W , Bullishit has formed a Very Good Pattern and Ready to giving a Breakout and Wait patiently for Weekly close , after that enter into Trade , follow proper position sizing and follow risk management
follow for more Swing Ideas like this
AjantaPharma ,1W , Bullish it has Formed a Very Good Pattern in Weekly and giving Breakout ,Take the Trade after Strong Weekly Close and put the Sl below its Swing low and Follow Proper Risk Management
Follow for More Swing Ideas like this

Ultracemco , 1W , Bullish As Ultracemco is Formed pattern and giving Breakout Now , Watch Carefully after Weekly Confirmation and Take Trade and follow proper Position Sizing and Risk according to your account size
follow for More Swing Ideas like this

RSKD - breakout confirmed, now waiting for retestRiskified (RSKD) shows a textbook breakout setup: daily triangle plus 4H bullish flag. Price already broke out and is now retesting the 0.618 Fibonacci retracement at $5.21, which also matches the flag resistance flip and EMA cluster. This is a clean buy zone with strong technical alignment.
Volume spiked during the breakout, trend structure remains intact, and moving averages are converging — usually a precursor to strong moves. The current pullback is orderly, and if buyers show strength on this retest, the price could target $6.00, then $6.54, and potentially $7.25 (1.618 extension).
Fundamentally, Riskified offers fraud prevention tech for e-commerce. The business is benefiting from global growth in online transactions and improved margin control. While still unprofitable, recent quarters showed progress toward positive operating leverage and strong client acquisition.
Tactical plan:
— Entry on confirmation from $5.21 retest
— TP1: $6.00
— TP2: $6.54
— TP3: $7.25
— SL: below $4.90 or $4.43 support zone
You’ve been watching this one. The triangle broke. The pullback is clean. Maybe it’s time to stop watching and start participating.

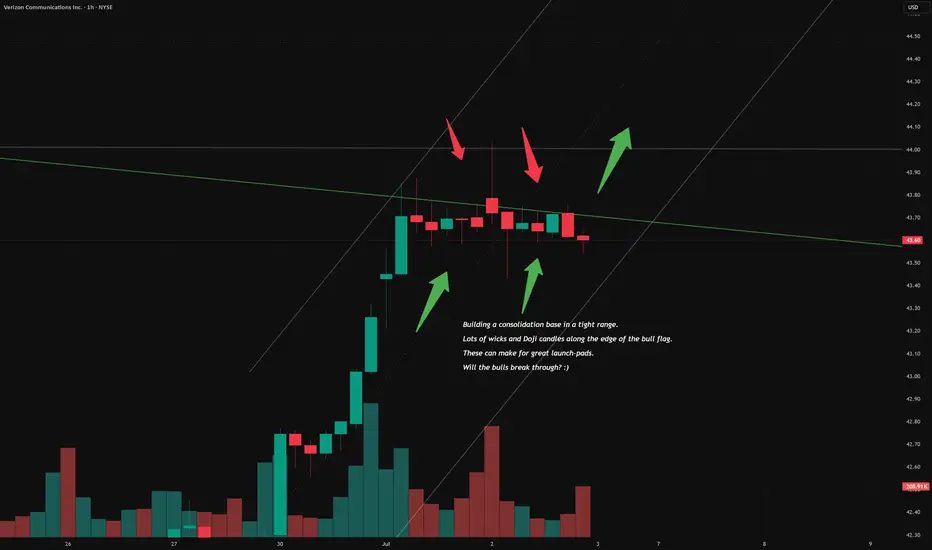
The battle has begun for VZ glory.Just taking a look at the hourly chart and it looks like the bulls broke through resistance, but the bears were able to push them back, for now at least. Every time the bears push the price down, the bulls push it right back up to the edge.
This is bullish IMO. It gives bears less liquidity to slow down the move upwards when the range is so tight. It will be interesting to see how things unfold.
Watch for high volume at the end of the session.
"The clock is ticking bears. Join us! JOIN THE LIGHT! DO IT FOR GLORY!" 🤣
AUDCHF: Bullish Flag from PRZ — Rally to 0.54444?AUDCHF ( OANDA:AUDCHF ) bounced from the Potential Reversal Zone (PRZ) , which aligns with the Yearly Support(1) and the 50% Fibonacci level of the previous bullish impulse.
From a Classic Technical Analysis perspective , AUDCHF appears to be breaking out of a Bullish Flag Pattern , which may suggest the continuation of the previous uptrend .
This bullish reaction also confirms the importance of the Support zone(0.51166 CHF-0.49773 CHF) , where buyers stepped in aggressively.
In terms of Elliott Wave theory , it seems that AUDCHF has completed the bearish waves and we should wait for the bullish waves .
I expect AUDCHF to continue rising after a successful breakout from the flag’s upper boundary . If momentum sustains, the target could be around 0.54444 CHF .
Note: Stop Loss (SL) = 0.51972 CHF
Australian Dollar/ Swiss Franc Analyze (4-hour time frame).
Be sure to follow the updated ideas.
Do not forget to put a Stop loss for your positions (For every position you want to open).
Please follow your strategy; this is just my idea, and I will gladly see your ideas in this post.
Please do not forget the ✅ ' like ' ✅ button 🙏😊 & Share it with your friends; thanks, and Trade safe.

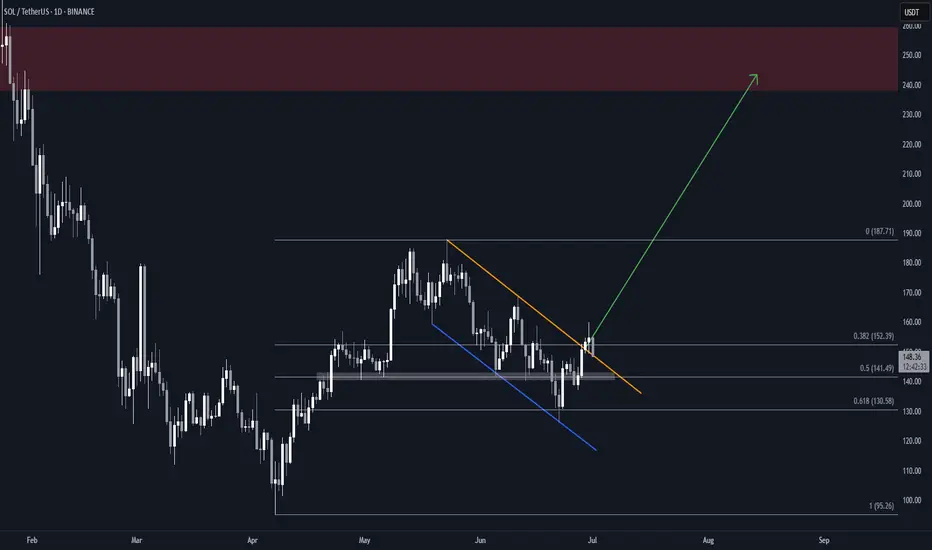
Solana (SOL) Flag & Pole Breakout (1D)BINANCE:SOLUSDT broke out of a textbook falling wedge two days ago, and is now retesting the former resistance as support.
Key Technicals
• Falling channel with clean structure and multiple touches
• Resistance trendline broken
• Price now retesting the breakout zone (~$148)
• Overhead supply zone at $238–$260
• Measured Target: $240, within supply
Why This Setup Matters
• Clear breakout followed by a retest, which can often precede the next leg up if support holds
• Falling channel retracement aligns with 0.618 Fib, a common reversal area
What to Watch
• Daily close above the previous resistance trendline
• Push above the local $160 high for full confirmation
GBPUSD: Bullish Continuation Ahead.The GBPUSD has established a typical bullish trend following pattern.
Following a significant upward movement, the price entered a correction phase within a bullish flag.
Breaking above the resistance line serves as a strong indicator of continued upward momentum.
I anticipate that the pair could reach the 1.3800 level.

WIF back to $3Complete look at Dog WIF Hat
We had some pretty nice technical setups on this meme.
#HVF
#DoubleTop
#InverseHeadandShoulders
#BullFlag
Currently it has two active patterns ...

Nifty is Bearish for next week. But Why ? "Ask me in comments".Nifty is facing resistance at this level for a specific reason. this week it can be bearish and continue to go down side.
