BTC is expected to give move by mid or end of July 2025BTC is expected to make a move by mid or end of July 2025
BTC is forming a Bullish Flag Pattern, and it is expected to give a breakout from this flag, by mid or end of July.
Flag

BTCUSD 1D | big consolidation
🧠 1. Pattern and Market Structure Identification
✅ Trend and Pattern: Bullish Flag
• Structure: Price forms a descending consolidation pattern (descending channel) after a sharp upward impulse — this is a classic characteristic of a bullish flag.
• Breakout volume occurred from the consolidation zone near the green support area → an early signal that bulls are active.
• However, the price is currently retesting the breakout area and is testing the demand zone again.
📊 2. Volume Analysis
• Volume spikes (purple arrows) occurred at several key points:
• Initial breakout
• Support retest
• High volume during the breakout = valid breakout confirmation.
• Currently, volume is slightly declining = a signal of consolidation and possible accumulation.
📉 3. Support & Resistance Levels
• Strong Support: 96,961 USDT (marked by the blue line and breakout volume).
• Major Resistance: 111,980 USDT (all-time high and projected target from the flag breakout).
• Current Price: 103,272 USDT → sitting between these two key levels.
🎯 4. Potential Price Direction
Bullish Scenario:
• If the 96,961 USDT support holds, price could continue upward → the bullish flag target = projected height of the flagpole.
• Conservative Target: 111,980 USDT (ATH)
• Aggressive Target (if ATH breakout occurs): 115,000+ USDT
Bearish Scenario:
• If price breaks below 96,961 USDT with strong volume, it could invalidate the bullish pattern and drop further to the 92,000 – 90,000 USDT range.

GOLD (XAUUSD): Technical Analysis & Important Pattern to Watch
For some known reason, Gold remains bearish this entire week.
The market is currently correcting within a falling channel - a bullish flag on a 4H time frame.
Ahead, I see a bunch of strong intraday supports.
From one of these structures, a bullish rally may resume.
A trigger that you should look for is a bullish breakout of
a resistance line of the flag and a 4H candle close above that.
A bullish continuation will be expected then.
❤️Please, support my work with like, thank you!❤️
I am part of Trade Nation's Influencer program and receive a monthly fee for using their TradingView charts in my analysis.

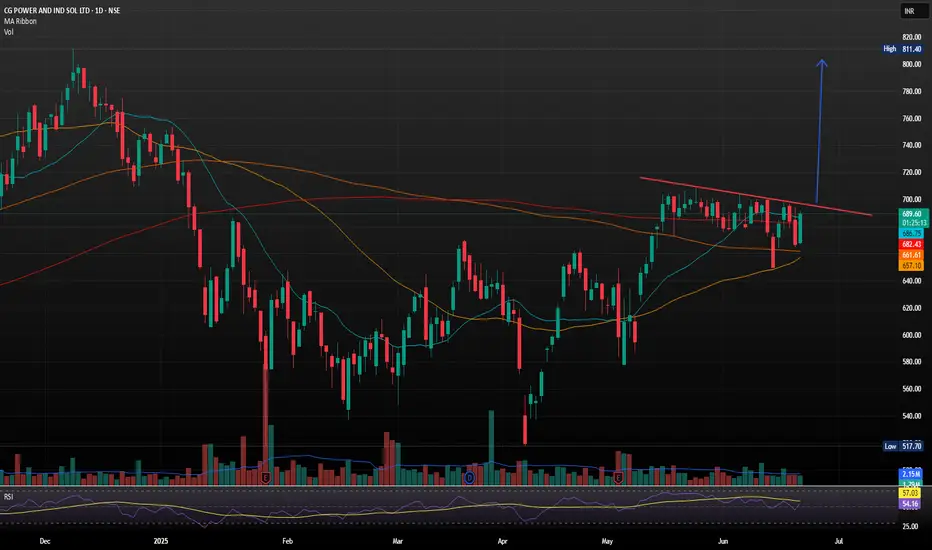
CG Power and Industrial Solutions with Strong Bullish Flag SetupCG Power and Industrial Solutions just landed its largest-ever single order a 641 crore contract from Power Grid Corporation of India Ltd (PGCIL) for high-voltage transformers and reactors
The company, now under the Murugappa Group, reported consolidated FY25 revenues of 9,909 crore. However, annual profit dipped to 972.98 crore from 1,427.61 crore in FY24, despite a strong Q4 showing with a 17% YoY rise in net profit to 274.26 crore.
- Inverse Head & Shoulders Breakout: The stock recently broke out of an inverse H&S pattern, a classic bullish reversal signal, with strong volume confirmation. Holding above 690 could push it toward 750 TO 800.
Support & Resistance Levels
- Support: 663–679 demand zone
- Resistance: 694, 704 and 712
Trend Summary
- Short-Term: Neutral to bullish
- Medium-Term: Bullish bias if it sustains above 690
- Volatility: Elevated, so expect sharp swings
USDCHF || Grab trade before its end" – Upgrade Suggestions:" USDCHF correcting into demand zone 📉 Wave (C) incoming! Watch for the final leg before the reversal. Don’t miss this precision setup. 💥 #ElliottWave #USDCHF #ForexSetup"
🟢 Technical Breakdown:
Triangle Formation (ABCDE) completed near the top.
Price action shows a breakdown from Wave (B), suggesting a corrective leg is underway.
You’ve marked:
Wave (A) and (B) already formed.
Wave (C) is expected to reach the highlighted demand zone (blue box around 0.81000).
The current price is around 0.81633, indicating an ideal entry area for a short setup targeting the blue zone.

Imbalance, FVG & Short Trend Flag Strategy / Estrategia basada..*************************
* ENGLISH VERSION *
*************************
This analysis blends institutional structure with price action to identify high-probability zones on AMZN.
🔍 Setup Structure:
Imbalance breaks PH/L of the trend: Confirmation of institutional strength breaking a Previous High or Low, creating a liquidity imbalance.
Short Trend Flags: A corrective flag pattern within the impulse move, signaling continuation until the Fair Value Gap (FVG) is filled.
FVG Closure: Validates key zones where price must return to restore market balance.
IFVG: Institutional Fair Value Gap that also needs to be closed, showing deeper order flow activity.
Key Resistance & Support Zones: Act as liquidity magnets where price often reacts.
9:30am Opening Candle Against the Trend: This candle acts as a liquidity trap and potential reversal trigger.
🧠 Technical Notes:
FVG and IFVG used as targets and reaction zones.
Confirmation through opening volume and candlestick behavior.
Flags serve as entry triggers in trend direction.
🎯 Perfect for scalpers and day traders who trade clean structure with multi-layered confirmations (structure + liquidity + reaction).
*************************
* SPANISH VERSION *
*************************
Este análisis combina estructuras institucionales con acción del precio para identificar zonas de alta probabilidad en AMZN.
🔍 Estructura del Setup:
Imbalance rompe PH/L de la tendencia: Confirmación de fuerza institucional al romper un Previous High/Low, generando desequilibrio de liquidez.
Short Trend Flags: Patrón correctivo dentro del impulso que sirve como señal de continuación hasta cerrar el FVG (Fair Value Gap).
Cierre de FVG: Validación de zonas de interés donde el precio debe retornar para balancear el mercado.
IFVG: Imbalance Fair Value Gap que también necesita ser cerrado, indicando profundidad institucional.
Zonas clave de resistencia y soporte: Actúan como imanes de liquidez donde el precio suele reaccionar.
Apertura 9:30am contra la tendencia: Vela que actúa como trampa de liquidez y posible gatillo para reversión.
🧠 Notas Técnicas:
Uso de FVG y IFVG como targets y zonas de reacción.
Confirmación con el volumen de apertura y comportamiento de las velas.
Flags como patrón de entrada para seguir la dirección dominante.
🎯 Ideal para scalpers y day traders que siguen estructuras limpias con validaciones múltiples (estructura + liquidez + reacción).

weekly BULL-FLAG!it looks like after the rally bitcoin had since early April, now this is a bull-flag pattern on weekly and that can push bitcoin to $140k.


USDJPY – 4H . [[ TRIANGLE PATTERN ]]Technical Breakdown:
Symmetrical triangle pattern clearly formed with clean ABCDE wave structure.
The price has broken out from the upper resistance (trendline), confirming a bullish breakout scenario.
Next key area to watch is the supply zone near 145.800 – 146.200, where price may either:
Face resistance and retrace,
Or break through for continuation.
---
🔍 Key Levels:
Support Base (Retest zone): ~143.000
Breakout Entry Trigger: Above 144.200
Supply Zone Target: 145.800 – 146.200
Invalidation Level (Break Below Triangle): <142.500
---
🧠 Analysis Insight:
This is a classic triangle consolidation breakout, with price respecting both ascending and descending boundaries before thrusting upward.
Look for possible pullback retest entries before continuation to the supply zone.
Volume and momentum confirmation on breakout is key for sustainability.
---
🎯 Strategy Note:
Use low-risk entry setups on breakout retest.
Ideal for scalp to swing trades, with strong risk-reward structure.

EURGBP making bullish flag patternas price has broken drawn resistance level and after that it moved upwards nicely and now the price action is making bullish flag pattern as currently there is no divergence which indicate the trend will likely continue and will hit next resistance level which is also price projection of flag pattern

BTC Dominance Looking very bullish CRYPTOCAP:BTC.D should go up towards 66% and expect the CRYPTOCAP:OTHERS to take a hard dump. Bull flag pattern in the short term.

BRENT CRUDE OIL Long Positionafter making a high of 76.45 brent has posted a potential HL t 71.3 and now forming a bullish flag if it breaks the pole then it can futher go high, we will make entry at 76.5 at pole breakout by making SL at 71.3 nd TP at 81.7

Retest Flag and Continue Breakout $3500I think this pullback mainly driven by middle east uncertainty is a great gift to buy the pullback on BITSTAMP:ETHUSD

#banknifty - 10th June! NSE:BANKNIFTY NSE:BANKNIFTY1!
Understand the chart, observe the analysis, implement while trading:
Key Observations:
1. Trendlines:
- Resistance Trendline: A descending trendline (sloping down) marks the area where the price faces selling pressure. This indicates a pattern of lower highs.
- Support Trendline: An upward-sloping trendline beneath the price indicates where the price finds buying interest. This suggests a slight upward momentum at the support level.
2. Consolidation Zone:
- The price is moving within a tightening range between these two trendlines, forming a wedge or triangle pattern. This indicates consolidation, where the market is waiting for a breakout or breakdown.
3. Support Levels:
- Key support levels are highlighted at 53,407.75, 53,229.05, 53,057.45, and 52,784.15. These levels represent zones where buyers are likely to step in and prevent further price decline.
4. Resistance Levels:
- Resistance levels are marked at 53,679.35, 53,956.65, 54,128.90, and 54,304.25. These are zones where the price may face selling pressure.
5. Current Price Action:
- The price is currently at 53,577.70, approaching the descending resistance trendline. This is a critical point because it suggests a decision zone for the next move.
Scenarios:
1. Bullish Breakout:
- If the price breaks above the descending resistance trendline, it could signal bullish momentum.
- Potential targets are the next resistance levels at 53,956.65, 54,128.90, and 54,304.25.
2. Bearish Breakdown:
- If the price breaks below the support trendline, it may indicate a bearish trend.
- Possible downside targets are the lower support levels at 53,229.05, 53,057.45, and 52,784.15.
3. Neutral Consolidation:
- If the price continues to move within the wedge, traders may need to wait for a clear breakout or breakdown before acting.
What This Chart Suggests:
- The chart highlights decision points for the market, with the wedge pattern indicating an imminent breakout or breakdown.
- A breakout above resistance would suggest strength, while a breakdown below support would indicate weakness.
Trading Plan:
- For Buyers: Wait for a breakout above the resistance trendline and aim for higher resistance levels.
- For Sellers: Look for a breakdown below the support trendline and target the lower support zones.
Not SEBI Registere.

Bitcoin - Breakout incoming towards $115k?Introduction
Bitcoin (BTC) has been consolidating just below a key resistance level over the past several days. This period of sideways movement, without any significant pullbacks, reflects notable strength in the market. Such price behavior often precedes a strong directional move, and in this case, the technical setup continues to favor the possibility of a bullish breakout.
1H BullFlag Pattern
On the 1-hour timeframe, BTC is forming a well-defined bull flag pattern, which is typically a bullish continuation signal. This flag began to develop after BTC surged from approximately $105,000 to $110,000, creating the flagpole that represents the initial wave of upward momentum.
Since that move, price has entered a consolidation phase, forming the flag portion of the pattern with declining volume and tighter price action. If BTC breaks out above the upper boundary of this flag, the measured move target projects a rally toward the $115,000 level. Reaching this target would represent a new all-time high for Bitcoin, signaling a continuation of the broader uptrend.
4H Fair Value Gap (FVG), Downside Scenario
Although the overall structure favors a bullish outcome, it is important to acknowledge the potential for a short-term retracement. On the 4-hour chart, there is a Fair Value Gap (FVG) between $105,700 and $106,800. If BTC fails to break out immediately, this zone becomes a logical area to monitor.
Price may revisit this imbalance to fill the gap left behind by the recent upward move. A dip into this area could present a strong opportunity for long entries, particularly if buyers step in with conviction. Filling this FVG would allow for a more balanced structure before BTC attempts a sustained move higher.
Conclusion
BTC continues to show impressive resilience as it consolidates near its prior highs. The presence of a bull flag on the lower timeframes, coupled with minimal downside volatility, suggests that a breakout above resistance is becoming increasingly likely.
However, reclaiming the previous all-time high remains a critical step before targeting the projected $115,000 level. How BTC reacts to that key resistance area will provide important insight into the strength of this rally.
At this stage, the bullish case remains the higher probability scenario, while any short-term pullback into the FVG zone could offer a healthy reset and a potential long setup for continuation toward new highs.
Thanks for your support.
- Make sure to follow me so you don't miss out on the next analysis!
- Drop a like and leave a comment!

Lemonade Inc.: Breakout in Motion — Cup, Flag, and No BrakesLemonade Inc. (LMND) is accelerating after a clean breakout from a textbook cup with handle pattern, where the handle formed as a tight bullish flag. The breakout occurred around $32, and since then, price action has been sharp, controlled, and uncorrected — currently trading at $42.42 with buyers clearly in charge.
On the fundamental side, LMND is moving through a recovery phase: operational losses are narrowing, revenue is stabilizing, and the company is aggressively leveraging AI to automate its insurance processes. Expansion into Europe continues, and institutional interest is visibly rising — confirmed by volume building alongside price. Within the insuretech sector, LMND is starting to look like a comeback story rather than a cautionary tale.
Technically, the setup remains strong:
– Golden Cross confirmed (EMA50 crossing EMA200)
– EMA50/100/200 all below price — bullish structure firmly intact
– Volume expanding on up-days — healthy confirmation
– RSI hovering in the 60–65 range — momentum is intact, no signs of exhaustion
Targets remain aligned with the structure:
– tp1 = $64 — measured move from the flag
– tp2 = $94 — full realization of the cup pattern
Tactically, this is no longer a “wait and see” setup — the move is in progress. No correction so far, only continuation. Momentum traders may consider entries into strength. Above $45, the move could accelerate further as more participants recognize the structure.
LMND is showing technical and fundamental alignment — confirmed breakout, improving narrative, and strong trend structure. While the impulse holds, this chart favors continuation, not hesitation.

Natural Gas Flag PatternPurely based on flag pattern. According to flag pattern outbreak somewhere end of June. Just an opinion, NG always does his own thing.
TP1: 4.00
TP2: 4.40
TP3: 4.80
SL: 3.35

PNUT/USDT – Bullish Breakout from Falling Channel!PNUT Breakout Alert – 200% Potential on the Table
Hey Traders — if you're into high-conviction setups with real momentum, this one’s for you.
PNUT has officially broken out of a textbook falling channel after a healthy consolidation. This pattern often signals trend reversal and renewed bullish momentum — and PNUT looks ready to move.
🔹 Pattern: Falling Channel
🔹 Breakout Confirmation: Clear candle close above resistance
🔹 Previous Move: +204% before entering the channel
🔹 Current Setup: Long entry with defined risk-to-reward
🔹 Target: ~0.85
🔹 Stop: Just below the breakout zone
🧠 Technical Perspective:
Volume uptick during breakout confirms buyer strength
Strong support retest zone around 0.28–0.29
Holding above this range could fuel a significant leg higher
📌 This setup offers a clean structure with a high R:R potential. PNUT has proven it can move fast — now it’s about following the breakout with tight risk management.
📥 Add to your watchlist and let price action lead the way.

Ethereum breaking out!Two days ago, I've posted that we're most likely trading in a 2K-4K range on Ethereum. There was a slight deviation below 2K but the bulls swiftly regained control.
As for now, it's seems obvious we are heading towards, at least, 3K. I'm confident 4K is on the horizon, though I prefer to take it level by level.
ETH is breaking out off this bull flag and this chart looks more and more like one of those charts you study in textbooks.

USDJPY: Strong Intraday Bullish Price Action 🇺🇸🇯🇵
On the today's live stream, we discussed a very bullish setup
on USDJPY.
The price retested a recently broken horizontal resistance.
A resistance line of a falling wedge pattern was violated with
a strong bullish movement then.
We see its retest at the moment.
I think that the price will resume growth soon and reach 145.25 level.
❤️Please, support my work with like, thank you!❤️
I am part of Trade Nation's Influencer program and receive a monthly fee for using their TradingView charts in my analysis.

AUDCAD Buys ContinuePrice has finally broken out of the H4 resistance. Waiting on retest to continue the buys. Also have a bullish flag pattern that formed.

TOST getting toastyTOST Technical Analysis (Breakout Setup):
Current Pattern: Bull flag forming after a strong breakout from the $40.50 zone with increasing volume.
Resistance: $44.33 – key level to break for momentum continuation.
Support levels:
$42.00 (top of previous consolidation zone)
$40.55 (bull flag base and breakout pivot)
Ideal Breakout Play:
Watch for breakout above the flag’s upper trendline, ideally clearing $44.33 with volume.
A daily close above $44.33 confirms continuation — target $47–48 short-term, with potential run to $50 psychological.
Invalidation:
Break below $40.55 on volume negates the setup, suggesting failed breakout.
Favorable Path:
Consolidate slightly → Break flag above $44.33 → Ride momentum to $47–48. Risk/reward favors long bias above $44.33.
💡 This is a textbook bull flag following a high-volume breakout — high probability if volume confirms the breakout.

ETH on its way to 3000It’s clear we’re currently trading within a range between 2k and 4k on Ethereum.
Although we deviated below 2k, price reclaimed the range with strength, which is very bullish. Over the past few weeks we’ve been consolidating in what appears to be a bull flag, and I’ve been buying anywhere between mid to lower range.
A breakout seems likely soon, with a potential test of the 3000 resistance level
Long and confident
