FLOWUSDT:D1Hi my friends
.Important levels are drawn on the chart
.📢 Please follow your strategy, , this is just my idea
.🙌Please do not forget the ' like' button & Share it with your friends
.✍ I will be glad to see your ideas in this post
.🧲Follow me to see more analysis
FLOW

Flow coin formed bullish Gartley for upto 14% pumpHi dear friends, hope you are well and welcome to the new trade setup of Flow coin with US Dollar pair.
Previously we had a nice trade of Flow:
Now on a 4-hr time frame, AR has formed a bullish Gartley pattern.
Note: Above idea is for educational purpose only. It is advised to diversify and strictly follow the stop loss, and don't get stuck with trade

Flow usdt forecast/ IdeaPlease write any advice or suggestions.
Dear friends, request any cryptocurrency pair, currencies pair for forex, and any index that you want to be analyzed and ask any questions.
Thanks for your attention

Waiting patiently for FLOWOk, today I was thinking to short this just that then I've shorted UNI.
I think that since FLOW dipped around 11% it needs to bounce upward a little bit and then go down. If instead it breaks the support it'll go down right away but in that case I'll lose the train because I do 1 short per time and I'm already shorting UNI.
The chart structure to me looks bearish, I don't think the breakdown will happen today but it'll happen soon I think.
Keep an eye on it

Flow (FLOW) - August 9hello?
Welcome, traders.
By "following", you can always get new information quickly.
Please also click "Like".
Have a good day.
-------------------------------------
(FLOWUSDT 1D Chart)
Resistance: 4.785-5.210
1st support: 2.523-2.980
2nd support: 1.501-1.684
The key is whether it can be supported around 2.980.
If it goes down from 2.980, we should see if there is support in the 2.523-2.980 range.
If it drops from 2.523, you need a Stop Loss to get cash.
------------------------------------------------------------ -------------------------------------------
** All descriptions are for reference only and do not guarantee a profit or loss in investment.
** The MRHAB-T indicator, which is inactive on the chart, contains indicators that indicate support and resistance points.
** Background color of Long/Short-S indicator: RSI oversold and overbought sections
** Background color of CCI-C indicator: When the short-term CCI line is below -100 and above +100, oversold and overbought sections are displayed.
** The OBV indicator was re-created by applying a formula to the DepthHouse Trading indicator, an indicator disclosed by oh92. (Thanks for this.)
(Short-term Stop Loss can be said to be a point where profit and loss can be preserved or additional entry can be made through split trading. It is a short-term investment perspective.)
---------------------------------

FLOWUSDT(FLOW) Daily tf Range Updated till 08-08-22FLOWUSDT(FLOW) Daily timeframe range. look at this chart how clean it looks. not heavily used and not much of out of place moves. even tho volume is not that big in here. a clean chart always less complicated to make trading plan with for any trading setups. there were good amount of swing setups here, there are range setups but scalp setups are not that safe as for volume. fundamentals are upto recent state but devs need to put more work to get it more progressive on the price action.

Will FLOW continue to grow?Hello everyone, let's take a look at the 1D FLOW to USDT chart as you can see the price has broken out of the downtrend channel.
Let's start by designating support sites that we can consider:
1. $ 2.69
$ 2.38
3. $ 2.16
and
4. $ 1.59
Now let's move on to the resistance that the price has on its way:
1 - $ 3.26
2 - $ 3.82
3 - $ 4.63
4 - $ 5.48
5 - $ 6.68
and
$ 6-8.20
Looking at the CHOP indicator, we can see that in the 1D range the energy was mostly used, and the MACD indicator shows a local upward trend.

FLOW short Entry Range, Take Profit and Stop LossFLOW/USDT short
Entry Range: $2.55 - 2.71
Take Profit 1: $2.00
Take Profit 2: $1.50
Take Profit 3: $1.10
Stop Loss: $3.35

Flow coin formed bullish Gartley for upto 17.50% moveHi dear friends, hope you are well and welcome to the new trade setup of Flow coin.
On 4-hour time frame, FLOW has completed a bullish Gartley pattern. At the moment, after complaint the final leg priceline has slightly moved up, therefore, we can wait for the price correction to catch it from the buying zone.
Note: Above idea is for educational purpose only. It is advised to diversify and strictly follow the stop loss, and don't get stuck with trade

FLOWUSD Where it's best to buy next.FLOW (FLOWUSD) is extending the strong 1D green candle that posted yesterday, having broken above the 1D MA100 (green trend-line), turning the 1D MA50 (blue trend-line) into a Support. The 1D RSI is at the highest (overbought) levels it has ever been and as the price is just below the 0.5 Fibonacci retracement level, it is best to wait for a pull-back to the 1D MA50 in order to buy again. If however the price breaks and closes above the 1D MA200 (orange trend-line), that would be a break-out buy signal into a new Bull Phase, in which case the first target would be 8.2800.
--------------------------------------------------------------------------------------------------------
Please like, subscribe and share your ideas and charts with the community!
--------------------------------------------------------------------------------------------------------

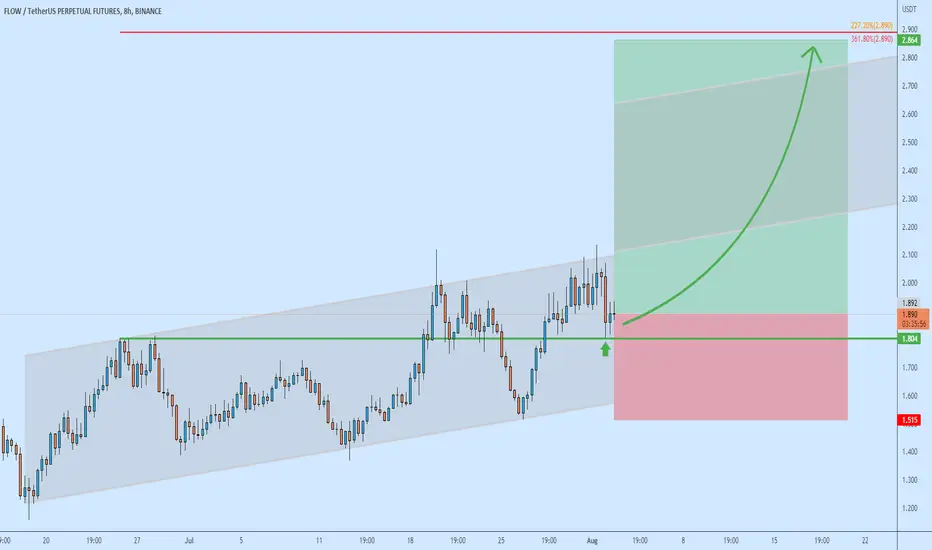
FLOW/USDT support rejected... up up upFLOW found support in the previous supply area. Price continues to move within the ascending channel, suggesting further growth. I'd expect the next wave to be more impulsive.
Flow at important volume resistanceFlow at important volume resistance combined with a bullish MA-Ribbon bullish
But we also see a hidden bearish divergence with a lower high on price but higher high on RSI
A correction is more than likely IMO - but MA-Ribbon might be new support for more breakout trials dear Crypto Nation
Drop me a nice comment about your thoughts
*not financial advice
do your own research before investing


FLOWIf 4H candle closes above the red zone the trend is bullish, else it will be bearish and maybe will hit 1.54.

FLOW shortFLOW broke trough the ascending trendline. Asset broke trough the support level. Bearish movement to support level at 1.32 is possible.

FLOW longFLOW broke trough off the upper boundary of descending channel. Asset bounced off the support level. Bullish movement to resistance level at 1.95 is possible. If the next resistance level will be broken up the FLOW is supposed to reach 2.35.

FLOW short Entry Range, Take Profits and Stop LossFLOW/USDT short
Entry Range: $2.20 - 2.65
Take Profit 1: $2.00
Take Profit 2: $1.50
Take Profit 3: $1.10
Stop Loss: $2.95

$FLOW Will be listed on Coinbase tomorrwo 5/19/2022Do your own research. By at your own risk. $FLOW will be listed on Coinbase tomorrwo 5/19/2022. If there is any pump it COULD have big upside. There has NOT BEEN big pumps recently with Coinbase listings. FYI.

Flow shortFlow bounced off the descending trendline. Asset bounced off the resistance level. Bearish movement to support level at 3.4 is expected to happen.

$CPB Long IdeaCPB had some sweeps and block call flows yesterday and the cart looks good IMO with a nice gap above, strength and volume uptick.
Trader went 5/6 48 calls 300K premium and 5/20 call sweeps 48/49 strike.
I like more time, so I'm long 5/20 49 calls, swinging and singing baby
Target would be gap close 48.78 but will start trimming calls on the way .
Cheers

AA bouncing off support + Massive FlowThis trade has a great R:R imo.
Just a couple of days ago some heavy flow came into the January $75 calls. Over $5MI in premiums.
Price is bouncing off support and showing reaction.
Stop loss can be just below support and target can be $75 / $80

Flow Is trading symmetrical triangleThe Flow has been extremely bearish move from early 2020 Oct to 24 Jan 2022 and after that it has formed a symmetrical triangle in just couple of months.it has recently bounced from supporting line , so As you can see in the following chart you could trading according this pattern.
And if we will see more Bullish move if there is a confirmed breakout

Flow into a Symmetrical triangleIt has been a strong downward move on the chart From early Oct to 24 jan that is recently.after that it formed a symmetrical triangle so i expected we can see trading into this pattern for a few days.
First target is upper resistance line pattern.
Happy trading 🌷
Check out last my analysis that we have a take profit 70%
