High volume of transactionsFLOW has continued its downtrend to the $0.65 range over the past few weeks, and a strong positive reaction has been generated in this area by re-hitting the midline of the descending channel. Due to the lack of price history in the current ranges, we can only use the Fibonacci tool to determine the resistance support levels. Therefore, the first resistance range in case of more support for this currency can be in the area of 0.94 to 1 dollar. Because this range overlaps with the ceiling of the descending channel, it is a suitable place for supply and demand. If the market conditions remain favorable, the price can take a period below this range resistance. The closest support to the current price is in the $0.70 range, where we can expect a positive reaction. Another point is that a high volume of transactions is recorded at the bottom of the price, which is a good sign of buying this currency. Therefore, if the price returns to the previous bottom range, i.e., the $0.65 range, we can consider a high probability of forming the double bottom pattern.
FLOWUSD

FLOWUSDT Analysis - 2 JANUARY 2023Hello Guys, Today's Analysis is on the FLOWUSDT Symbol in a 15m Time frame, I Hope it Will be Useful for You, Don't Forget to Like, Follow, Comment

FLOW may be gearing up for massive rallyCrypto markets continue to stew in the wake of the FTX fallout, and the prevalent "risk off" investor sentiment as the FED continues to wage war against record high inflation. The crypto market in 2022 has felt very much alike to that of 2018--which for those of you that weren't around, it was just a giant suckfest everyday. Coins that had promising futures and strong narratives were down 70% and felt like a bargain. Weeks later those would go down another 40%. You can tell yourself you're gonna "Buy it 'till it acts right" but one day you just get tired of waking up to your shit down 35% for the 12th time. This was also when I created my profile image. I was still trading in GDAX at the time. While I was never bearish, I did feel utterly defeated every single day for an entire year. I left the picture as a reminder of that year, to help keep my exposure in check when trading and take profits when possible.
Anyways, getting back to today's markets. When everything keeps bouncing lower off a downward trendline, it seems like a coin toss (no pun intended) as to whether any of these dead cat bounces are worth riding as we look to establish long term price support. I've seen promising weekly MACD bullish crosses get obliterated, on both USD and BTC pairs. So I tend to avoid trading based off those in this kind of market. RSI for me has been a better way to trade but the key is to find a coin with a decent amount of price history, volume, and narrative. There's two types of bullish RSI trades I like. One is having cash on the sideline for when BTC just nukes and prints a -25% candle. Alts will be down 40-50% and you can scrape the bottom. These daily candles almost always close down somewhere in the -16 to -24%, so you can make a good bit of money in a day off someone else's liquidations. The other kind is based off historical RSI reversal levels as seen in the FLOW chart attached. Down almost 91% YTD, and around 32% in the last few weeks. The daily RSI is around 15, which historically has led to rallies over 50% in the days following. What's impressive, and a bit unnerving, is that this has occurred 100% of the time this happens. There's not a single instance where RSI hits 15-16 and doesn't rally. And all the rallies I highlighted were just measured up to the first correction. Many of these rallies off this low point continued much higher, I just wanted to point out the safest exit was still a pretty nice move. The daily bollinger bands leave the door open to around .96-$1.00. I'm not saying it's a slam dunk or a no-brainer, but you've at least got some rationale behind the trade setup. Either way please remember this is not financial advice or recommendations, I just thought it was interesting and wanted to share. Be safe out there and keep your heads on straight.

FLOWUSDT IDEA HELLO GUYS THIS MY IDEA 💡ABOUT FLOWUSDT nice to see strong volume area....
Where is lot of contract accumulated..
I thing that the sellers from this area will be defend this SHORT position..
and when the price come back to this area, strong sellers will be push down the market again..
DOWNTREND + SUPPORT from the past + Strong volume area is my mainly reason for this short trade..
IF you like my work please like and follow Thanks

FLOW CAN PUMP HARDLYHello, dear traders. how are you ? Today we have a setup to buy/long the FLOW symbol.
For risk management, please don't forget stop loss and capital management
When we reach the first target, save some profit and then change the stop to entry
Comment if you have any questions
Thank You

Trading opportunity for FLOWUSDTBased on technical factors there is a Buy position in :
📊 FLOWUSDT
🔵 Buy Now 1.0994
🧯 Stop loss 1.015
🏹 Target 1 1.207
🏹 Target 2 1.360
🏹 Target 3 1.607
💸RISK : 1%
We hope it is profitable for you ❤️
Please support our activity with your likes👍 and comments📝

Buyers' attention!During the last week, FLOW has registered a complete range trend near the support area of $1. The price of this currency in the daily and 4-hour time frame is in a descending angle pattern, which, if Bitcoin remains on its support limits, the possibility of its price growth and return to higher resistance levels is provided. It should be noted that the trading volume of this currency is close to the lowest historical level, and due to the divergence of the volume, the possibility of price growth is very high.
Only buyers' attention to this currency can increase the volume of transactions. In many time frames, the price trend of this currency is still downward. But in the time frame of 15 minutes, the trend is upward; the price can grow up to the range of $1.15. If this resistance is broken, the higher targets we can consider for this currency will be in the range of 1.24 - 1.40 dollars.

Formation of a new price floor!During the last weeks, FLOW took a strong downward trend, which has caused the formation of a new price floor in this currency. The lowest recorded price is within the specified support range, showing a price of $1.072. This range is very close to $1, and the reason for the positive price reaction and reversal is also buyers' willingness in this range. Another point is that the extension of the downward trend line, which was considered on the chart in the past, is exactly in this support range.
This means that the previous upward move with a pullback to this area can again be signs of a trend change in the 4-hour time frame. The support range of $1-1.072 is still the most valid and the last support identified on the chart, and there is a possibility of positive reactions and the formation of a range trend on this level for the coming weeks. The closest resistance to the current price is in the range of $1.33-$1.40, and hitting this resistance could bring a negative reaction. The RSI indicator also shows a positive divergence, and if Bitcoin does not fall further, the probability of maintaining this support range is high.


FLOW - The price is above support.After a rapid rise, we see a pullback to the lower boundary of the range. The price is kept in flat above the support from where the previous movement was resumed. In case of successful resumption of buying, the price is expected to rise.
If you liked the idea, please like it. That's the best "Thank you!" for the author 😊
P.S. Always do your own analysis before a trade. Put a stop loss. Fix profits in installments. Withdraw profits in fiat and make yourself and your loved ones happy.

FLOW LONG OPPORTUNITY 20220929Signal:
Blue -> Purple -> Blue
Strong volatility
FLOW, FLOWUSD, FLOWUSDT, FLOWUSDTPERP, FLOWBUSDPERP, CRYPTO, CRYPTOCURRENCY
DISCLAIMER
This is only a personal opinion and does NOT serve as investing NOR trading advice.
Please make your own decisions and be responsible for your own investing and trading Activities.

Flow Coin Price PredictionFlow Coin Price Prediction, i am long now because it is on it demand zone, it will range and fly up

FLOW bearish sentimentNext week we have the FOMC meeting.
Most likely the Federal Reserve will raise rates by 75 basis points. In case of 100 basis points increase, i expect a sell-off in the markets.
Major cryptocurrencies have seen heavy coin inflow into exchanges recently.
I expect a strong sell pressure next week.
FLOW/USDT short
Entry Range: $1.79 - 1.85
Take Profit 1: $1.69
Take Profit 2: $1.50
Take Profit 3: $1.10
Stop Loss: $2.35

FLOW bearish sentimentSeptember has major catalysts for the crypto market as well as for the stock market.
The Ethereum merge on September 6th, that will end on Sept 20, the inflation report on September 13 and the next FOMC meeting afterwards with the new interest rates hike.
That is reflected in the crypto space in general as a bearish outlook.
FLOW is a cypto with a negative overall sentiment recently.
I have the following price targets:
FLOW/USDT short
Entry Range: $1.95 - 2.10
Take Profit 1: $1.75
Take Profit 2: $1.50
Take Profit 3: $1.10
Stop Loss: $2.35

Flow coin formed bullish Gartley for upto 14% pumpHi dear friends, hope you are well and welcome to the new trade setup of Flow coin with US Dollar pair.
Previously we had a nice trade of Flow:
Now on a 4-hr time frame, AR has formed a bullish Gartley pattern.
Note: Above idea is for educational purpose only. It is advised to diversify and strictly follow the stop loss, and don't get stuck with trade

Flow (FLOW) - August 9hello?
Welcome, traders.
By "following", you can always get new information quickly.
Please also click "Like".
Have a good day.
-------------------------------------
(FLOWUSDT 1D Chart)
Resistance: 4.785-5.210
1st support: 2.523-2.980
2nd support: 1.501-1.684
The key is whether it can be supported around 2.980.
If it goes down from 2.980, we should see if there is support in the 2.523-2.980 range.
If it drops from 2.523, you need a Stop Loss to get cash.
------------------------------------------------------------ -------------------------------------------
** All descriptions are for reference only and do not guarantee a profit or loss in investment.
** The MRHAB-T indicator, which is inactive on the chart, contains indicators that indicate support and resistance points.
** Background color of Long/Short-S indicator: RSI oversold and overbought sections
** Background color of CCI-C indicator: When the short-term CCI line is below -100 and above +100, oversold and overbought sections are displayed.
** The OBV indicator was re-created by applying a formula to the DepthHouse Trading indicator, an indicator disclosed by oh92. (Thanks for this.)
(Short-term Stop Loss can be said to be a point where profit and loss can be preserved or additional entry can be made through split trading. It is a short-term investment perspective.)
---------------------------------

FLOW short Entry Range, Take Profit and Stop LossFLOW/USDT short
Entry Range: $2.55 - 2.71
Take Profit 1: $2.00
Take Profit 2: $1.50
Take Profit 3: $1.10
Stop Loss: $3.35

Flow coin formed bullish Gartley for upto 17.50% moveHi dear friends, hope you are well and welcome to the new trade setup of Flow coin.
On 4-hour time frame, FLOW has completed a bullish Gartley pattern. At the moment, after complaint the final leg priceline has slightly moved up, therefore, we can wait for the price correction to catch it from the buying zone.
Note: Above idea is for educational purpose only. It is advised to diversify and strictly follow the stop loss, and don't get stuck with trade

FLOWUSD Where it's best to buy next.FLOW (FLOWUSD) is extending the strong 1D green candle that posted yesterday, having broken above the 1D MA100 (green trend-line), turning the 1D MA50 (blue trend-line) into a Support. The 1D RSI is at the highest (overbought) levels it has ever been and as the price is just below the 0.5 Fibonacci retracement level, it is best to wait for a pull-back to the 1D MA50 in order to buy again. If however the price breaks and closes above the 1D MA200 (orange trend-line), that would be a break-out buy signal into a new Bull Phase, in which case the first target would be 8.2800.
--------------------------------------------------------------------------------------------------------
Please like, subscribe and share your ideas and charts with the community!
--------------------------------------------------------------------------------------------------------

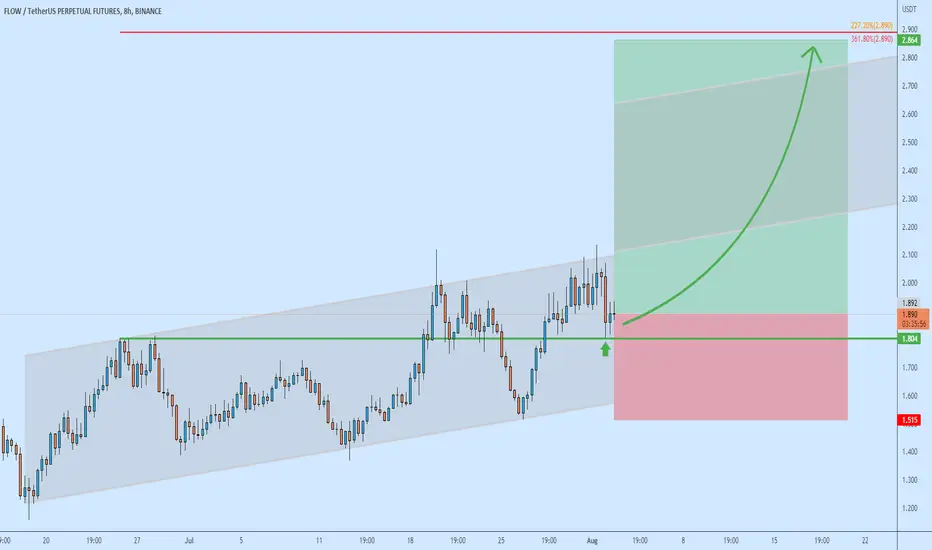
FLOW/USDT support rejected... up up upFLOW found support in the previous supply area. Price continues to move within the ascending channel, suggesting further growth. I'd expect the next wave to be more impulsive.
Flow at important volume resistanceFlow at important volume resistance combined with a bullish MA-Ribbon bullish
But we also see a hidden bearish divergence with a lower high on price but higher high on RSI
A correction is more than likely IMO - but MA-Ribbon might be new support for more breakout trials dear Crypto Nation
Drop me a nice comment about your thoughts
*not financial advice
do your own research before investing

FLOW short Entry Range, Take Profits and Stop LossFLOW/USDT short
Entry Range: $2.20 - 2.65
Take Profit 1: $2.00
Take Profit 2: $1.50
Take Profit 3: $1.10
Stop Loss: $2.95

Flow Is trading symmetrical triangleThe Flow has been extremely bearish move from early 2020 Oct to 24 Jan 2022 and after that it has formed a symmetrical triangle in just couple of months.it has recently bounced from supporting line , so As you can see in the following chart you could trading according this pattern.
And if we will see more Bullish move if there is a confirmed breakout
