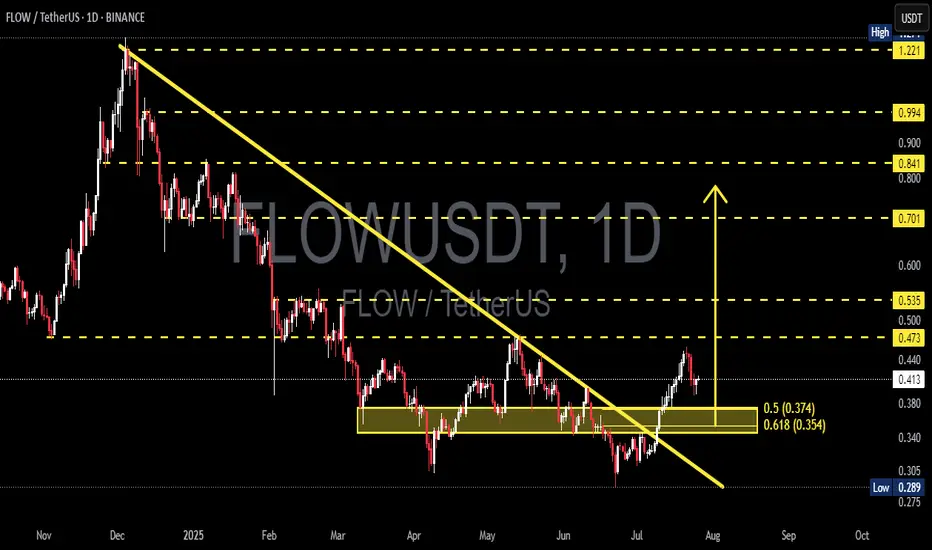
FLOWUSDT Breakout + Golden Pocket Retest: Ready to Explode?After being trapped in a persistent downtrend for months, FLOW has finally shown a major technical signal: a clean breakout from the dominant descending trendline that has defined price action since late 2024.
This breakout isn’t just visually appealing — it’s backed by strong technical confluence, including a key demand zone, Fibonacci retracement support, and potential shift in market psychology.
---
🧠 Technical Structure & Chart Breakdown
📉 Descending Trendline Breakout
The major downtrend line has been decisively broken, indicating that bearish pressure is weakening. This is an early but powerful sign that momentum may now be shifting toward the bulls.
🟨 Consolidation Zone & Flip Area (Yellow Box)
The $0.354–$0.374 zone has acted as:
Former resistance during sideways consolidation
Potential new support after the breakout (support-resistance flip)
📊 Fibonacci Retracement Levels
0.5 Fib = $0.374
0.618 Fib = $0.354
This area, also known as the "Golden Pocket", is one of the most critical levels in technical analysis. It often acts as a launchpad during bullish retests.
---
🟢 Bullish Scenario: Textbook Retest Before a Rally?
If the price holds and reacts positively from the $0.354–$0.374 zone, the following upside targets come into play:
1. 🎯 Target 1: $0.473 – Previous range resistance
2. 🎯 Target 2: $0.535 – Key horizontal level
3. 🎯 Target 3: $0.701 – Historical resistance
4. 🎯 Extended Target: $0.841 – $0.994, potentially up to $1.221 in a strong bullish expansion
For this scenario to play out, bulls must push a daily close above $0.473 to confirm strength and break market structure.
---
🔴 Bearish Scenario: False Breakout Ahead?
If the price fails to hold the golden pocket support:
The breakout could turn into a bull trap
The price may retrace toward:
$0.305 – Local support
$0.289 – The previous low
A strong bearish candle with volume below $0.354 would invalidate the breakout and may signal renewed downward pressure.
---
💡 Conclusion: Critical Decision Point Ahead
FLOWUSDT is now at a pivotal point. The breakout has happened — but the retest zone will decide everything. Will it serve as the foundation for a larger bullish rally, or will it mark the start of another bearish wave?
Watch price action closely around $0.354–$0.374 — that’s where smart money makes their move.
#FLOWUSDT #CryptoBreakout #TechnicalAnalysis #GoldenPocket #RetestZone #FibonacciLevels #AltcoinSetup #CryptoMomentum #FlowAnalysis
Flowusdtsignal
FLOWUSDT 1D AnalysisFLOW ~ 1D Analysis
#FLOW Buy back from this support block with a short term target of at least 15%+ From here.

FLOWUSDT 1DFLOW ~ 1D Analysis
#FLOW Buy gradually after successfully penetrating this resistant line with a short -term target of at least 10%+.
FLOWUSDT 6DFLOW ~ 6D Analysis
#FLOW This is the lowest support block for now. Buy from here with a minimum target of 20%+.

FLOWUSDT 1WFLOW ~ 1W Analysis
#FLOW In Time Frame 1W re -test this support, buy from here if you still have a conviction on this coin with a minimum target of 20%++

Flow/USDT: Preparing for a Breakout Opportunity
Flow/USDT is approaching an interesting phase as it moves closer to a significant resistance level. The chart shows consolidation, indicating potential energy build-up for a breakout.
Key observations:
- Flow/USDT is testing a resistance zone that has held strong in previous attempts. A successful breakout could result in a bullish move with considerable potential.
- Momentum indicators such as RSI and MACD suggest growing bullish sentiment, increasing the likelihood of upward movement.
- A volume surge during the breakout would confirm buyer strength and validate the move.
Strategy:
- Wait for a clear 4-hour or daily candle close above the resistance to confirm the breakout.
- Consider entering after a retest of the resistance as new support, which often provides a safer entry point.
- Use stop-loss orders below the breakout level to manage risk effectively.
- Watch for fake breakouts; avoid entering prematurely without proper confirmation.
Potential targets:
- First target: .
- Second target: .
This is for educational purposes only. Always conduct your own research and trade with caution.

FLOWUSDTFLOW ~ 1W
#FLOW If you have Conviction on this coin,. You can place purchases on this support block. previously the price bounced quite strongly from here.

FLOWUSDTFLOW ~ 1W
#FLOW If you have Conviction on this coin,. You can place purchases on this support block. previously the price bounced quite strongly from here.

FLOWUSDT 2DFLOW ~ 2D
#FLOW Trying to break through this resistance line.
This I am Bullish as long as price Continues to maintain above this resistance line.

FLOW Holders! FOLLOW ME~!Hello, guys.
This is ESS team.
If you have position in FLOW,
please CHECK this VIEW.
================
Candles are once again challenging up with GREEN line's strongly support.
If support is confirm, The Candles will go to challenge to the red line.

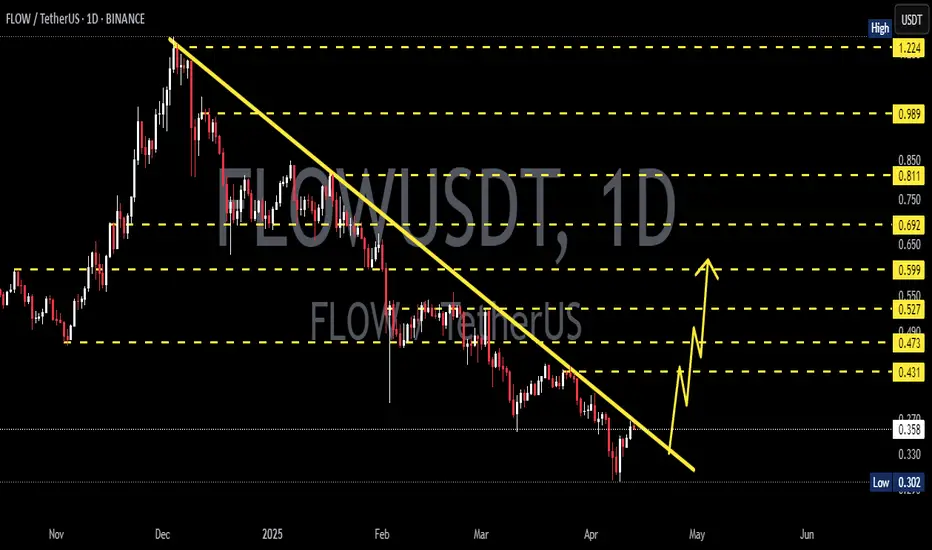
FLOW risk/reward ratio 161D time frame
-
FLOW just got rid of the long-term downtrend and is making a small triangle structure now.
This triangle could be a continuation structure, which help us to set up a trading plan. Also, using Fibonacci extention on the falling wave(1.444~0.408), there are two major resistance zones, where are proper targets. SL is set below previous low, then we can gain a great risk to reward ratio over 16.
TP: 1.326~1.444 / 1.873~2.084
SL: 0.379

FLOW USDT needs some time offi will enter a SHORT/SELL position on
FLOW USDT.
50% here at 0.908
50 at 0.93
TAKE PROFIT
50% at 0.87
50% at 0.831
STOP LOSS
100% 0.952
LEVERAGE X2
FOLLOW FOR MORE

Flow coin formed bullish Gartley for upto 14% pumpHi dear friends, hope you are well and welcome to the new trade setup of Flow coin with US Dollar pair.
Previously we had a nice trade of Flow:
Now on a 4-hr time frame, AR has formed a bullish Gartley pattern.
Note: Above idea is for educational purpose only. It is advised to diversify and strictly follow the stop loss, and don't get stuck with trade

Flow usdt forecast/ IdeaPlease write any advice or suggestions.
Dear friends, request any cryptocurrency pair, currencies pair for forex, and any index that you want to be analyzed and ask any questions.
Thanks for your attention

Flow falling | forecast/ideafor Futures traders
Flow Usdt falling
Please write any comments or suggestions.
Dear friends, request any cryptocurrency or forex indices that you want to be analyzed.
Thanks for your attention

Time to go with the FLOW 60MinBitcoin has done the dirty work for us, Its time to go with the Flow- What does this mean-
Hand me My Lightsaber

FLOWUSDT Analysis (LOCAL VISION)Hello friends.
Please support my work by clicking the LIKE button👍(If you liked). Also i will appreciate for ur activity. Thank you!
Everything on the chart.
Entry: market and lower
Target: 8 and 9.5
Stop: under 4.5 (depending of ur risk). ALWAYS follow ur RM .
after first target reached move ur stop to breakeven
Risk/Reward: 1 to 3
risk is justified
Good luck everyone!
Follow me on TRADINGView, if you don't want to miss my next analysis or signals.
It's not financial advice.
Dont Forget, always make your own research before to trade my ideas!
Open to any questions and suggestions.
