#FLUX/USDT Forming Bullish Falling Wedge#FLUX
The price is moving within a descending channel on the 1-hour frame and is expected to break and continue upward.
We have a trend to stabilize above the 100 moving average once again.
We have a downtrend on the RSI indicator that supports the upward break.
We have a support area at the lower boundary of the channel at 0.2370, acting as strong support from which the price can rebound.
We have a major support area in green that pushed the price upward at 0.2340.
Entry price: 0.2495
First target: 0.2580
Second target: 0.2670
Third target: 0.2780
To manage risk, don't forget stop loss and capital management.
When you reach the first target, save some profits and then change the stop order to an entry order.
For inquiries, please comment.
Thank you.
FLUX

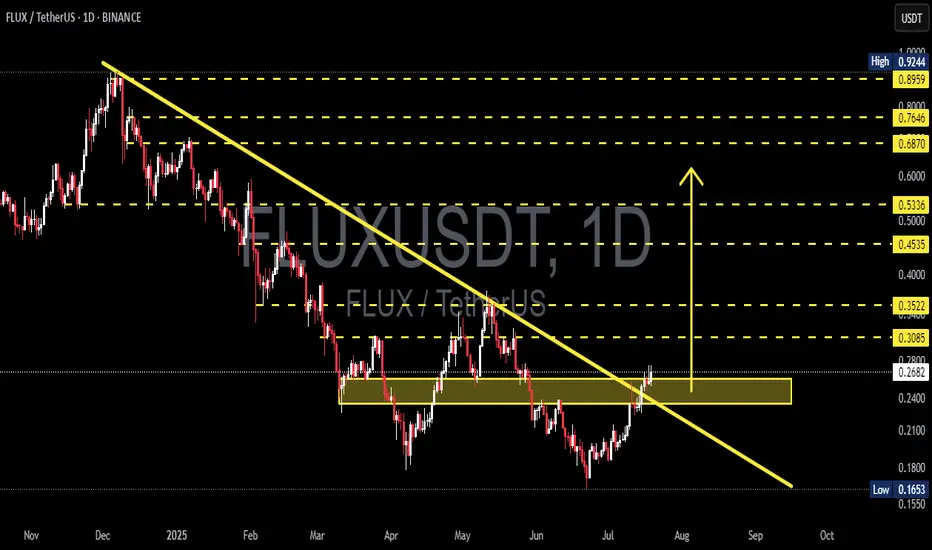
FLUX/USDT – Major Trendline Breakout!
📊 Technical Analysis Overview (Daily Timeframe)
After months of persistent downtrend pressure since late 2024, FLUX/USDT has finally flashed a high-probability bullish reversal signal. The recent breakout above a long-standing descending trendline may mark the beginning of a new bullish structure that could fuel an explosive upside move.
🔍 Market Structure & Technical Pattern
✅ Descending Trendline Breakout:
FLUX has successfully broken out of the dominant bearish trendline that has acted as resistance since December 2024. This breakout is an early sign of a trend reversal, shifting momentum in favor of the bulls.
✅ Demand Zone Reclaim (0.22 – 0.26 USDT):
This critical horizontal range has served as both support and resistance in recent months. Price has now reclaimed this zone with strength, indicating renewed buying pressure and a possible shift into accumulation or markup phase.
✅ Bullish Breakout Candle:
A strong bullish candle has closed above both the descending trendline and the demand zone, confirming breakout strength and increasing the odds of bullish continuation.
✅ Potential Bullish Continuation Setup:
If the price holds above 0.26 and prints a higher low, this will likely confirm a bullish structure and support a continuation move toward key resistance levels.
📈 Bullish Scenario – Potential Upside Targets
Should bullish momentum sustain, here are the major resistance levels to watch:
1. 0.3085 USDT – Immediate resistance zone.
2. 0.3522 USDT – Historical horizontal resistance.
3. 0.4535 – 0.5336 USDT – Consolidation range from Q1 2025.
4. 0.6870 USDT – Psychological level and potential Fibonacci confluence.
5. 0.7646 – 0.8959 USDT – Long-term bullish target, up to +200% from current levels.
📌 Note: A breakout supported by strong volume will add greater confirmation to the bullish thesis.
📉 Bearish Scenario – Watch Out for a Fakeout
Although the breakout looks promising, risks remain:
If the price fails to hold above 0.26, it may result in a false breakout.
A break below 0.24 could push price back into the 0.20 – 0.22 USDT zone.
If selling intensifies, FLUX may retest the 0.1653 USDT low.
⚠️ Always manage risk. A re-entry below the broken support would invalidate the breakout setup.
📌 Summary Strategy:
✅ Confirmed breakout from multi-month downtrend structure.
🟨 Demand zone has flipped into support.
📈 Multiple upside targets with strong reward-to-risk potential.
⚠️ Watch for confirmation via volume and price retest behavior.
#FLUXUSDT #CryptoBreakout #AltcoinAnalysis #FLUX #TechnicalAnalysis #TrendReversal #CryptoTrading #TradingViewTA #PriceAction #CryptoBulls
#FLUX breakout confirmed.#FLUX
The price is moving within a descending channel on the 1-hour frame, adhering well to it, and is heading for a strong breakout and retest.
We have a bounce from the lower boundary of the descending channel. This support is at 0.1840.
We have a downtrend on the RSI indicator that is about to be broken and retested, supporting the upside.
There is a major support area in green at 0.1750, which represents a strong basis for the upside.
Don't forget a simple thing: ease and capital.
When you reach the first target, save some money and then change your stop-loss order to an entry order.
For inquiries, please leave a comment.
We have a trend of consolidation above the 100 Moving Average.
Entry price: 0.1930.
First target: 0.1994.
Second target: 0.2066.
Third target: 0.2150.
Don't forget a simple thing: ease and capital.
When you reach the first target, save some money and then change your stop-loss order to an entry order.
For inquiries, please leave a comment.
Thank you.

FLUXUSDT: Patience for the Confirmed ShortFor FLUXUSDT, the prevailing market sentiment is undoubtedly bearish. While the general atmosphere leans towards further downside, the discerning investor understands the importance of strategic patience. My analysis indicates that to engage in a short position prudently, it is beneficial to await price interaction with the red box.
This is not a market to rush. The general consensus points to selling, but a disciplined approach demands specific confirmation at a predetermined level. That red box on your chart is the critical area I'm observing for a high-probability short entry.
Here’s why, and your plan for action:
Waiting for the Trigger: My intention is to initiate a short only after price has engaged with this red zone. This ensures that any move is not premature but grounded in market reaction to a key resistance area.
Confirm the Downside: Your decisive move comes with precise confirmation. This means:
Volume Footprint: I'll be meticulously scrutinizing the volume footprint as price touches the red box, seeking clear signs of renewed seller strength and distribution.
CDV (Cumulative Delta Volume): Look for CDV to turn definitively negative or show a deepening bearish divergence. This affirms that sellers are regaining undeniable control.
LTF Breakdowns: On the low timeframes (LTF), demand concrete breakdowns. Price must fail to hold, retest the red box as new resistance, and then continue lower with conviction. This is your undeniable signal.
My overall bias for FLUXUSDT remains bearish. I only trade assets showing a sudden and significant increase in volume, and while this is a short setup, the volume dynamics confirming weakness at a key resistance are what I seek.
Keep a sharp eye on that red box. If these confirmations align, you'll uncover a precise, high-probability short entry. This is where smart, confirmed decisions are made, avoiding the impulsivity that often plagues less disciplined traders.
📌I keep my charts clean and simple because I believe clarity leads to better decisions.
📌My approach is built on years of experience and a solid track record. I don’t claim to know it all but I’m confident in my ability to spot high-probability setups.
📌If you would like to learn how to use the heatmap, cumulative volume delta and volume footprint techniques that I use below to determine very accurate demand regions, you can send me a private message. I help anyone who wants it completely free of charge.
🔑I have a long list of my proven technique below:
🎯 ZENUSDT.P: Patience & Profitability | %230 Reaction from the Sniper Entry
🐶 DOGEUSDT.P: Next Move
🎨 RENDERUSDT.P: Opportunity of the Month
💎 ETHUSDT.P: Where to Retrace
🟢 BNBUSDT.P: Potential Surge
📊 BTC Dominance: Reaction Zone
🌊 WAVESUSDT.P: Demand Zone Potential
🟣 UNIUSDT.P: Long-Term Trade
🔵 XRPUSDT.P: Entry Zones
🔗 LINKUSDT.P: Follow The River
📈 BTCUSDT.P: Two Key Demand Zones
🟩 POLUSDT: Bullish Momentum
🌟 PENDLEUSDT.P: Where Opportunity Meets Precision
🔥 BTCUSDT.P: Liquidation of Highly Leveraged Longs
🌊 SOLUSDT.P: SOL's Dip - Your Opportunity
🐸 1000PEPEUSDT.P: Prime Bounce Zone Unlocked
🚀 ETHUSDT.P: Set to Explode - Don't Miss This Game Changer
🤖 IQUSDT: Smart Plan
⚡️ PONDUSDT: A Trade Not Taken Is Better Than a Losing One
💼 STMXUSDT: 2 Buying Areas
🐢 TURBOUSDT: Buy Zones and Buyer Presence
🌍 ICPUSDT.P: Massive Upside Potential | Check the Trade Update For Seeing Results
🟠 IDEXUSDT: Spot Buy Area | %26 Profit if You Trade with MSB
📌 USUALUSDT: Buyers Are Active + %70 Profit in Total
🌟 FORTHUSDT: Sniper Entry +%26 Reaction
🐳 QKCUSDT: Sniper Entry +%57 Reaction
📊 BTC.D: Retest of Key Area Highly Likely
📊 XNOUSDT %80 Reaction with a Simple Blue Box!
📊 BELUSDT Amazing %120 Reaction!
📊 Simple Red Box, Extraordinary Results
📊 TIAUSDT | Still No Buyers—Maintaining a Bearish Outlook
📊 OGNUSDT | One of Today’s Highest Volume Gainers – +32.44%
📊 TRXUSDT - I Do My Thing Again
📊 FLOKIUSDT - +%100 From Blue Box!
📊 SFP/USDT - Perfect Entry %80 Profit!
📊 AAVEUSDT - WE DID IT AGAIN!
I stopped adding to the list because it's kinda tiring to add 5-10 charts in every move but you can check my profile and see that it goes on..

#FLUX/USDT#FLUX
The price is moving within a descending channel on the 1-hour frame, adhering well to it, and is heading towards a strong breakout and retest.
We are experiencing a rebound from the lower boundary of the descending channel. This support is at 0.2150.
We are experiencing a downtrend on the RSI indicator, which is about to break and retest, supporting the upward trend.
We are heading towards stability above the 100 moving average.
Entry price: 0.2335
First target: 0.2463
Second target: 0.2576
Third target: 0.2716

FLUXUSDT 1D AnalysisFLUX ~ 1D Analysis
#FLUX Buy back gradually from here with a short term target of at least 15%+.

FLUXUSDT 1D Analysis FLUX ~ 1D Analysis
#FLUX Buy gradually from here if you still have confidence in this coin with a short term target of at least 15%++ from here.

#FLUX/USDT#FLUX
The price is moving in a descending channel on the 1-hour frame and is adhering to it well and is heading to break it strongly upwards and retest it
We have a rebound from the lower limit of the descending channel, this support is at a price of 0.2820
We have a downtrend on the RSI indicator that is about to be broken and retested, which supports the rise
We have a trend to stabilize above the moving average 100
Entry price 0.3231
First target 0.3430
Second target 0.3600
Third target 0.3773

FLUXUSDT 1D AnalysisFLUX ~ 1D Analysis
#FLUX Buy when re -testing this support block with a short -term target of at least 10%+ from here.

#FLUX/USDT#FLUX
The price is moving within a descending channel on the 1-hour frame, adhering well to it, and is on its way to breaking it strongly upwards and retesting it.
We are seeing a rebound from the lower boundary of the descending channel, which is support at 0.1766.
We have a downtrend on the RSI indicator that is about to break and retest, supporting the upward trend.
We are looking for stability above the 100 Moving Average.
Entry price: 0.1966
First target: 0.2095
Second target: 0.2212
Third target: 0.2346

FLUX About to Explode or Break Your Portfolio? Yello Paradisers — are you ready for the next breakout play, or are you blindly walking into a trap? FLUXUSDT is showing signs of a major decision point, and it could catch most traders off guard if they're not prepared. Here's exactly how we're planning it.
💎#FLUXUSD is currently trading within a wedge formation, and we're seeing a high probability of an upside breakout, especially if price is able to surpass the key resistance at $0.2291. In such a case, the next magnet is the internal supply zone at $0.2650 this is where we’ll start monitoring for potential trade setups.
💎This internal supply is a critical reaction zone. If price respects it and starts pulling back, we expect a retracement toward the support level at $0.1646. The high time frame structure remains bearish, which adds more weight to this retracement scenario being likely after tagging the internal supply.
💎Also, Flux is trading below both the 50 EMA and 200 EMA, confirming broader weakness in trend structure and making any short-term breakout more of a reactive move inside the macro bearish bias.If price doesn’t reject at the internal supply zone and breaks through it cleanly, we’ll be looking for a strong reversal from the Ultra TF supply zone at $0.3115. That’s the higher level of confluence we trust more in the bigger picture.
💎At this level, we’ll wait patiently as always and look for clear bearish reversal patterns like an Evening Star or a Shooting Star. Only a confirmed breakout above $0.3115 would change the game entirely by shifting the overall market structure and invalidating this current bearish setup.
Stay focused, Paradisers. Be the hunter, not the hunted.
MyCryptoParadise
iFeel the success🌴

#FLUX/USDT#FLUX
The price is moving within a descending channel on the 1-hour frame, adhering well to it, and is on its way to breaking it strongly upwards and retesting it.
We are seeing a rebound from the lower boundary of the descending channel, which is support at 0.1766.
We have a downtrend on the RSI indicator that is about to break and retest, supporting the upward trend.
We are looking for stability above the 100 Moving Average.
Entry price: 0.1966
First target: 0.2095
Second target: 0.2212
Third target: 0.2346

#FLUX/USDT#FLUX
The price is moving in a descending channel on the 1-hour frame and is adhering to it well and is heading to break it upwards strongly and retest it
We have a bounce from the lower limit of the descending channel, this support is at a price of 0.3175
We have a downtrend on the RSI indicator that is about to break and retest, which supports the rise
We have a trend to stabilize above the moving average 100
Entry price 0.3364
First target 0.3500
Second target 0.3600
Third target 0.3755

#FLUX/USDT#FLUX
The price is moving in a descending channel on the 1-hour frame and is adhering to it well and is heading to break it strongly upwards and retest it
We have a bounce from the lower limit of the descending channel, this support is at a price of 0.3962
We have a downtrend on the RSI indicator that is about to break and retest, which supports the rise
We have a trend to stabilize above the moving average 100
Entry price 0.4160
First target 0.4277
Second target 0.4400
Third target 0.4572

FLUXUSDT 1WFLUX ~ 1W Analysis
#FLUX This is the lowest support for now. Buy from here with a minimum target of 20%+.

FluxUSD FLUXUSD on a 15 minute time frame we are in a downtrend channel like the rest of the market in general we have support levels at $.359 and $.3528
there is a resistance at .3827
Not much info to go off with this chart...will update it in a few days

#FLUX/USDT #FLUX
The price is moving in a descending channel on the 1-hour frame and is adhering to it well and is heading to break it strongly upwards
We have a bounce from the lower limit of the descending channel, this support is at a price of 0.4370
We have a downtrend on the RSI indicator that is about to be broken, which supports the rise
We have a trend to stabilize above the moving average 100
Entry price 0.4966
First target 0.5110
Second target 0.5300
Third target 0.5540

FLUXUSDT 1WFLUX ~ 1W
#FLUX If you still have a Conviction on this coin,. This support block will be a very good place of purchase for now with a minimum target of 20%++

#FLUX/USDT #FLUX
The price is moving in a descending channel on the 1-hour frame and is expected to continue upwards
We have a trend to stabilize above the moving average 100 again
We have a descending trend on the RSI indicator that supports the rise by breaking it upwards
We have a support area at the lower limit of the channel at a price of 0.5600
Entry price 0.5700
First target 0.5896
Second target 0.6138
Third target 0.6376

#FLUX/USDT#FLUX
The price is moving in a descending channel on the 4-hour frame and is expected to continue upwards
We have a trend to stabilize above the moving average 100 again
We have a descending trend on the RSI indicator that supports the rise by breaking it upwards
We have a support area at the lower limit of the channel at a price of 0.5500
Entry price 0.5771
First target 0.6482
Second target 0.7194
Third target 0.8000

FluxFlux usdt Daily analysis
Risk rewards ratio =2.4 👈👌
Time frame daily
Target 1$
Flux broke sharply the blue box that you can see in the chart. Then price came down to upper side of the box and now is time for raise and reach first target 1$

FLUX is bullish (1D)It seems we have a large QM pattern on the chart where the left shoulder has been cleared, and liquidity pools at the top of the chart are attracting the price.
By maintaining the green zone, the asset can continue its upward trend.
Closing a daily candle below the invalidation level will invalidate this analysis.
For risk management, please don't forget stop loss and capital management
When we reach the first target, save some profit and then change the stop to entry
Comment if you have any questions
Thank You

FLUX GREAT BUYING OPPORTUNITY (SWING TRADE)Flux is currently at a really strong support/buy area.
This is a swing trade opportunity if you want to buy flux at a very good price.
Accumulate at green box around:
.49 to .59
Don't get shaken out.
Flux will become very big in the coming months/years.
