Technical Analysis: Price Breakout and BeyondHello Friends,
Welcome to RK_Chaarts,
Let's try to analyze a stock from the FMCG sector, "Dabur India Limited".
Elliott Wave perspective.
We can see that the correction is completed, which is the IVth wave of the monthly time frame of cycle degree in Red. Now, possibly the impulse wave Vth had start unfolding. If we go inside that, we'll see its five sub-divisions in black, labeled ((1))-((2))-((3))-((4))-((5)) of primary degree.
Possibly, wave ((1)) has started unfolding, and within wave ((1)), we'll see five sub-divisions in blue, which is the intermediate degree. Within this, waves (1) and (2) looks complete, and wave (3) has started, which has also broken out of the curve line.
Invalidation level
If our wave counts are correct, the bottom level of wave IV, which is 433, will be our main invalidation level. If the price goes below this level, it will trigger the invalidation level. If that happens, we'll need to re-analyze the chart from a wave count perspective.
But if the price stays above this invalidation level, then our view, which is based on the analysis, will remain bullish, and the chart will remain bullish.
Projected Target
As per Elliott wave theory, it can show new ATH in Long Term, only if Invalidation level is not breached.
Breakout with good Intensity of Volumes
The breakout has a good intensity of volume. The volume in the breakout candle is looking very good, which is 3-4 times higher than the average. This means that market participation is very good during this breakout. So, Conviction is high on this breakout.
We can clearly see that the price has closed above the 50 Exponential Moving Average (EMA), 100 EMA, and 200 EMA, which is a very good sign that the price has overcome all these hurdles along with Breakout.
Now, if there are any hurdles above, they could be the 200 EMA on the weekly time frame, which is coming near the level of 529, and the 50 EMA on the monthly time frame, which is coming near the price of 527. Currently, the price is trading around 513.
Once it crosses 529 or 530, it may show even more strength after that.
Dow Theory Trend confirmation
Based on Dow Theory, if we observe, the price which was falling and making lower highs and lower lows, has now started forming a Higher High and Higher Low pattern on the daily time frame, which is again a sign of bullishness.
Standard Deviation crossed
Price is trading above the mid-Bollinger Band on the weekly time frame, i.e., in the bullish territory. On the daily time frame, Prince has also crossed the upper Bollinger Band, meaning it has broken out and is expanding above the upper Bollinger Band, which is a bullish sign
Supporting Indicators
On the daily time frame, a very good breakout is visible inside RSI, and is also moving above 72. Additionally, on both the daily and weekly time frames, the MACD has given a positive crossover.
Before making any trading decisions, please conduct your own analysis or consult with a technical expert or financial consultant.
I am not Sebi registered analyst.
My studies are for educational purpose only.
Please Consult your financial advisor before trading or investing.
I am not responsible for any kinds of your profits and your losses.
Most investors treat trading as a hobby because they have a full-time job doing something else.
However, If you treat trading like a business, it will pay you like a business.
If you treat like a hobby, hobbies don't pay, they cost you...!
Hope this post is helpful to community
Thanks
RK💕
Disclaimer and Risk Warning.
The analysis and discussion provided on in.tradingview.com/u/RK_Chaarts/ is intended for educational purposes only and should not be relied upon for trading decisions. RK_Chaarts is not an investment adviser and the information provided here should not be taken as professional investment advice. Before buying or selling any investments, securities, or precious metals, it is recommended that you conduct your own due diligence. RK_Chaarts does not share in your profits and will not take responsibility for any losses you may incur. So Please Consult your financial advisor before trading or investing.
Fmcgstock

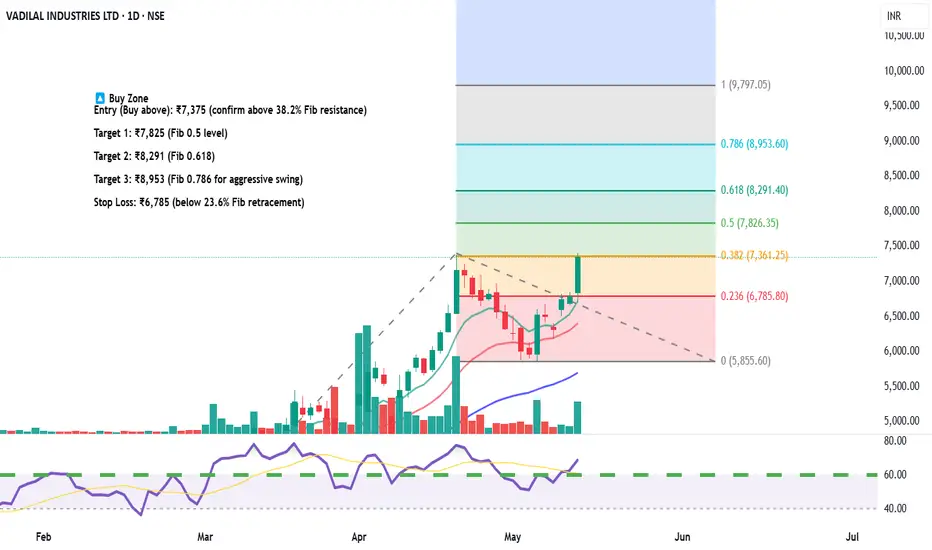
Vadilal Industries – Equity Trade Setup & Research View🟢 Long Trade Setup (Bullish Reversal Play)
Current Price: ₹7,346.50
Fibonacci Level Tested: 38.2% at ₹7,361 — a crucial breakout level
Trendline Breakout: Price has broken above falling trendline with volume confirmation
RSI: Near 60 – bullish momentum building
🔼 Buy Zone
Entry (Buy above): ₹7,375 (confirm above 38.2% Fib resistance)
Target 1: ₹7,825 (Fib 0.5 level)
Target 2: ₹8,291 (Fib 0.618)
Target 3: ₹8,953 (Fib 0.786 for aggressive swing)
Stop Loss: ₹6,785 (below 23.6% Fib retracement)
🔻 Short Trade Setup (if rejection happens)
Sell Below: ₹7,200
Target: ₹6,785
Stoploss: ₹7,375
📅 Timeframe: Daily (1D)
📊 Risk/Reward Ratio: 1:2.5+
🔁 Valid for: Next 2–4 weeks
For Education Purposes Only
NESTLEIND buying opportunityPrice is showing a positive reaction from the institutional buying zone, suggesting a potential buying opportunity at the levels indicated in the chart.
NESTLEIND presents a strong opportunity for both short-term and long-term gains.
Please note: I am NOT a SEBI-registered advisor or financial advisor. The investment or trade ideas I share are solely my personal viewpoint and should not be considered as financial advice.

ITC target 600FMCG major ITC currently trading at 424.90 rupees is going to see a major jump in its share price from the current levels to the levels of around 590-600 giving a return of around 60% from the present levels. The analysis is based on cup with handle chart pattern which can be seen in the chart posted with this analysis. the target will be achieved within this year.
Hope you like my analysis.
Please do your own analysis before investing.
Do like and follow and share among your friends and family.
Thank you.

GILLETTE ATH / CUP BreakoutGILLETTE is currently trading around its all-time high (ATH) and presents an opportunity for a long trade with a promising risk-reward profile. The strategy involves entering a position at 4% above the ATH and employing a dynamic stop-loss approach to manage risk and maximize potential gains.
Entry: Enter a long position at GILLETTE's ATH price + 4% (8,465.60)
Initial Stop-Loss: Set an initial stop-loss at 20% below the entry price (6,772.50)
Targets:
First Target: 10,614.95 (Fibonacci 1.618 level)
Second Target: 12,144.75 (Fibonacci 2 level)
Third Target: 16,149.50 (Fibonacci 3 level)
Position Sizing: Limit the trade size to ensure that no more than 5% of your capital is at risk. In case the stop-loss is triggered, the maximum capital loss will be limited to 1%
The dynamic stop-loss adjustment after reaching the first target further protects capital and locks in profits.
The position sizing ensures that you are not risking more than you can afford to lose.
Disclaimer:
This trading strategy is for informational purposes only and should not be construed as financial advice. Please conduct your own research and due diligence before making any trading decisions.
Additional Notes:
Consider using technical indicators and chart patterns to refine your entry and exit points.
Monitor market conditions and adjust your strategy accordingly.
Practice risk management techniques to protect your capital.
Please let me know if you have any other questions.

Lux Industry is getting ready for Next Big and huge huge Swing Hello Everyone, i hope you all will be doing good in your trading and your life as well, i have brought another stock which is getting ready for big move, Company name is Lux Industry. My calculation is saying it is going to give huge move in one way towards 10000+ levels in coming time, as price has formed double bottom, and if you will see stock has done sme in earlier swing, and each swing was doubled than earlier. So expecting same in next swing.
MACD is giving bullish crossover in all timeframe specially in higher timeframe.
Stock has given golden crossover in daily time frame (For those who does not know about golden crossover i will write here (whenever stock or any security trade below 200-DEMA from long time and suddenly stock gives crossover above 200-DEMA and sustains for sometimes, that is called golden crossover, usually this scenario creates bullish bias in market)).
About Company:-
Lux Industries Limited was incorporated in 1995 having a market share of 15% of the organised industry. It is the largest mid-segment hosiery enterprise in India.Company is engaged in the manufacturing and marketing of innerwear, thermals, and casuals under various brands, with ‘LUX’ being its flagship brand.
Stock P/E
47.2
Book Value
₹ 496
Dividend Yield
0.32 %
ROCE
12.7 %
ROE
9.97 %
Face Value
₹ 2.00
Industry PE
16.2
Debt
₹ 236 Cr.
EPS
₹ 35.0
Promoter holding
74.2 %
Intrinsic Value
₹ 1,262
Pledged percentage
0.00 %
EVEBITDA
27.2
Change in Prom Hold
0.00 %
Profit Var 5Yrs
12.0 %
Sales growth 5Years
17.2 %
Return over 5years
4.63 %
Debt to equity
0.16
Net profit
₹ 100 Cr.
ROE 5Yr
23.4 %
Profit growth
-44.5 %
Disclaimer:- Please always do your own analysis or consult with your financial advisor before taking any kind of trades.
Dear traders, If you like my work then do not forget to hit like and follow me, and guy's let me know what do you think about this idea in comment box, i would be love to reply all of you guy's.
Thankyou.

RETEST COMPLETIONPrice has been tested around 0.5 Fibannocci levels and if it closes today strongly and i target it to the trendline drawn on 21062023 in the given chart.
However, stock has got a high PB and PE ratio.
Please provide your views if anything which i might have missed out.

📈 Exciting Bullish Pattern Alert! 🐂📊 Pattern: Rising Channel
📌 Symbol/Asset: Britannia Industries
🔍 Description: FMCG Defensive stock available on Strong Support
👉 Remember: Technical patterns are just one piece of the puzzle. Consider conducting further research, consulting with a financial advisor, and managing your risks appropriately.

GILLETTE will break its previous highGillette is in the same price range of 2017-18 but it has given a net profit of more than 1643 crores and it is 29% down from its lifetime high. SO it is currently an undervalued stock. If it reaches lifetime high then a profit of 37% is made on the bet but it will surely break the lifetime high and make a new lifetime high. The company has significantly reduced its other costs and increasing it revenue and net profit. It is trading at a lower P/E ratio that its average 10 year P/E. It has a CWIP of 74 crores which means the company is looking for expansion. The company is debt free which makes it a safe share to buy and get huge gains.

MARICO- Daily/Hourly Timeframe-Bearish patternStock is looking weak in daily time frame. From past few days it’s not able to cross it’s previous swing in daily time frame. It’s at crucial level 520-523. It has bounced multiple times from this lvl.
However, if this lvl breaks on 30th June it will be good opportunity to go short.
Please make sure there should be a bearish price action in 5/15minute time frame for intraday trades.
This is only for educational purpose, please manage your risk accordingly.

COLPAL- Weekly/Monthly Timeframe-Channel BreakoutNSE:COLPAL
COLPAL is looking bullish in weekly/monthly time frame. Last month there was a rejection from the top. However, it did not receive follow up for bearish momentum. Instead, stock has took support on last month’s closing levels 1590-1600.
This is the good opportunity to go long if monthly/weekly candle closes near 1700-1710.
We may see a big upside momentum in upcoming months.
SL: 1580-1585.
This idea is only for educational purpose, please manage your risk accordingly.
