Gold Crashes $100 After Hitting Monthly High | What’s Next?In this video, I break down everything that moved the price of gold last week, from the early-week rally toward $3,430 to the sharp midweek drop toward $3,325. We go beyond the surface, diving into what caused the reversal, and how I'm approaching next week’s market using a simple ascending channel on the 4-hour chart.
With major events like the FOMC rate decision, U.S. GDP, PCE inflation, NFP and the August 1 tariff deadline all on the radar, this analysis will help you stay grounded and prepare for volatility.
👉 If you find this content valuable, don’t forget to Boost, Comment, and Subscribe for weekly market breakdowns.
Disclaimer:
Based on experience and what I see on the charts, this is my take. It’s not financial advice—always do your research and consult a licensed advisor before trading.
#goldanalysis, #goldforecast, #xauusd, #goldpriceprediction, #technicalanalysis, #fundamentalanalysis, #tradingstrategy, #forextrader, #priceaction, #fomc, #usgdp, #pceinflation, #goldtrading, #forexeducation, #dollarvsgold, #tariffnews, #chartanalysis, #forexmentorship, #rebuildingthetraderwithin
FOMC

Bitcoin: Strategic Entry Plan on Pullback – 116k Buy Opportunity__________________________________________________________________________________
Technical Overview – Summary Points
➤ Bullish momentum across all higher timeframes (1H to 1W) supported by Risk On / Risk Off Indicator (Strong Buy).
➤ Major supports: 116,128 and 111,980 (multi-timeframe pivots). Key resistance at 123,218.
➤ Very high intraday volumes, pointing towards probable capitulation zones.
➤ Multi-timeframe behaviors: Technical rebound anticipated on the 116,128–115,600 zone, caution if 111,980 breaks.
__________________________________________________________________________________
Strategic Summary
➤ Global Bias: Bullish confirmed mid/long-term.
➤ Accumulation opportunities on key pullbacks near 116,128 and 111,980.
➤ Risk zone: sustained closes below 111,980 = invalidation of bullish outlook (target 105,100).
➤ Macro catalysts: FOMC meeting (July 29-30), heightened event-risk period.
➤ Action plan: favor entries after FOMC volatility resolution, stop-loss adjusted below 111,980.
__________________________________________________________________________________
Multi-Timeframe Analysis
Daily (1D) : Compression under 123,218 resistance, primary bullish trend, no extreme signals.
12H : Healthy consolidation under resistance, no euphoria or panic, normal volumes.
6H : Price squeezed between major supports (116,128–111,980), uptrend confirmed.
4H : Institutional volumes on supports, favors technical rebound.
2H : Speculative rebound underway, confirmation needed for short-term bottom.
1H : Strong capitulation signal, record volumes, immediate retest of 116,128 support.
30min : Local oversold status, extreme sentiment, high technical reversal probability.
15min : Phase of panic likely ending, short-term rebound anticipated.
Key Indicators:
Risk On / Risk Off Indicator: Strong buy on 1D–4H, neutral on 30min and 15min.
ISPD DIV: Neutral to Buy (capitulation signaled on 1H+30min).
Volumes: Very high at lows = capitulation + potential bottom.
MTFTI: Up momentum above 1H, down on lower timeframes (30–5min).
__________________________________________________________________________________
Cross Timeframe Synthesis
High timeframe alignment confirms bullish bias, supported by buyer volumes.
Key zone 116,128–111,980 = multi-timeframe support, tactical focus.
Main risk: break of 111,980.
__________________________________________________________________________________
Operational synthesis & macro context
Bullish bias validated unless breakdown below 111,980.
Tactical accumulation window on pullbacks, 1H confirmation needed.
Volatility risk increases ahead/during FOMC, dynamic stop management essential.
Altcoins fragile: extra caution if BTC triggers Risk Off.
Calendar to watch: FOMC (July 29–30), Durable Goods (July 25).
__________________________________________________________________________________
On-Chain (Glassnode) :
BTC consolidates, no extreme signs; ETH outperforming but caution on alts (elevated leverage).
__________________________________________________________________________________
⏳ *Decision Recap for July 25, 2025, 10:56 CEST:*
— BUY ZONE tactical at 116,128–115,600 (BTC), 1H confirmation required.
— Stop-loss below 111,980 / Swing target >120,000–123,218.
— Risks : Fed announcements, flushes on supports, altcoins at risk.
__________________________________________________________________________________
Will The Emerging Uncertainties Support Gold Ahead?Macro approach:
- XAUUSD advanced this week, supported by broad-based US dollar weakness and reviving safe-haven demand amid rising global trade tensions. The yellow metal briefly reached a five-week high as investors sought safety following headlines of escalating US tariffs and uncertainty over the Fed’s policy direction.
- Gold may remain well-supported if risk aversion persists, with upcoming global PMIs and further US trade developments set to guide market direction. Additional Fed commentary and central bank actions could trigger new volatility for XAUUSD throughout the week.
Technical approach:
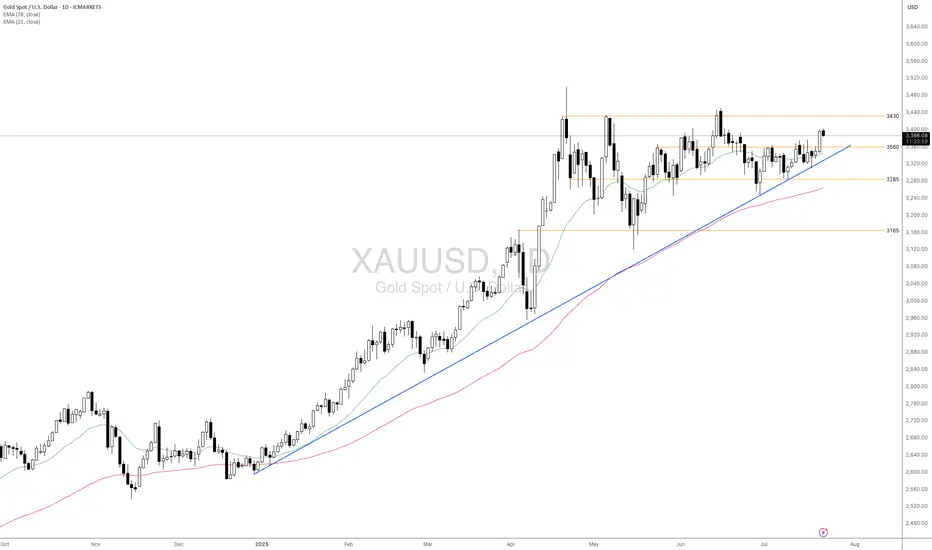
- XAUUSD remains above both the EMA21 and EMA78, reflecting ongoing bullish momentum. The recent price action shows consolidation below the resistance at 3430 after rejecting the swing high. In contrast, higher lows have formed above the ascending trendline and the support at 3285.
- If XAUUSD stays above the support at 3560, it may extend towards the previous swing high at around 3430 and open for another record high.
- On the contrary, if the price drops below the support at 3560 and the ascending trendline, it may retreat toward the following support at 3165.
Analysis by: Dat Tong, Senior Financial Markets Strategist at Exness
Bitcoin at 120,000: Decisive Breakout or Renewed Consolidation?__________________________________________________________________________________
Technical Overview – Summary Points
__________________________________________________________________________________
Momentum: Strongly bullish on H1 and above; healthy consolidation below ATH.
Supports/Resistances: 120,000 USDT (pivot resistance), 116,400–117,000 (major support), 104,000–110,000 (long-term support).
Volumes: Normal, no anomaly nor climax detected.
Risk On / Risk Off Indicator: Strong buy signal on all timeframes except very short term. Sectoral health confirmed.
Multi-timeframe: Short-term bearish divergence on 15/30min, but robust technical structure above H1-D1.
__________________________________________________________________________________
Strategic Summary
__________________________________________________________________________________
Global bias: Confirmed bullish across all timeframes; no major break detected.
Opportunities: Strategic buys between 116,400–117,000 (pullback); confirmed breakout above 120,000 (target 130,000).
Risk zones: Below 116,000 (potential correction to 112,000–104,000), false breakout at the top.
Macro catalysts: Monitor Fed (next FOMC July 29-30), volatility on risk assets, geopolitical tensions.
Action plan: Prioritize stop management, stay reactive ahead of macro events. Main scenario: buy confirmed pullback or validated breakout.
__________________________________________________________________________________
Multi-Timeframe Analysis
__________________________________________________________________________________
1D / 12H: Bullish structure intact but facing historical resistance (120k), strong supports in place (104–107k).
6H / 4H / 2H: Consolidation below resistance, no signs of exhaustion, tactical supports at 116,000–117,000.
1H / 30min / 15min: Weakness on shorter timeframes (sellers at top), confirmation of range polarization. No emotional excesses (ISPD DIV neutral), standard volumes.
Risk On / Risk Off Indicator: Strong buy except for very short-term fatigue.
Summary:
Multi-horizon bullish bias, technical and sectoral confluence for upside extension if clear breakout >120,000. Key support to hold at 116,400–117,000. Buy dips, ride breakout up to 130,000. Focus on risk management, flexibility advised as macro (Fed) nears.
__________________________________________________________________________________
Key macro events to watch
__________________________________________________________________________________
2025-07-18: Fed rate/volatility debate (Equity, Bonds, BTC).
2025-07-29: FOMC (potential pivot for risk assets).
__________________________________________________________________________________
Strategic decision & final summary
__________________________________________________________________________________
Main bias: Bullish, to be validated at key levels, favor buying dips/breakouts.
Risk management: Stop below 116,000, scale out progressively after 125k, reinforced protection ahead of FOMC.
Opportunities: Pullback 116,400–117,000 (RR >3); H4/D breakout >120,000 targeting 130,000 (RR >2).
Monitoring: Macro (Fed, geopolitics), dynamic management according to market response to news.
Conclusion:
A validated move above 120,000 projects target to 130,000 (next statistical/on-chain extension). Deep dips can be bought above 104,000. Do not loosen risk management as Fed date approaches.

Bitcoin Full analysis: Buy the dip confirmed, 123240 key__________________________________________________________________________________
Technical Overview – Summary Points
__________________________________________________________________________________
Momentum: Very bullish across all timeframes; healthy compression above previous range.
Key Supports: 115731–110481 USDT (structural, 1D to 1H).
Major Resistances: 123240 USDT (multi-frame pivot).
Volume: Normal, no climax or distribution — flows support the dominant bias.
Risk On / Risk Off Indicator: Strong bullish HLTF signal; short-term neutral intraday.
ISPD DIV: Neutral on all timeframes.
Multi-TF Behavior: Bull rally, no excess, no euphoria or capitulation; market holds above key levels.
__________________________________________________________________________________
Strategic Summary
__________________________________________________________________________________
Global Bias: Strong bullish – MT/LT “buy on dips” confirmed.
Opportunities: Progressive buying (117800, 115731 USDT), continuation on breakout >123240.
Risk Zones: Possible pullback if clear rejection below 123240, swing invalidation if close <115731-111949.
Macro Catalysts: Awaiting FOMC late July, short-term volatility limited. Watch geopolitics, extreme compression.
Action Plan: Swing entry: 118300–119000. Stop: 115500. Target: 123200 then 126000+. R/R ≥2.5. Adjust risk management before FOMC.
__________________________________________________________________________________
Multi-Timeframe Analysis
__________________________________________________________________________________
1D: Bullish momentum, supports at 105054/107939–110483. Risk On / Risk Off Indicator strong buy, healthy volume, ISPD neutral.
12H: Consolidation below 123240, aligned supports 110481/115731, healthy structure.
6H: Confirmed momentum, continuous compression, no major sell signals.
4H: Rally structure robust, corrections limited and on support.
2H: Key support band 115731–110481, volume supports rebound, possible rotation below 123240.
1H: Rally confirmed, no panic selling detected.
30min/15min: Intraday consolidation, micro-range below resistance, stable volume, Risk On / Risk Off Indicator short-term neutral.
Cross-TF summary: CLEAR momentum across all frames, no significant divergence, high-quality HTF supports. Next >123240 breakout likely fast and dynamic.
__________________________________________________________________________________
Technical & Fundamental Synthesis
__________________________________________________________________________________
Technical Synthesis: Broad bullish confirmation; buy-the-dip valid on 117800/115731, no aggressive downside signal. Swing positions above 118200 to be favored, expect acceleration after clear break of 123240.
Stops & Invalidation: Swing stops below 115731/111949. Closing below = increased risk, “off” bias.
Fundamentals: Optimal pre-FOMC swing window, US market in wait-and-see mode short term. Neutral/volatile geopolitics, no immediate shocks.
On-chain: Heavy accumulation, historic compression, ETF flows strong (but on short pause). Imminent volatility squeeze possible either way.
Recommendation: Actively monitor 123240 (breakout above), 115731 (below = increased caution). Adjust stops and sizing, remain highly responsive, especially as FOMC approaches.
__________________________________________________________________________________

SPX 6300 Highs to 6200 Lows - Watch Key LevelsThis week earnings season kicks off
-Notables include JPM, GS, BAC, WFC, NFLX, KMI, PEP and others
US Inflation (CPI and PPI) this week
-forecasts are showing HIGHER inflation
-consumers care, but markets may not
6300-6350 key resistance area for SPX
6200 key support area for SPX
If we break the 6200 floor, there's room to fall to 6000-5700 to find stronger support
I discuss the 50 day moving averarages on the S&P and Nasdaq as levels to watch
For the remainder of the month...
7/18 July Monthly Expiration
7/30 US FOMC (with Press Conference)
8/1 US Non-Farm
8/1 US Tariff Deadline (per Trump)
Markets will have to really love a slew of good earnings and good news to see more highs and melt-ups through this typically bumpy season (Aug-Sep)
Thanks for watching!!!

Bitcooin Major invalidation: breaks below 107793 then 105054k$__________________________________________________________________________________
Technical Overview – Summary Points
__________________________________________________________________________________
Momentum: Strong bullish bias across all timeframes, confirmed by the Risk On / Risk Off Indicator.
Key Support/Resistance: HTF daily pivot zone 105054–102019. Major resistances: 109179 then 110483–111949. Key supports: 107793–105054.
Volume: Normal and healthy on all TFs, no euphoria; uptick on 30min, watch for breakout confirmation.
Multi-TF Behavior: Bullish consolidation, no behavioral excesses detected. ISPD DIV strictly neutral, no panic or euphoria visible.
__________________________________________________________________________________
Strategic Summary
__________________________________________________________________________________
Global Bias: Dominant bullish structure. Trend remains steady as long as the HTF daily support 105054–102019 holds.
Opportunities: Buy on dips, target the confirmed breakout of 109179 to extend towards 110483–111949. “Buy-the-dip” remains relevant on 107793–105054.
Risk zones: Volatility expected around the FOMC minutes (07/09) & risks linked to the end of the US tariffs suspension. Neutral/bearish scenario below 105054.
Macro catalysts: FOMC, US tariff decision, bullish institutional news; exercise caution ahead of major 07/09 events.
Action Plan: Active management on macro catalysts; stops below 107793 (ST) or 105054 (swing). Act post-news for signal confirmation.
__________________________________________________________________________________
Multi-Timeframe Analysis
__________________________________________________________________________________
1D : Bullish structure, consolidating below key resistance at 110483/111949. Buyers control above 105054–102019.
12H/6H/4H : Upper-range under control, no signs of distribution or exhaustion. 109179 is immediate resistance to watch for breakout.
2H/1H : Active micro-range between 107793–109179. “Buy the dip” on support, execute on confirmed breakout.
30min/15min : No extreme signals, moderate volatility, volumes contained; breakout needs to be confirmed above 109179.
Risk On / Risk Off Indicator : Strong BUY signal from daily to 30min, still positive on 15min.
Summary : Homogeneous context, robust bullish trend. Major resistances ahead, no case for counter-trend shorting while key supports hold.
__________________________________________________________________________________
Cross-Analysis & Fundamentals
__________________________________________________________________________________
On-chain trend: Massive HODLing, no selling pressure, stable liquidity, institutions buying.
Macro & calendar: High uncertainty for 07/09. Watch FOMC minutes, end of US tariffs, US auctions, oil inventories. Extreme volatility possible—caution.
Risk Management Synthesis: Buy on support/lower range, active management pre-catalysts, technical stop below 107793/105054, targets at resistance 110483–111949.
Bitcoin bullish Bias Consolidated: Robust Supports, Eyeing 11194__________________________________________________________________________________
Technical Overview – Summary Points
__________________________________________________________________________________
Momentum : Strong bullish consensus across all timeframes, confirmed by the Risk On / Risk Off Indicator (STRONG BUY).
Key Supports : 107761 (240min Pivot), 105054.7 (D Pivot Low, swing invalidation zone), 102019.9 (240min Pivot), 74485 (W Pivot Low, macro invalidation).
Key Resistances : 109676.5 – 110630.1 (240min & 1D cluster), 111949 (W Pivot High).
Volume : Normal to very high, no selling climax detected.
Multi-TF Behaviours : No behavioral excess indicated by ISPD DIV, healthy market structure.
__________________________________________________________________________________
Strategic Summary
__________________________________________________________________________________
Overall Bias : Confirmed bullish. Any pullback towards 107761/105054.7 = buy-the-dip opportunity.
Risk Zones : Below 105054.7 = multi-TF invalidation, risk of bearish acceleration to 102019.9.
Macro Catalysts : Focus on FOMC (29–30/07). Until then, controlled volatility, bullish bias sustained.
Action Plan : Buy on support, partial profit near 110630–111949 cluster. Reduce exposure/partial exit before FOMC.
__________________________________________________________________________________
Multi-Timeframe Analysis
__________________________________________________________________________________
Daily (1D) : Steady bullish momentum, resistances at 110630–111949 being watched.
12H – 6H – 4H – 2H : Bias remains strong, intermediate supports defended (107761). No behavioral or breakout alerts.
1H – 30min : Continued bullish dominance, increased volatility and volume but no distribution signs.
15min : Local technical correction, no key pivot broken. Overall trend still absorbed by buyers.
Risk On / Risk Off Indicator : Strong Buy signal (slight neutral on 15min).
Summary : Bullish confirmation across all timeframes. Only a break below 107761 would weaken the setup.
__________________________________________________________________________________
Strategic Synthesis – Recommended Actions
__________________________________________________________________________________
• Remain net long while 105054.7 holds.
• Buy zone: retest at 107761/105054.7.
• Take profits gradually below 110630/111949; manage risk if key support breaks.
• Only major macro shocks or break of 105054.7 invalidate current plan.
• Solid on-chain positioning, no major capitulation risk detected.
__________________________________________________________________________________
Macro Calendar Watchlist
• 08/07/2025: RBA & RBNZ rate decisions (limited BTC impact)
• 29–30/07: FOMC (US Fed, key BTC/risk catalyst)
• Anticipate rising volatility ahead of FOMC. Monitor volume, possible institutional profit-taking.
__________________________________________________________________________________
On-Chain & Institutional Flow Analysis
Majority of investors in profit, holding dominates, new ATH for long-term holders.
Robust ETF/institutional flows.
No liquidity stress or stablecoin squeeze seen.
__________________________________________________________________________________
Conclusion
Market structure remains bullish and sound. Setup: buy on pullback, take profit under resistance, monitor macro events (esp. FOMC). Plan only invalidated by break below 105054.7 or negative macro catalyst.
__________________________________________________________________________________

AUD/USD Short: Riding the Perfect Storm to 0.6400Hello, traders! 🚀
A rare and powerful setup is forming on AUD/USD, and all signs are pointing decisively lower. 👇 This isn't just a simple technical pattern; it's a perfect storm of fundamental, technical, and event-driven factors aligning to create a high-conviction short opportunity.
If you're looking for a clean setup with a clear catalyst, this is it. Let's break it down! 🧐
The Core Thesis: Why We're Bearish 🌪️
This trade is built on three powerful pillars that are converging at the same time:
Massive Policy Divergence: 🇺🇸 vs 🇦🇺 This is the engine of the trade.
The Fed (USD): Remains HAWKISH 🦅. They are laser-focused on fighting stubborn inflation and have signaled they are in no rush to cut rates.
The RBA (AUD): Is actively DOVISH 🐨. They've already cut rates and are widely expected to cut again this week to support a weakening economy.
Result: This widening gap in interest rate policy creates a fundamental tailwind that heavily favors a stronger USD and a weaker AUD. 💸
The Dual-Catalyst Event (July 9th): 🗓️ This is the trigger.
FOMC Minutes Release: The minutes from the Fed's last meeting are expected to confirm their hawkish stance, reinforcing USD strength.
Tariff Deadline: A 90-day suspension of Trump-era tariffs expires on the same day . The base case is that tariffs will be reimposed, sparking a risk-off move in the markets.
Result: Risk-off sentiment is toxic for the risk-sensitive Aussie dollar (AUD) and a magnet for the safe-haven US dollar (USD). This is a potential double-whammy for AUD/USD. 💥
The Technical Picture is Screaming "Down" 📉
The chart tells a crystal-clear story of rejection and weakness. As you can see on the 4H chart, the price action is incredibly bearish after failing to break out higher.
The Great Wall of Resistance: Bulls threw everything they had at the 0.6590 - 0.6600 resistance zone and were decisively rejected. 🧱 This wasn't just any level; it was an 8-month high and a major long-term resistance area. A failure this strong is a huge red flag for buyers. 🛑
Momentum has Flipped: We saw classic bearish divergence on the higher timeframes, and as you can see on this 4H chart, we have now decisively broken below the recent rising channel. The path of least resistance has flipped from up to down. 👇
The Trade Plan 🎯
Here are the precise levels for executing this trade idea.
Asset: AUD/USD
Direction: Short (Sell) 📉
Entry Zone: ➡️ Look for a patient entry on a pullback to the 0.6535 - 0.6550 area. This was previous support and is now expected to act as strong resistance. We want to sell into strength.
Stop Loss: 🛑 A daily close above 0.6610 . This level is safely above the recent highs. A break here would invalidate our bearish thesis.
Target 1 (TP1): ✅ 0.6475 . This is the first logical support level. A good area to take partial profits and move your stop loss to break-even.
Target 2 (TP2): 🏆 0.6400 . This is our primary target, representing the bottom of the multi-week trading range and offering an excellent risk-to-reward ratio.
Conclusion: 💡
It's rare for fundamentals, technicals, and a major event catalyst to align so perfectly. The rejection at major resistance, combined with the powerful fundamental driver of policy divergence and the upcoming dual-catalyst on July 9th, makes this a high-conviction setup.
This is my analysis and not financial advice. Always do your own research and manage your risk carefully.
What do you think? Are you bearish on the Aussie too? Let me know your thoughts in the comments below! 👇
And if you found this analysis helpful, please give it a BOOST 🚀 and FOLLOW for more trade ideas! 👍

What to Expect From FOMC and the Market’s Reaction to It? With tariffs and Middle East escalation in focus, central banks have somewhat fallen to the backstage recently. But today’s FOMC meeting might change that. The federal funds rate upper band is most likely to stay at 4.50% with a unanimous vote. However, today’s focus will not be on the interest rate itself but rather on the dot plot and updated economic forecasts.
Inflation continues to move closer to the 2% target, but that trend may have shifted with the latest CPI report. Although recent inflation data came in better than expected, inflation appears to be flattening above 2% and could start rising again in the near future. Last week’s CPI and Core CPI reports showed early signs of this, and the upcoming PCE and Core PCE data could confirm those signals. Why is inflation still low despite tariffs? The main reason is frontloading.
U.S. consumers and firms frontloaded many goods, especially durable good, ahead of the tariff hikes. Now, with tariffs in effect, consumption has slowed, and many firms are holding elevated inventory levels. In this environment, firms are reluctant to raise prices due to lower demand and high stockpiles. This suppressive effect is expected to gradually fade, allowing prices to rise. For that reason, the Fed is unlikely to begin rate cuts prematurely. Inflation could make a peak in the last quarter of 2025 or the first quarter of 2026 in our view. But the possible oil price spike due to Iran – Israel war could change this projection.
At the March FOMC meeting when the economic projections were last updated, some of the tariff impacts were already incorporated. Inflation and unemployment were revised higher, while GDP was revised lower. Despite this, the Fed maintained its forecast of two rate cuts for both 2025 and 2026. However, since March, newly announced tariffs have been more extensive than expected. Some board members including Jerome Powell stated that. As a result, a similar adjustment to the forecasts may occur today: higher inflation and unemployment, lower GDP. Accordingly, the dot plot could show only one rate cut for 2025 and three for 2026. Why would the Fed cut more in 2026? Because the tariff impact is expected to be a one-time shock, not a structural shift. Once the effects wear off, the Fed could ease more. But there are some risks to that. According to some new research and New York FED President Williams, not only long term inflation expectations needs to be anchored, rather the “whole curve” So during a possible inflation peak came with tariff effects, FED could not cut repeatedly and should closely watch the effects on short-term inflation expectations.
The main focus of today’s FOMC will be on the economic forecasts and the dot plot. If the new projections reflect only one cut for 2025, this would be bullish for the dollar. If the 2026 projection also shows only two cuts, that would be even more bullish. On the other hand, if the current forecast of two cuts in both 2025 and 2026 remains unchanged, the reaction could be slightly dovish for the dollar.
During the post-meeting press conference, Chair Powell is likely to focus on uncertainties related to tariffs and energy prices, especially given the rising geopolitical tensions in the Middle East. Powell may downplay the hawkish tone of the dot plot during the conference, potentially reducing the overall market impact.
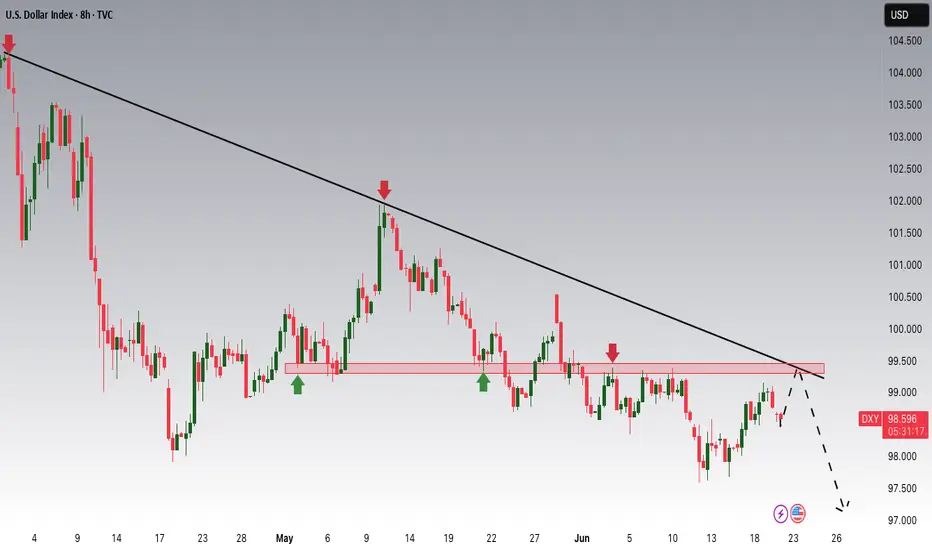
With all this in mind, the dollar index could either break out of the descending wedge formation on the hourly chart or continue drifting toward the lower boundary. Holding above the 99 level could be key for short-term price action.

GBP/JPY in Trouble? Smart Money Rotates Into Yen📊 1. COT Analysis
JPY (Japanese Yen):
Non-Commercial Net Long: +54,615 – showing strong long accumulation since March.
Recent Changes:
Long: -5,319
Short: +1,235
➡️ Mixed signals short-term, but overall net long positioning remains strong. Speculative funds are still heavily favoring the Yen, suggesting potential continued strength.
GBP (British Pound):
Non-Commercial Net Long: +51,634 (111,076 long – 59,442 short)
Recent Changes:
Long: +7,404
Short: -9,015
➡️ Specs are still net long on GBP, but exposure has slightly decreased. The divergence with the Yen is narrowing.
🔎 COT Summary:
Both currencies are being bought by speculators, but the JPY has shown more consistent long-term positioning. Net momentum appears to shift in favor of Yen strength, pointing to potential downside for GBP/JPY.
📅 2. Seasonality – June
Historically, June is a weak month for GBP/JPY, especially over 20y, 15y, 5y, and 2y windows.
Monthly average return is negative across all major historical timeframes (e.g. -1.2415 over 10 years).
➡️ Seasonality reinforces a bearish bias for June.
🧠 3. Retail Sentiment
Short: 52%
Long: 48%
➡️ Retail positioning is balanced, slightly skewed short. Not a strong contrarian signal, but also doesn’t support a bullish breakout scenario.
📉 4. Technical Analysis
Current Structure: Ascending channel from mid-May → currently testing lower boundary.
Key Zone: 195.600–196.520 is a major supply zone with multiple rejections.
Recent Candle Action: Bearish pin bar + engulfing candle → strong rejection from resistance.
Downside Targets:
First: 193.076
Second: 191.439
Break of the channel would further confirm a trend reversal.
➡️ Price action supports a short scenario with high reward-to-risk toward lower zones.

THE KOG REPORT - FOMCTHE KOG REPORT – FOMC
This is our view for FOMC, please do your own research and analysis to make an informed decision on the markets. It is not recommended you try to trade the event if you have less than 6 months trading experience and have a trusted risk strategy in place. The markets are extremely volatile, and these events can cause aggressive swings in price.
A you can see traders the pre-event price action started yesterday with the hourly now playing between the MA’s and waiting for FOMC for a potential breakout. As usual, we have highlighted the key levels and added the red boxes for all of you to help navigate the movement should this not be priced in.
Also remember, there is a press conference after the release, this is usually the time the market will react to anything Powell says about future plans for the economy.
Now, looking at the 4H, we have support at the 3370-65 level and below that 3355. If these are attacked and give a RIP, opportunity for the long trade may be available into the 3395 red box which price will need to break to go higher. If we can break above this red box, we can then look to attempt higher price with the levels 3430, 3445 and above that 3455-60 on the horizon. It’s that red box sitting higher up around the 3470-75 region which needs to be watched if we do get up there as an opportunity to attempt the reverse trade may present itself from there depending on the volume.
So in summary, we have 3 key levels in play, ideally a move upside and rejection from the 3400-6 level giving a further dip would suit buyers to get better pricing.
KOG’s RED BOX TARGETS:
BREAK ABOVE 3395 for 3404, 3406, 3410, 3420, 3430, 3435 and 3459 in extension of the move
BREAK BELOW 3380 FOR 3375, 3364, 3351, 3342, 3333 AND 3327 IN EXTENSION OF THE MOVE
LEARN AND GENERATE YOUR OWN SIGNALS. You don't need any of us to guide you.
Please do support us by hitting the like button, leaving a comment, and giving us a follow. We’ve been doing this for a long time now providing traders with in-depth free analysis on Gold, so your likes and comments are very much appreciated.
As always, trade safe.
KOG

DXY Potential DownsidesHey Traders, in today's trading session we are monitoring DXY for a selling opportunity around 99.300 zone, DXY is trading in a downtrend and currently is in a correction phase in which it is approaching the trend at 99.300 support and resistance area.
Trade safe, Joe.
June 19 XAUUSD Setup — FOMC Aftershock or Bull Trap? Hey traders 👋
After yesterday’s FOMC fireworks and a weak reaction to initial retail sales data, gold broke structure into 3363 and is now floating below key resistance. Price is compressing under the previous H1 lower high, and liquidity continues to build on both sides — perfect conditions for engineered spikes.
Let’s break it down clearly.
🌍 Macro & Sentiment
Yesterday’s FOMC left rates unchanged, but Fed tone leaned hawkish.
Retail Sales and Unemployment Claims disappointed — slight downside pressure on the dollar.
Geopolitical front remains tense: no ceasefire in Gaza, Iran-Israel rhetoric escalates, and Russia-Ukraine conflict is ongoing.
Liquidity is king — and gold is being boxed for the next big move.
📉 Bias & Structure
Daily: Compression after FOMC, lower high remains in control.
H4: Bearish break below 3380, EMA21 hovering above price.
H1: Trendline structure broken, EMA5/21 forming bearish cross, RSI below 50.
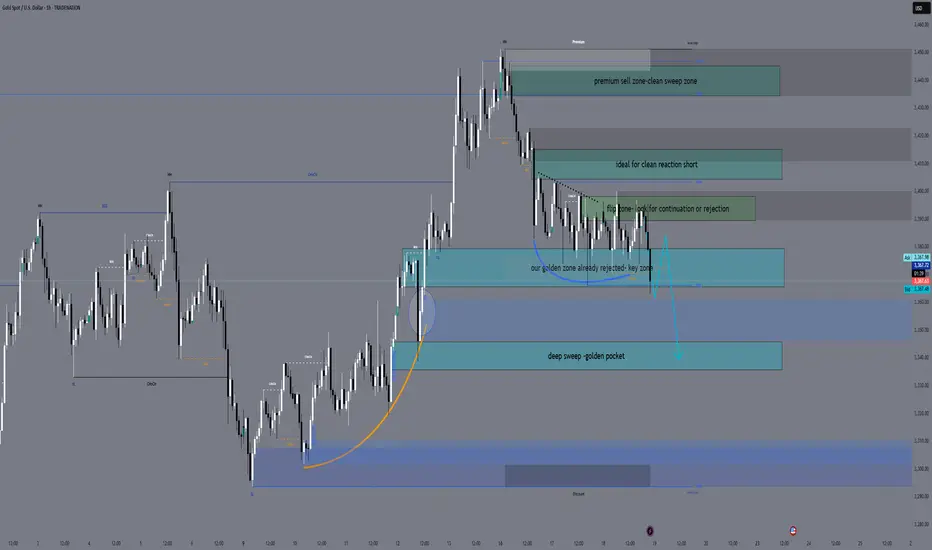
Fibo: H1 drawn from 3452 to 3363 — key golden zone at 3405–3415.
🎯 Bias: Tactical Bearish under 3415 — looking for short-term bounces or premium traps to sell.
🧠 Sniper Zones
🔻 Sell Zones
1️⃣ 3405 – 3415
→ Key golden zone + EMA21 + FVG
→ Monitor M15/M5 rejection for continuation sells
2️⃣ 3435 – 3445
→ Premium OB trap zone
→ If price spikes irrationally, this becomes the extreme reversal area
🔺 Buy Zones
1️⃣ 3365 – 3380
→ Golden buy zone — real fib confluence
→ Already tapped today, but any clean retest may offer reactive bounce trades
2️⃣ 3335 – 3345
→ Extreme flush zone — only valid if deep dump occurs
→ Watch for exhaustion and M15 reversal confirmation
🔻 Emergency Buy Zone:
3305 – 3292
🧠 Why this zone?
✅ H4 untested Order Block + FVG (June 11 candle).
✅ 78.6% Fibonacci retracement (H1 swing from 3452 → 3363).
✅ RSI likely to print oversold.
✅ Deep discount structure — potential final inducement for reversal.
🔔 Important:
This is a backup zone, not for blind entries.
It only becomes active if 3335 breaks with conviction (full candle body close + volume).
Look for M15/M5 confirmation (divergence + price action signal) before engaging.
🔄 Flip Zone
3390 – 3398
→ Volume zone from FOMC + OB test
→ If reclaimed cleanly, may flip intraday bias short-term
📌 Battle Notes
Gold tapped 3363 today, reacting mildly.
If price retraces toward 3405–3415, I’ll watch for shorts — but no early entries.
Below 3365, watch for another bounce or setup around 3345.
Flip zone remains indecisive until confirmed with volume.
🧭 Plan Recap
→ Bearish under 3415
→ Pullback into 3405–3415 = short setup
→ Retest 3365–3380 = bounce watch
→ Flush into 3335 = reversal zone
→ 3435+ = irrational spike trap
🧠 Stay sniper. Wait for price to come to your zones — and execute only on confirmed reactions.
—
🚀 If this helped bring clarity, tap that 🚀, leave your bias in the comments, and hit FOLLOW for real structure-based trading.
🟨 Disclosure: I am part of TradeNation's Influencer program and receive a monthly fee for using their TradingView charts in my analyses and educational articles.
— GoldFxMinds 🧠✨
TAO 4H - Downtrend bottom? Altcoins have certainly taken a backseat to BTC this cycle with Bitcoin dominance holding around 65%. Despite this, there are still some good setups in altcoins presenting themselves each day, one of which is TAO on the 4H.
To me it looks to be in a clear downtrend respecting the upper and lower limits while reacting off of support levels on the way down. As it stands price has reached a key S/R level that has proven to be support in the past and is in conjunction with the lower end of the trend channel.
With FOMC only hours away and TAO being at such a critical level this would be an interesting place to do business. A good reaction off the level would kickstart a move towards the trends upper limits. A loss of this level and it's very possible what has been support can turn into resistance.
To me the R:R here is good for a long position, the threat to the trade is bearish reaction to FOMC, escalation geo-politically which effects risk-on assets and therefor overalls TA.

FED Day: NQ Futures planCME_MINI:NQ1!
Today is FOMC day; however, there is a larger geopolitical risk looming, along with the trade war and tariffs situation unfolding.
Recently, we have noted inflation moving lower, although it is not yet at the FED’s 2% target. Retail sales fell sharply last month. Tariffs have not yet resulted in inflation so far, partly due to the 90-day pause, and with possible extensions, some deals agreed upon, and a framework for others in place, tariff uncertainty has considerably reduced.
On the contrary, lower energy prices that supported lower inflation have risen due to ongoing geopolitical issues. Risks remain high for elevated energy prices even if supply and sea routes remain unharmed. In our view, this is due to the fragility of the situation and what it would take to turn the ongoing war into the worst possible outcome.
The FED releases their Summary of Economic Projections. Key data points will be inflation and growth projections, along with interest rate projections and any talks about neutral rates and expected cuts, given the bleak global outlook and growth. The FED is otherwise expected to hold rates steady in this meeting.
Given this, and what Chair Powell says in the FOMC press conference, their commitment towards driving inflation lower versus maximum employment, risks on the growth and employment side have started to worsen. If rate cut bets are moved forward or if markets price in more rate cuts than currently priced in, we may see equity index futures make further gains.
NQ futures are coiling; the yearly VPOC has shifted higher, as we explained in our previous analysis.
Today’s meeting may be key for further fuel higher or lower, depending on how it pans out. Market participants are in a wait and see mode. Markets are accepting higher prices and break of balance is key to determine the direction price may be headed in. Until otherwise proven, markets are range bound and mean reverting from June Composite Volume Profile towards monthly VWAP and VPOC.

HTF Consolidation: Key Alerts, Vital Supports, FOMC & Geopolitic__________________________________________________________________________________
Technical Overview – Summary Points
__________________________________________________________________________________
Momentum: Strong bullish signal across sector indicators (Risk On / Risk Off Indicator), especially on daily and 12H. Momentum remains robust within consolidation.
Support/Resistance : Key zone at 104429–102600 (short- and long-term pivots); major resistance at 106000–109950.
Volume : Normal to high, with peaks at major supports on 1H/2H (potential sign of absorption/defensive buying).
Behavior across timeframes :
ISPD neutral on most TFs, only 2H gives a buy signal (possible tactical bounce).
All LTFs (≤1H) are down, HTFs (≥1D) are up → corrective structure, awaiting catalyst.
__________________________________________________________________________________
Strategic Summary
__________________________________________________________________________________
Overall bias : Underlying bullish, but market consolidates on key technical zones.
Opportunities : Swing buy at 104429/102600, tight stop below 100k, take profit 109950+.
Risk zones : Clear break below 100350/100000 invalidates the setup (risk-off or tactical short).
Macro catalysts : FOMC, Iran–Israel tensions, economic calendar (monitor Jobless Claims, Crude, Fed statement).
Action plan :
Capital preservation before FOMC.
Tactical entries only on key support; tight stops, prudent sizing.
No breakout chasing without macro/fundamental validation.
Hedge/volatility play via options possible (IV low, caution for post-event spike).
__________________________________________________________________________________
Multi-Timeframe Analysis
__________________________________________________________________________________
1D/12H/6H :
Supports: 104429, 102626, 100353.
Resistances: 106000–109952.
Risk On / Risk Off Indicator = Strong Buy.
No extreme volume, ISPD neutral; mature range.
HTF consolidation, bullish underlying momentum.
4H/2H :
Key zone at 104429–102600 (technical defense); 2H is the first true behavioral buy signal.
Very high volume at support, favoring a "spike bounce" scenario.
“Up” confluence on Risk On / Risk Off Indicator, volume, and ISPD for short-term bounce.
MTFTI: 2H is one of the “Up” TFs; LTFs remain Down.
1H/30min/15min :
Structurally bearish, elevated volume (absorption/protection) on 1H.
No behavioral excesses.
Intraday weakness but supports tested and defended.
__________________________________________________________________________________
Macro / Fundamental analysis
__________________________________________________________________________________
Market in wait-and-see mode : FOMC upcoming, no hike expected but high impact from tone/forward guidance (increased volatility risk).
Geopolitics : Iran–Israel escalation, risk-off climate, nervous risk assets.
On-chain : Supports tested (STH ~97.6k). Persistent LTH accumulation. Low option IV → underpriced volatility risk.
Risk/Reward swing : 2:1/3:1 buying 104429–102600, stop < 100k, take profit 109950+.
__________________________________________________________________________________
Final synthesis: Bias, Opportunities, Risks
__________________________________________________________________________________
Directional bias : Bullish on HTF, neutral/undecided on short-term. Wait-and-see until strong catalyst confirmed (FOMC, geopolitical de-escalation).
Opportunities : Tactical buy on supports, profit-taking on resistance or confirmed breakout.
Risks : Invalidation below 100k; sudden spike in FOMC/Israel–Iran escalation = risk-off or selloff.
Recommended action : Protect capital before FOMC. Swing tactical entry only on confirmed support. No breakout chasing without macro validation. Leverage potential post-FOMC vol spike via options.

Bitcoin - Levels of the Range On the hourly time frame it is clear that BTC is within a rangebound environment. Using key levels such as the weekly highs and lows with Mondays highs and lows to to paint a picture of where support and resistance may be.
In the "weekly outlook" post for this week I suggested a retest of the $108,500 area, an orderblock that pushed prices lower and is notorious for protecting Stop losses of the shorts that pushed price lower, nearly instantly as the week starts we get that move to sweep the supply zone and stop hunt the short trades.
After a successful sweep the swing fail pattern typically follows when in a rangebound environment or absent of a trend. This structure plays out and the sell-off follows.
Price breaks through the Monday low with zero fight so momentum is with the bears in the low time frame. Should momentum continue the previous week low is @ $102,500 which is in line with HTF key level too.
RSI is also entering the oversold zone and in a rangebound environment can be when price reverses direction, as seen by the previous Monday High and Previous week low.
With FOMC just over 24 hours away volatility usually follows. No rate cut forecast however many think the interest rate should be brought down in line with inflation as the ECB has already done.
In conclusion, BTC is in a clear rangebound environment on the hourly time frame.
Stop loss hunt/supply zone sweep and then SFP, the LTF momentum is with the bears going into FOMC.
Next point of support at $102,500 (Previous week low) and could be boosted by the oversold RSI.
An FOMC rate cut should be bullish although currently thought to be unlikely.

Nasdaq Seek and Destroy. Play Patience Game.Patience.
both bullish and bearish idea are valid.
We're ahead of FOMC of tomorrow and we might get false movements / remain under range.
better to no try to rationalize the market here but rather let it showcase his will first.

Bitcoin Multiframe: Key clusters to watch before FOMC__________________________________________________________________________________
Technical Overview – Summary Points
__________________________________________________________________________________
Momentum: Dominant bullish structure across all major timeframes (MTFTI = Up).
Supports/Resistances: No HTF pivot engaged; key on-chain support at $97.6k, resistance at $115.4k.
Volume: Central oscillation within range; no major surges observed, consolidation on micro-TF.
Multi-timeframe behaviors: Bullish structure dominates, technical pullback on 4H-1H-15min without major breaks.
__________________________________________________________________________________
Strategic Summary
__________________________________________________________________________________
Overall Bias: Structurally bullish as long as key supports hold (97.6k–104.5k zone).
Opportunities: Buy confirmed dips on on-chain cluster/H4-H2 area, target 110–115k extension post-FOMC positive catalyst.
Risk zones: Extreme volatility expected around FOMC (June 17–18); strict risk management, avoid overexposure.
Macro catalysts: FOMC (rate decision, dot plot), Fed leadership stability, Israel-Iran geopolitical tensions.
Action plan: Patience until FOMC; favor setups on clear price reaction, tight stops below 97.5k (on-chain support).
__________________________________________________________________________________
Multi-Timeframe Analysis
__________________________________________________________________________________
1D: Bullish momentum, price at range center ($106k). Watch for pivot break.
12H: Persistent bullish bias, confluence with 1D.
6H: Expected consolidation, bullish structure.
4H: Technical pullback, bullish structure remains. Key anticipated support 105k–104.5k.
2H: Likely move towards lower range. Up bias confirmed.
1H: Technical correction within overall Up trend.
30min/15min: Seller sequence, trend intact, no major break.
Risk On / Risk Off Indicator remains “Up” across all frames, boosting the positive view despite short-term correction.
Executive summary:
Strong bullish convergence from Daily → 15min timeframes.
Ongoing short-term pullback, no HTF pivot breaks.
Any break below $97.6k would invalidate the swing bullish scenario.
__________________________________________________________________________________
Macro, Economic Calendar, On-chain & Risk Management
__________________________________________________________________________________
Macro:
FOMC imminent (June 17–18): waiting – volatility on rate/dot plot.
Geopolitical risk (Iran-Israel): sustained global risk-off may escalate.
BTC shows strong resilience at 106k.
Economic calendar (key points):
June 17–18: FOMC — maximum impact (stocks, FX, crypto)
June 17: Fed leadership rumors — potential volatility, BTC stable
June 17, 08:30 UTC: USA — retail sales (May/core)
On-chain:
Key support at $97.6k (STH cost basis), resistance at $115.4k.
Long-term holders are distributing, but bullish accumulation pressure intact.
Clustering may amplify short-term directional moves.
Key scenarios:
Bullish: Extension to 110–115k if FOMC positive, stop below 97.6k.
Bearish: Break of 97.6k = risk of drop towards 92.9–95.4k.
Management: Avoid exposure pre-FOMC, active monitoring, strict stops.
Patience & discipline: Only size up with post-FOMC validated reaction or confirmed breakout. On-chain cluster = invalidation radar for bullish bias.
__________________________________________________________________________________

Tariff uncertainty keeps weighing on the dollar.
Geopolitical risks in the Middle East have eased slightly amid signs of potential negotiations, prompting markets to shift their focus back to the upcoming FOMC and tariffs. Following talks with Canadian Prime Minister Carney, President Trump stated that a trade deal with Canada could be reached within weeks, and also confirmed that a trade agreement with the UK has been signed.
Meanwhile, markets are almost certain that the Fed will keep rates unchanged at the upcoming FOMC, with the probability priced at 99.8%. Wells Fargo expects the inflation outlook to rise due to the delayed impact of higher tariffs, projecting that the year-end median federal funds rate will climb by 25bps to 4.125%.
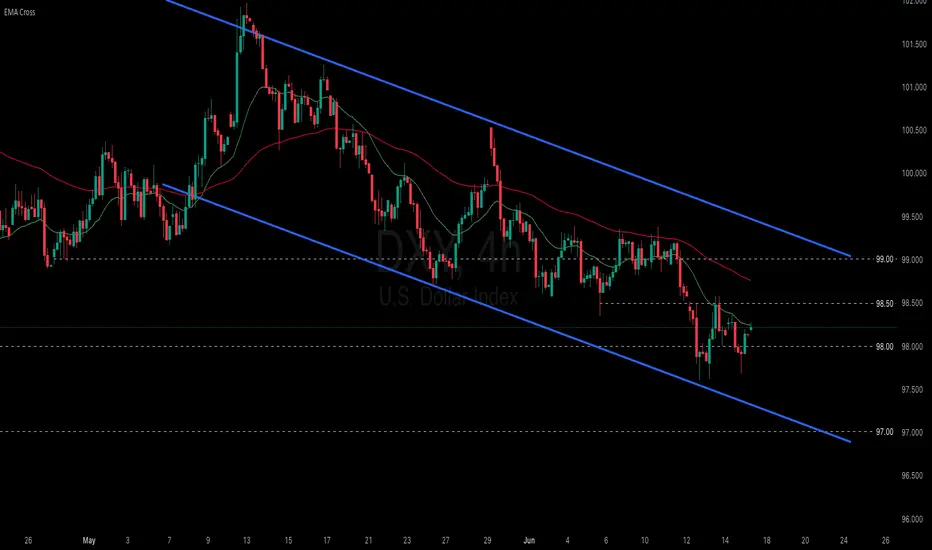
DXY is consolidating within the 97.50–98.50 range, remaining below both EMAs, which suggests a potential continuation of bearish momentum. If DXY breaks below the support at 98.00, the index may retreat to 97.50. Conversely, if DXY breaches above the resistance at 98.50 and the descending trendline, the index could gain upward momentum toward 99.00.
Weekly Market Outlook: FOMC, Trade Deals and GeopoliticsIt is a holiday-shortened week, with the majority of markets halting early on Thursday, June 19, 2025, in observance of Juneteenth. See here for holiday trading schedule
Key Themes to Monitor This Week
Geopolitical Risks
Any outside intervention in the ongoing Israel-Iran conflict will likely be seen as a risk-off event by market participants. Despite Friday’s sell-off, markets shrugged off during the Sunday open and overnight sessions.
There are potential risks to trade routes and energy infrastructure, although disruptions seem unlikely at the moment. Amena Bakr at Kpler noted that, so far, there are no signs of disruptions in oil loadings from Iran. Without a supply outage, there is no pressing need for additional barrels to be brought onto the market.
Trade War and Trade Deals
There have been recent developments with the U.S. reaching key trade deal milestones with several countries. The baseline scenario remains optimistic, with expectations for an extension in negotiations and potential reciprocal tariffs for countries failing to reach agreements.
FED Week
This is a key week for U.S. monetary policy, with the FOMC decision, Summary of Economic Projections (SEP), and Chair Powell’s press conference scheduled.
Traders will be closely watching how the Fed’s inflation and growth expectations have evolved, as reflected in the SEP. All eyes will be on the dot plot to note how interest rate expectations have evolved since last quarter. Of note: Will President Trump’s continued calls for rate cuts influence Chair Powell’s tone or guidance?
Expectations for the Week Ahead
NQ futures have continued one-time framing higher, consistently creating higher lows since the week of April 21, 2025. A strong support zone exists below, anchored at the yearly Volume Point of Control (VPOC) and the Anchored VWAP from May 11, 2025, when markets gapped higher.
Key Levels to Watch
• yVAH: 22,690.50
• R2: 22,510
• R1 / Previous Week High: 22,322.50
• May 11 AVWAP: 21,672.25
• yVPOC: 21,660
Scenario 1: Market Grinds Higher but Stays Cautious
Despite several looming risk factors, the market could continue to grind higher. In this scenario, we anticipate a test above the prior week's high, followed by a potential pullback into last week’s range.
Example Trade Idea 1
• Entry: 22,000
• Stop: 21,930
• Target: 22,322
• Risk: 70 pts
• Reward: 322 pts
• Risk-Reward Ratio: 4.6R
Scenario 2: Pullback to Support, Range-Bound Consolidation
If the market pulls back, we expect the yearly VPOC and AVWAP from May 11 to act as key support levels. In this case, price action may remain range-bound within the previous week’s range, forming an inside week.
Example Trade Idea 2
• Entry: 21,672
• Stop: 21,600
• Target: 22,000
• Risk: 72 pts
• Reward: 328 pts
• Risk-Reward Ratio: 4.6R
________________________________________
Glossary
• VPOC: Volume Point of Control
• VA: Value Area
• VAL: Value Area Low
• VAH: Value Area High
• VP: Volume Profile
• AVP: Anchored Volume Profile
• Y: Yearly
• pWk: Previous Week

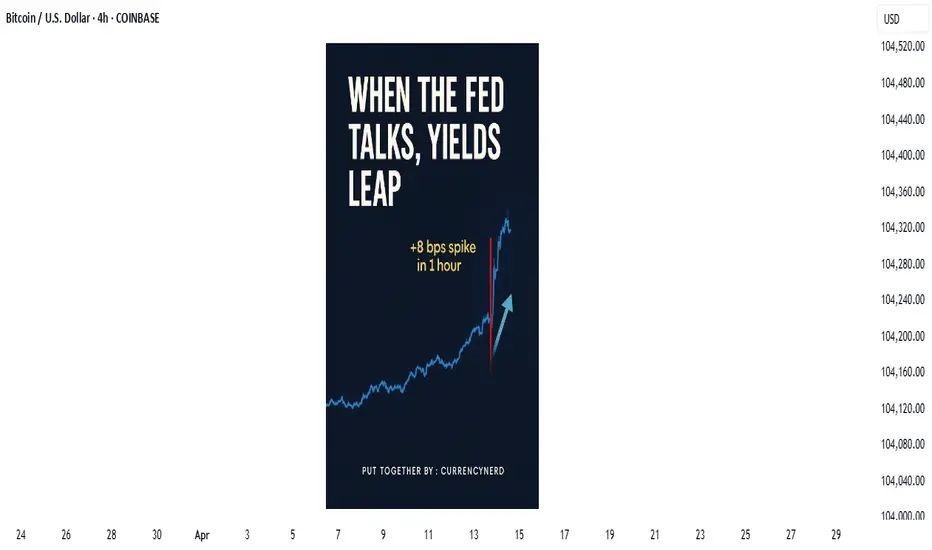
when Jerome says spike, the markets asks how low/high"Watch what they do, but also how they say it."
In the high-stakes world of central banking, few things move markets like the subtle wording of a Fed statement, But beyond the headlines and soundbites, one market absorbs this information faster—and with greater clarity—than almost any other: the bond market.
💬 What Is "Fed Speak"?
"Fed speak" refers to the nuanced and often deliberately vague language used by U.S. Federal Reserve officials when communicating policy expectations. It includes:
FOMC statements
Dot plot projections
Press conferences
Individual speeches from Fed officials
nerdy tip: the Fed aims to influence expectations without committing to specific outcomes, maintaining flexibility while steering market psychology.
📈 The Bond Market as a Decoder
The bond market, particularly the U.S. Treasury market, is where real-time interpretation of Fed policy plays out. Here's how it typically reacts:
1. Short-Term Yields (2Y, 3M) = Fed Expectation Barometer
These are the most sensitive to near-term interest rate expectations. If the Fed sounds hawkish (more rate hikes), short-term yields jump. If dovish (hinting cuts), they fall. At the May 7, 2025 FOMC meeting, the 2-year Treasury yield (US02Y) experienced a modest but clear reaction:
Just before the release, yields were hovering around 3.79%.
In the first hour following the 2:00 PM ET (20:00 UTC+2) statement, the yield ticked up by approximately +8 basis points, temporarily reaching about 3.87%.
Later that day, it eased back to around 3.79%, ending the day roughly unchanged—a sharp, immediate spike followed by a reversion.
2. Long-Term Yields (10Y, 30Y) = Growth + Inflation Expectations
Longer-dated yields reflect how the market sees the economy unfolding over time. After a Fed speech:
Rising long-term yields = stronger growth/inflation expected
Falling yields = fears of recession, disinflation, or policy over-tightening
3. The Yield Curve = Market's Policy Verdict
One of the best tools to read the bond market's verdict is the yield curve—specifically, the spread between 10Y and 2Y yields.
Steepening curve → Market thinks growth is picking up (Fed may be behind the curve)
Flattening or Inversion → Market believes the Fed is too aggressive, risking a slowdown or recession
📉 Example: After Jerome Powell’s hawkish Jackson Hole speech in 2022, the 2Y-10Y spread inverted deeply—markets were pricing in recession risks despite a strong Fed tone.
🧠 Why Traders Must Watch Bonds After Fed Speak
🪙 FX Traders:
Higher yields = stronger USD (carry trade advantage)
Falling yields = weaker USD (lower return for holding)
📈 Equity Traders:
Rising yields = pressure on tech/growth stocks (higher discount rates)
Falling yields = relief rally in risk assets
📊 Macro Traders:
The MOVE Index (bond volatility) often spikes around FOMC events
Forward guidance shifts = big rotation opportunities (e.g., bonds > gold > dollar)
(BONUS NERDY TIP) 🔍 How to Analyze Fed Speak Through Bonds
✅ Step 1: Watch the 2Y Yield
First responder to new rate expectations.
✅ Step 2: Check the Fed Funds Futures
Compare market pricing pre- and post-statement.
✅ Step 3: Look at Yield Curve Movement
Steepening or inversion? That’s the market’s macro take.
✅ Step 4: Track TLT or 10Y Yield on Your Chart
Bond ETFs or Treasury yields reveal sentiment instantly.
🧭 Final Nerdy Thought : Bonds React First, Talk Later
When the Fed speaks, don't just read the words. Read the yields. The bond market is often the first to interpret what the Fed really means—and the first to price in what comes next.
So next FOMC meeting, instead of watching only Powell’s facial expressions or CNBC pundits, open a chart of the 2Y and 10Y. That’s where the smart money’s listening.
put together by : @currencynerd as Pako Phutietsile
courtesy of : @TradingView