$UAL Riding the Turbulence$UAL stock dropped due to Q1 cost and downtime headwinds, but airlines expect strong demand and Q2 profitability.
I'm opening 1/3 call position, adding 2 more times if weakness continues:
Strike: $45.
Exp: 6/16/23 or later
Cost: $3.60 per contract
The cost per contract could be lower based on market movements tomorrow. I plan to swing my first 1/3 $UAL call position through #FOMC and will update on this position going forward to the point of sale.
FOMC

DXY Potential Forecast | 10th March 2023Fundamental Backdrop
1. USD continues to face uncertainty and volatility due to the SVB crisis.
2. All eyes will be on the FOMC meeting and the Fed Fund Rate.
3. More dovish on the USD will lead to EURUSD heading higher.
4. Fed might be restricted to hike rates by 50bps due to the instability of the banking industry in the US.
Technical Confluences
1. Price rejected off the resistance at 105.3.
2. Price can potentially come lower to reach support level at 102.65.
3. Given the uncertainty and fear, DXY has reason to continue heading down.
Idea
DXY can tap into the support area at 102.65.
NOT FINANCIAL ADVICE DISCLAIMER
The trading related ideas posted by OlympusLabs are for educational and informational purposes only and should not be considered as financial advice. Trading in financial markets involves a high degree of risk, and individuals should carefully consider their investment objectives, financial situation, and risk tolerance before making any trading decisions based on our ideas.
We are not a licensed financial advisor or professional, and the information we are providing is based on our personal experience and research. We make no guarantees or promises regarding the accuracy, completeness, or reliability of the information provided, and users should do their own research and analysis before making any trades.
Users should be aware that trading involves significant risk, and there is no guarantee of profit. Any trading strategy may result in losses, and individuals should be prepared to accept those risks.
OlympusLabs and its affiliates are not responsible for any losses or damages that may result from the use of our trading related ideas or the information provided on our platform. Users should seek the advice of a licensed financial advisor or professional if they have any doubts or concerns about their investment strategies.

EURUSD Potential Forecast | 20th March 2023Fundamental Backdrop
1. ECB most recently hiked rates by 50bps.
2. USD continues to face uncertainty and volatility due to the SVB crisis.
3. All eyes will be on the FOMC meeting and the Fed Fund Rate.
4. More dovish on the USD will lead to EURUSD heading higher.
Technical Confluences
1. Support level at 1.0519 where price rejected off.
2. Price can potentially come up to tap into the resistance level on the H4 at 1.0794.
3. Price action continues to be very choppy.
Idea
EURUSD have further potential for bulls and I am anticipating for price to continue heading up.
NOT FINANCIAL ADVICE DISCLAIMER
The trading related ideas posted by OlympusLabs are for educational and informational purposes only and should not be considered as financial advice. Trading in financial markets involves a high degree of risk, and individuals should carefully consider their investment objectives, financial situation, and risk tolerance before making any trading decisions based on our ideas.
We are not a licensed financial advisor or professional, and the information we are providing is based on our personal experience and research. We make no guarantees or promises regarding the accuracy, completeness, or reliability of the information provided, and users should do their own research and analysis before making any trades.
Users should be aware that trading involves significant risk, and there is no guarantee of profit. Any trading strategy may result in losses, and individuals should be prepared to accept those risks.
OlympusLabs and its affiliates are not responsible for any losses or damages that may result from the use of our trading related ideas or the information provided on our platform. Users should seek the advice of a licensed financial advisor or professional if they have any doubts or concerns about their investment strategies.

USDJPY: GO SHORTSELL USDJPY
ENTRY: 132.25-132.30
STOP LOSS: 134.26
TAKE PROFIT: 126.82
The JPY has been one of the main beneficiaries so far from the loss of confidence in the health of the banking system. While policymakers have taken steps over the past week to address those concerns,
it is not yet clear that they are sufficient on their own to quickly restore investor confidence. A further run on deposits and tightening of financial conditions remains a risk that could trigger a deeper sell-off for risk assets.
As a result, it will be difficult for the Fed to strike a hawkish tone in the week ahead even though inflation remains uncomfortably high. A decision to delay further hikes until confidence returns in the banking sector could open the door to further downside for USD/JPY in the week ahead, and encourage US rate market participants to speculate that the next move could even be a cut. At the same time, the recently released results from the annual
Shunto wage negotiations in Japan could reinforce speculative demand for the JPY in the near-term. The results revealed that Japanese labour unions secured stronger wage agreements for the coming fiscal year. Overall wages are expected to increase by 3.8% and base wages by 2.07%. It is the strongest wage agreements reached since 1993 and could encourage the BoJ to shift away from looser policy in the year ahead.
SIMPLE IS BEST

DXY Outlook 20th March 2023Through last week, the DXY traded with significant volatility due to not only the Silicon Valley Bank (SVB) collapse but also the slowdown in US inflation growth, with US CPI being released at 6% (Previous: 6.4%).
As the downward pressure continues on the DXY, a brief retracement to the upside could be anticipated however, the 23.60 and 38.20 Fibonacci levels are likely to provide strong resistance.
Look for the DXY to possibly trade lower toward the 103.50 support level after the current retracement/consolidation. If the price breaks beyond 103.50, the next key support level is at 102.60.
Price could trade in a consolidation manner with some choppy action with the FOMC rate decision due this week (25bps rate hike expected)

Happy CPI day! (AUDUSD Trade idea)Happy CPI day! (AUDUSD Trade idea)
Hello...Another day, another trade opportunity!
Today we have the CPI, I spoke about banks over the weekend and how they will become under pressure to rates increase, it's part of debt cycle - I will recommend you watch it as well research into what a debt cycle is and what assets get affected. Now, headlines bring in fear, in my person opinion, technically JPM was bearish pattern and it break to down side, that's when I use the classic line ' Trade what you see, not what you think'. Ignoring the noise everyday is key! It wasn't major deal we not going back to 2008! The Feds have improved as time goes by there are tools! That's another aspect you should research into! Now that's all over done with and was sorted on the weekend Sunday evening. Now we did see dollar decline and GBP, EUR, NZD headed higher AUD is lacking the momentum, there are several factors why as we see copper range bound, AUD this week unemployment rate but today we do have CPI which could edge this certain pair either direction. A good set up to trade would be AUDNZD.
Estimated to be CPI y/y: 6.0% Banks has there view of it being in-line. Now, if we look at CME rate basis %, the risk of 50 basis point is declining and 25 maybe priced in but for the feds to hike even further that's declining as well.
Technically AUD: RANGE for now.
Within range, at key trendline resistance a break above I expect 200 EMA to be target areas. If we break below the key support areas of 0.65750 areas then I expect 0.64700 areas.
Trade Safe!
Trade Journal

March FOMC meeting preview – The Fed to soldier on with hikes Times to be aware of:
23 March at 5 am AEDT (6 pm GMT) – Chair Powell’s press conference at 05:30 AEDT
While there is much debate around this call, I still think we’re staring at the Fed delivering a 25bp hike at the upcoming FOMC meeting. Where the risks to the USD are skewed to the long side.
It is a call that is certainly being hotly debated and while economists at Nomura see a 25bp rate cut and a pause in QT (Quantitative Tightening), and we see Goldman’s, Wells Fargo and Barclays calling for no change in rates, nearly 90% of economists (polled by Bloomberg) still see a 25bp hike.
Most importantly, when we’re thinking of the potential reaction in the USD, gold, and equity markets, is the current market pricing and positioning.
The move in interest rate futures or swaps to the FOMC statement is typically the first derivative and it is what the US 2-Year Treasuries and the USD (and other markets) will correlate to – higher yields should equate to a stronger USD, and a lower gold and equity price and vice versa.
Market pricing is key
At this moment we see interest rate markets pricing 19bp of hikes at this FOMC meeting, so that’s a 75% chance of a 25bp hike. We reach peak pricing of 4.96% by the May FOMC meeting, before falling towards 4.31% by year-end – equating to just over 2 rate cuts.
Swaps pricing per meeting - prices correct as of 15 March
This interest rate pricing changes dynamically and could look very different in the hours before the meeting.
If it weren’t for the news flow and volatility in the banking space, then we’d be arguing about a 25bp or 50bp hike.
A 50bp hike is clearly off the table and would be seen as a mistake in the eyes of the market.
Of course, Chairman Powell only recently opened the possibility of a 50bp at his testimony to the Senate Banking Committee – but given the brewing risks, a 50bp would shock and risk assets would be punished.
As it is we’re debating a 25bp hike or a pause. I think the Fed will acknowledge they’re watching developments in the banking space, but they are far more reactive these days and set policy to what they can see in front of them – and the data supports a 25bp hike.
We’ve some cooling in the labour market but it’s still hot. The Feb US CPI print can be sliced and diced to fit any bias, but I see it supporting a 25bp hike, especially if we look at the month-on-month metrics, which have shown acceleration. The Fed focus heavily on core CPI ex-shelter which increased +0.5% MoM, in fitting with a central bank that needs to do more.
What are the key drivers of market volatility?
When 16bp of hikes are priced, if the Fed hike by 25bp then all things being equal the USD should initially spike higher. If rates are kept unchanged then the USD should fall and equities (like the NAS100) rally. So what they do with the fed funds rate at this meeting is the first consideration.
However, perhaps the more lasting impact on markets will come from the ‘dots plot’ projection – this is where the individual Fed members provide their estimates for where the fed funds rate could be by year-end 2023, 2024 and 2025.
Fed’s dots and economic projection – December FOMC
At the December FOMC meeting the median projection for the fed funds rate by end-2023 was 5.12% and 4.12% for end-2024. However, given market expectations and pricing (in interest rate swaps) are far lower at 4.31% and 3.40% for these periods respectively, there is a clear disconnect.
This divergence between the current set of Fed fund projections (‘dots’) and the market pricing suggests the market feels strongly that the Fed will lower its forecasts for the fed funds rate for these dates.
Should the Fed fail to do this, and especially if the FOMC statement shows little concern for the issues afoot in the banking sector and the potential for new regulations, with far tighter credit conditions and increased charges for borrowers, then markets could light up with volatility.
Conversely, if the market does see the Fed coming sufficiently towards market pricing it could be a very important moment in this cycle – in theory, it should support growth stocks, high beta FX (such as the AUD) crypto and gold, while the USD is sold. However, much depends on the statement and the level of concern expressed as to why they have lowered its projections.
The balance of risk
My own view is that the Fed will hike by 25bp and fail to lower its ‘dot plot’ projection sufficiently and market pricing will be disappointed – this could potentially lead to a higher USD and drawdown in equity and gold. As always trading over news has its challenges, but for all risk managers will measure where the skew in risk is over key events.

SP500 - Targets from here on.We closed above the decending trendline from januari 2022. Many traders are drawing this line wrong ATM to match their bias. Beware. We closed above which is very bullish but many people are saying that we closed BELOW, they try to match this scenario with 2008 and 00. It is not unlikely that we break down under the trendline again, but right now this isnt the case.
Here are my shortterm targets for SP500. I wait for the FOMC tomorrow and expecting a pause of the rate hikes because the banking crisis we had last week. A pause will send us up towards 4311. 0.25 hike means neutral and 0.50 will send us down towards 3600.
DO NOT trade into FOMC, it is pure gambling, it doesn't matter how "sure" you are.
Good luck.

Very ODD Day TodayTVC:DXY
Thanks to SVB, Biden's comments and Fed Chair decision looming, the markets are very ODD today.
This is where trade management comes into play.
If you didn't check your greed at the door during NY session, then you probably got chopped around going to the big TP's
Trade smart
Trade well

USD/JPY - I Tried before Fed MeetingOANDA:USDJPY
Tried for a scalp to the short side ahead of Fed Meeting, didn't work out, stopped put at +1pip
Now I can wait in line and buy some fancy coffee.
Trade management is key.
Trade smart
Trade well

XRT short - below .618 Fib levelRejecting down trendline, below 50 DMA and the option flow ratio for March 17th is 4:1 puts.
Very strong numbers from economy today, which means the FED will have to raise rates again at some point this year.
I have been following the FOMC for 6 years, take every meeting cautiously. We also have CPI numbers on the 14th.
I am holding MArch 24th 61 puts at $1.15
GL!

DXY Potential Forecast | 10th March 2023Fundamental Backdrop
1. NFP due today at 930pm GMT +8.
2. NFP print and average earnings will be key to the direction of the USD.
3. Fed Powell's speech that "Fed is prepared to speed up rate rises if warranted by data releases", resulted in strong bullish pressure on DXY and USD across markets.
4. A few US data releases has coincided nicely with Powell's speech.
5. ADP Non-Farm Employment Change came out at 242000 jobs compared to a forecasted 197000 and 119000 previous.
Technical Confluences
1. Price is still in a retracement.
2. All eyes on NFP tonight at 930pm GMT +8.
3. Anticipating for price to head higher to clear further levels above.
Idea
I will be looking for price to continue its bullish momentum in the market.
NOT FINANCIAL ADVICE DISCLAIMER
The trading related ideas posted by OlympusLabs are for educational and informational purposes only and should not be considered as financial advice. Trading in financial markets involves a high degree of risk, and individuals should carefully consider their investment objectives, financial situation, and risk tolerance before making any trading decisions based on our ideas.
We are not a licensed financial advisor or professional, and the information we are providing is based on our personal experience and research. We make no guarantees or promises regarding the accuracy, completeness, or reliability of the information provided, and users should do their own research and analysis before making any trades.
Users should be aware that trading involves significant risk, and there is no guarantee of profit. Any trading strategy may result in losses, and individuals should be prepared to accept those risks.
OlympusLabs and its affiliates are not responsible for any losses or damages that may result from the use of our trading related ideas or the information provided on our platform. Users should seek the advice of a licensed financial advisor or professional if they have any doubts or concerns about their investment strategies.

Pre-NFP Analysis | 9th March 2023Fundamental Context
1. Fed Powell's speech that "Fed is prepared to speed up rate rises if warranted by data releases", resulted in strong bullish pressure on DXY and USD across markets.
2. A few US data releases has coincided nicely with Powell's speech.
3. ADP Non-Farm Employment Change came out at 242000 jobs compared to a forecasted 197000 and 119000 previous.
4. JOLTS Job Openings came out at 10.82m compared to a forecasted 10.58m, beating expectations.
5. All eyes will be on NFP releasing tomorrow.
6. Given the recent strong USD fundamental news release, there is reason to believe that the NFP print will come out stronger than expected, which will highlight the resilience of the US economy once again.
At Olympus Lab, we believe that the USD can continue heading bullish in the market.
NOT FINANCIAL ADVICE DISCLAIMER
The trading related ideas posted by OlympusLabs are for educational and informational purposes only and should not be considered as financial advice. Trading in financial markets involves a high degree of risk, and individuals should carefully consider their investment objectives, financial situation, and risk tolerance before making any trading decisions based on our ideas.
We are not a licensed financial advisor or professional, and the information we are providing is based on our personal experience and research. We make no guarantees or promises regarding the accuracy, completeness, or reliability of the information provided, and users should do their own research and analysis before making any trades.
Users should be aware that trading involves significant risk, and there is no guarantee of profit. Any trading strategy may result in losses, and individuals should be prepared to accept those risks.
OlympusLabs and its affiliates are not responsible for any losses or damages that may result from the use of our trading related ideas or the information provided on our platform. Users should seek the advice of a licensed financial advisor or professional if they have any doubts or concerns about their investment strategies.

EURUSD:Couple of Scenarios depending on Friday's NFPHey Traders, above is a technical overview on EURUSD and the most important zones to watch, Fed yesterday have threw some hawkish comments "rates are likely to be higher than previously anticipated", but before the next FOMC we have a couple of events to consider. First of all NFP and next week CPI data.
If NFP comes again above expectations that will signal more rate hikes from the fed and thus more USD strength and EURUSD downsides. If the numbers are normal that will not be enough for fed to hike rates massively. and for CPI it's the same story. Numbers above expectations will lead to a more restrictive monetary policy and normal number will slow down the pace.
Feel free to ask any questions in the comment section.
Trade safe, Joe.

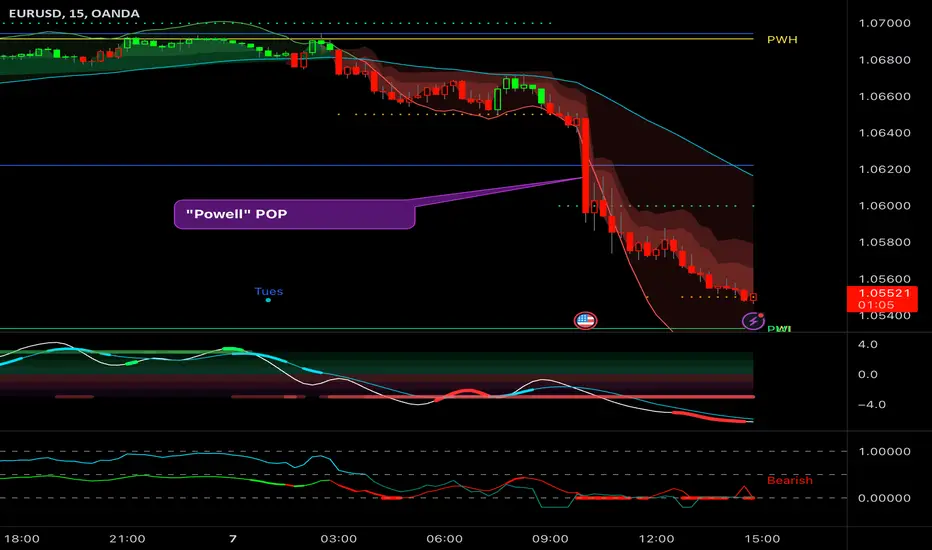
EUR/USD - The Powell "POP"OANDA:EURUSD
It's obvious on most assets today, the "Powell POP..." strikes again.
Trade well
EUR/JPY - DXY Told us somethingOANDA:EURJPY
Initial DXY dollar reaction to Fed Chair, bullish move.
So looking for plays and took the EUR/JPY
Easy 10pip short hard TP
When all triggers align, don't second guess, jump in, do or die.
They key is TRADE MANAGEMENT.
Trade well

Here We Go - The Real Start of the WeekTVC:DXY
Jerome Hayden "Jay" Powell
Chair of the Federal Reserve
Testimony
10:00am NY EST UTC-5
Trade Well

XAUUSD 5TH MAR XAUUSD looking pretty similar to U.S. oil here for our Sunday analysis.
We have a clear supply at the high of our swing, it's unmitigated with a clear level of imbalance.
I'm looking for a clear bearish rejection from this zone to then look for either a run of the low on the larger time frame or a pullback from our demand areas highlighted below.
If, for example, we don't hit this area of supply, I'll be looking for Long's from the areas of demand.
Overall, both options add up to one move being overall sell off for gold. Current price action is bullish, so we need to see a clear reversal to confirm this.
Make sure that you always use your confirmations to get into a trade and always be flexible with your analysis. Remember, sticking to your trading plan and consistently entering the same setups will bring you profitability.
If you like this idea, drop us a boost and a comment down below.
We hope you all have a profitable and successful trading week.

BTC UPDATETwo scenarious to look out for...
if the bulls take the horn we would see a recovery to test the 200 days moving average at around 23.3k.
otherwise a breakdown would cost us another long wick down to 21.6k
🚨IMP Event to Watch in March 📈
- US CPI release on March 14th
- FOMC meeting on March 22nd
In the picture is also the Mt. Gox event. The distribution of funds to creditors of the defunct crypto exchange is set to kick off on March 10, 2023.
Whats your perspective? do you think the bulls or bears would have more control over the market, cosidering these events and the overview market sentiment?

USDCAD: Top of the range?Looking back over this pair, it's been ranging for a long time.
The candlestick patterns are clearly showing rejection, we now have a doji to back up the change of direction potential.
Fundamentally it seems hat it doesn't matter how good the US news is, the dollar's fate is sealed.
Interesting to see how NFP goes on Friday (but still can't see it getting much past 105.5 even with positive news). I'll probably wait on this pair until after the event has calmed down before getting involved.
Overall I'm bearish on this, waiting for a good entry for at least a 4:1 score initially, but think it'll go further.

DXY:A Temporary push to upsides as Yields riseHey Traders, today we have noticed a temporary push to upsides as treasury Yields near 5%, but that will not be enough to push DXY above the major trend again as we see the price have rejected the retrace zone along with the double top. so we expect that USD will resume the downsides and remain indecisive until the release of CPI so the market will have a more clear idea on Fed next actions. if CPI numbers are high that won't make fed happy so we'll expect further rate hikes and more of USD strength.. in the opposite sense if CPI numbers come low we can expect more of a weak dollar and less restrictive monetary Policy.
Trade safe, Joe.

SPY Prediction through next FOMC meeting March 21st and beyond.Looking at the past FOMC meetings, we always had a green day, and then a red day, followed with the beginn of a new downtrend. Since the economy is not slowing down as fast as needed for inflation to drop, we might be looking at 25 to 50 points rate hikes. If this will play out, then on the daily we will see a head and shoulders pattern forming.

Sweet Divergence Since the start of January, most leading macro markets have experienced a reversal around their 38.2% Fibonacci retracement levels. However, BTC has shown resilience and fought the cross-asset sell-off. This divergence is likely driven by the fact that there has been over $1 trillion in net liquidity added to the market since the bottom in October, primarily driven by the People's Bank of China and the Bank of Japan, helping to off-set the damage the Fed is doing to risk-on assets such as the crypto market. Considering BTC tends to be somewhat of a liquidity sponge, it tends to outperform other assets when there is a boost in liquidity. However, the jury is still out on whether BTC's performance indicates the end of the bear market for crypto or a temporary outlier. Despite BTC's recent outperformance, it's still catching up to significant rallies in other markets between Q4 2022 and Q1 2023. An important note is that the S&P 500 has never seen a bear market bottom before the unemployment rate began to rise, and this is yet to be the case. Furthermore, the yield curve is currently the most deeply inverted it has been since the 1980s, ultimately signalling that long-term interest rates are lower than short-term interest rates. An inverted yield curve has been a perfect predictor of the last seven recessions since 1960, ultimately implying that it's likely the market isn't out of the woods yet.
When yields and risk assets diverge, historical patterns suggest that other assets quickly catch up to the sell-off. Although yields have moved exponentially since last month's CPI data, markets expect them to stabilize at last year's high levels. It would likely take very hot inflation data and a significant rate hike following the next FOMC meeting on the 22nd of March to trigger the next leg lower for risk assets. Until then, BTC is expected to continue ranging, waiting for its next cue.
In other news, a recent article by Forbes threw Binance into the fire after they released an alleged hit piece on the exchange and its founder, Changpeng Zhao (CZ). The article drew parallels between the exchange and the now-defunct FTX after Binance allegedly transferred $1.8 billion to hedge funds such as Tron, Amber Group and Alameda Research between August and December 2022. However, CZ then hit back at this, arguing that the article referred to some old transactions from Binance's clients. He then reiterated that the exchange always holds user funds 1:1 and that this can be referenced through Binance's proof-of-reserve system.
From a technical perspective, it is clear from the weekly chart that Bitcoin has been trading between two significant demand and supply zones. The bulls will be hoping for a weekly close above the $25,000 supply zone, which would light the way towards the massive $28,800 to $30,000 resistance, the Head and Shoulders neckline. An important contributor to the bullish scenario is that EMA20 and EMA200 are beginning to converge, with a potential cross in the coming weeks. The importance of this should be considered, as EMA20 crossing below EMA200 back in September accurately predicted short-term market direction. Bears will rejoice at the fact that many traders believe that a final Elliot Wave 5 sell-off is to come. This would likely result in a break below the $15,500 - $16,500 November market bottom.
As we advance, all eyes will be on the CPI data releases. U.S. CPI data on the 14th will likely dictate the outcome of the rate decision of the FOMC on the 22nd. Volatility will be high around these dates, so caution should certainly be exercised, especially in leveraged positions.
