Unveiling the Impact of #FOMC Decisions on #WTI, #Gold, #USD Today was #FOMC! I'm Sure most of us had same experience on BLACKBULL:WTI and $OANDA:XAUUSD. I Just wanted to write about What is #FOMC and It's impact on #WTI, #Gold and #USD, Maybe somebody has lots of questions about that, so I try to do my best regarding captioned subject.
The Federal Open Market Committee (#FOMC) plays a crucial role in shaping monetary policy in the United States. The decisions made by this committee have significant implications for various financial markets, including commodities like West Texas Intermediate (#WTI) crude oil, #gold, and the U.S. dollar (#USD). Understanding the impact of FOMC decisions on these assets is essential for traders, investors, and market participants.
The FOMC's Role and Decision-Making Process:
The FOMC is composed of members from the Federal Reserve System who are responsible for setting monetary policy. These members regularly convene to assess economic conditions, review data, and deliberate on the best course of action. One of the most critical outcomes of these meetings is the announcement of the federal funds rate, which influences borrowing costs and has a broad impact on the financial landscape.
BLACKBULL:WTI :
FOMC decisions have a notable impact on WTI crude oil prices. Changes in interest rates directly affect borrowing costs for businesses, which, in turn, influence their operations and investment decisions. When interest rates decrease, economic growth is often stimulated, leading to increased demand for oil and potentially driving up prices. Conversely, an increase in interest rates may have the opposite effect, dampening economic activity and reducing oil demand.
Additionally, FOMC decisions indirectly impact WTI crude oil prices through their effects on the U.S. dollar. Since oil is globally priced in dollars, fluctuations in the dollar's value can influence the purchasing power of oil-importing countries. A weaker dollar can make oil relatively cheaper, increasing demand and potentially bolstering #WTI prices.
OANDA:XAUUSD :
The relationship between FOMC decisions and gold prices is complex and multi-faceted. Gold is often considered a safe-haven asset and a store of value during times of economic uncertainty. When the FOMC adopts a dovish or accommodative monetary policy stance, such as lowering interest rates or implementing quantitative easing measures, it diminishes the attractiveness of holding U.S. dollars. Consequently, investors may seek refuge in #gold, leading to an increase in gold prices.
Conversely, a hawkish stance by the FOMC, signaled by raising interest rates or indicating tighter monetary policy, can strengthen the U.S. dollar and exert downward pressure on #gold prices. As interest rates rise, the opportunity cost of holding gold, which does not yield interest or dividends, increases. This can make alternative investments more appealing, potentially reducing demand for gold.
PEPPERSTONE:USDX :
FOMC decisions have a direct and significant impact on the value of the #USD. Changes in interest rates influence the relative attractiveness of U.S. dollar-denominated assets, which in turn affects currency exchange rates. A rise in interest rates can make the #USD more appealing to investors seeking higher yields, potentially strengthening the currency. Conversely, a reduction in interest rates may lead to a decline in the value of the U.S. dollar.
Moreover, FOMC decisions and accompanying statements provide insights into the central bank's economic outlook. Favorable economic projections and indications of a tightening monetary policy can bolster confidence in the #USD. Conversely, cautious or pessimistic remarks may weaken the currency.
Final Words:
FOMC decisions have a substantial impact on #WTI crude oil, #gold, and the value of the #USD. Changes in interest rates directly influence borrowing costs, economic growth, and investment decisions, thereby impacting #WTI crude oil prices. Additionally, the effects of FOMC decisions on the U.S. dollar indirectly influence #WTI crude oil
This article serves as a comprehensive guide, offering valuable insights that will enhance your understanding of the FOMC and its impact on financial markets AND May your journey through the intricacies of the FOMC empower you with a solid strategy and guide you towards successful trades, or encourage you to exercise caution and refrain from trading during these significant events. Wishing you the best of luck in your endeavors!
Fomcnews

GBPUSD I FOMC trading plan and levels to watch Welcome back! Let me know your thoughts in the comments!
** GBPUSD Analysis - Listen to video!
We recommend that you keep this pair on your watchlist and enter when the entry criteria of your strategy is met.
Please support this idea with a LIKE and COMMENT if you find it useful and Click "Follow" on our profile if you'd like these trade ideas delivered straight to your email in the future.
Thanks for your continued support!

price formation to occur on goldgold have been on sideways which needs to form a buy decline around 1967 and head below 1956 first limit before the second target b1949.

Got mine, happy Friday, doneOANDA:EURUSD
Took a short scalp before news and TP hit
Nice way to end the week, a good week....

$SPY Fibonacci Support & Resistance AMEX:SPY Fibonacci Support & Resistance levels, we are right at the 50% price

Analyzing the Impact of FOMC Meetings on Stock PricesAs a stock trader, it's important to pay attention to major events that can impact the market, such as the Federal Open Market Committee (FOMC) meetings. These meetings can have a significant impact on stock prices, and understanding their historical trends can help you make informed trading decisions.
In preparation for the upcoming FOMC meeting on May 3, 2023, we've analyzed the highs from each FOMC meeting since 2021. We've compiled this data into a timeline that shows the market's reaction to these meetings, with vertical lines indicating market open and close.
As you can see from the image below, the majority of market movers occur in the after-hours trading following the FOMC meeting. This can be attributed to the fact that traders are reacting to the decisions made by the committee and adjusting their positions accordingly.
We've also calculated the percentage change from the original opening line to the high point for each meeting, with the highest mover being 6.14% and the lowest being 4.25%. These results were found at market close on Thursday following the FOMC meeting.
It's worth noting that past performance is not necessarily indicative of future results, and the market can be unpredictable. However, analyzing historical trends can be a useful tool for stock traders who want to be prepared for potential market movements.
In conclusion, the FOMC meeting on May 3, 2023, is likely to have an impact on the stock market. By understanding historical trends and analyzing market data, traders can be better equipped to make informed trading decisions. We hope that this analysis has provided some useful insights and helps you navigate the market with confidence.
I hope that this analysis of previous FOMC meetings and their impact on the stock market will be helpful to anyone who is curious or considering trading tomorrow. However, we want to emphasize the importance of doing your own due diligence and research before making any trading decisions. The FOMC meetings can be highly unpredictable, and it's essential to trade smart and cautiously.
As our analysis shows, the majority of market movement following the FOMC meetings tends to occur in the after-hours trading, making it even more crucial to be cautious. Therefore, it's crucial to stay informed, keep an eye on market trends, and use historical trends as a guide while making informed trading decisions.
In conclusion, I hope this analysis provides helpful insights for traders and investors, but remember to exer cise caution and always be mindful of the risks involved in trading. Happy trading!


XAUUSDI'm expecting huge buys from Gold this week due to the events we are having on Tuesday and so on.... This is the analysis for XAUUSD (Gold)
CPI
FOMC

Favoring sells But sitting on Sidelines. Interest Rates⛔-->->EU I like the Risk to reward to the downside. However, and similar to Feb 1st Announcement, we could rip upwards to the Moon similar to first landing on the moon. We'll See what happens as we sit on the sidelines. Beware of position sizing during intraday scalping 1Hr after announcement. Which I have found typically to be the best time to trade surrounding news trading.
Price is currently sitting underneath our 1.08 Daily zone. If we decide to move up our next target will be 1.08539 Daily Level. Other than that we have rather clean traffic heading up on the 4hr. If the market determines that pessimism is strong enough, we will respect our daily level here at 1.08, and leave a wick of liquidity catching breakout traders to the downside. Going down, I can observe us reaching 1.074 Daily level relatively easy once again. Anticpating crazy volatility here. Those are expecatations but we could be disappointed. Manage expectations. Safe trading.

EURUSD FOMCThis is my FOMC prediction for EURUSD. I will take the buyside liquidity first and than go lower for the sellside liquidity.

FED Interest Rates and it's mechanism BINANCE:BTCUSDT
In the United States, the federal funds rate is the interest rate at which depository institutions (banks and credit unions) lend reserve balances to other depository institutions overnight on an uncollateralized basis. Reserve balances are amounts held at the Federal Reserve to maintain depository institutions' reserve requirements. Institutions with surplus balances in their accounts lend those balances to institutions in need of larger balances. The federal funds rate is an important benchmark in financial markets.
The effective federal funds rate (EFFR) is calculated as the effective median interest rate of overnight federal funds transactions during the previous business day. It is published daily by the Federal Reserve Bank of New York.
The federal funds target range is determined by a meeting of the members of the Federal Open Market Committee (FOMC) which normally occurs eight times a year about seven weeks apart. The committee may also hold additional meetings and implement target rate changes outside of its normal schedule.
The Federal Reserve uses open market operations to bring the effective rate into the target range. The target range is chosen in part to influence the money supply in the U.S. economy
Financial institutions are obligated by law to hold liquid assets that can be used to cover sustained net cash outflows. Among these assets are the deposits that the institutions maintain, directly or indirectly, with a Federal Reserve Bank. An institution that is below its required liquidity can address this temporarily by borrowing from institutions that have Federal Reserve deposits in excess of the requirement. The interest rate that a borrowing bank pays to a lending bank to borrow the funds is negotiated between the two banks, and the weighted average of this rate across all such transactions is the effective federal funds rate.
The Federal Open Market Committee regularly sets a target range for the federal funds rate according to its policy goals and the economic conditions of the United States. It directs the Federal Reserve Banks to influence the rate toward that range with open market operations or adjustments to their own deposit interest rates. Although this is commonly referred to as "setting interest rates," the effect is not immediate and depends on the banks' response to money market conditions. Separately, the Federal Reserve lends directly to institutions through its discount window, at a rate that is usually higher than the federal funds rate.
Future contracts in the federal funds rate trade on the Chicago Board of Trade (CBOT), and the financial press refer to these contracts when estimating the probabilities of upcoming FOMC actions.
When the FOMC wishes to reduce interest rates they will increase the supply of money by buying government securities. When additional supply is added and everything else remains constant, the price of borrowed funds – the federal funds rate – falls. Conversely, when the Committee wishes to increase the federal funds rate, they will instruct the Desk Manager to sell government securities, thereby taking the money they earn on the proceeds of those sales out of circulation and reducing the money supply. When supply is taken away and everything else remains constant, the interest rate will normally rise.
The Federal Reserve has responded to a potential slow-down by lowering the target federal funds rate during recessions and other periods of lower growth. In fact, the Committee's lowering has recently predated recessions, in order to stimulate the economy and cushion the fall. Reducing the federal funds rate makes money cheaper, allowing an influx of credit into the economy through all types of loans.

BTC Ready To Dump Fast And Hard-Crash Is ImminentBTC/1H Still in that Parallel Upwards channel
*I FORGOT to mention there is a ascending triangle pattern on btc which I think its jebaiting the longers*
Today is FOMC day where rate hike will be announced and will have huge impact on whole market , not only traditional but crypto as well.
We usually get a move to both side around (%3) liquidating all the high leverages which we call ( sweeping the highs and lows) after than the move will come
IMO its a capitulation candle downwards around 23K. could be worse .
Thanks you for watching-
Please support the channel by Follow,Boost,Comment and Sharing

VIX: MICRO VOLATILITY CYCLES / POINTS OF CONTROL / MACD & RSI DESCRIPTION: In the chart above I have provided a MICRO ANALYSIS of the VIX INDEX which represents volatility in the overall US MARKET. This is a short term play for this week based on micro volatility cycles.
POINTS:
1. Deviation in critical thresholds is 4 points a small adjustment from previous VIX charts published as volatility adheres to this more often.
2. 23 Point serves as critical support for VIX.
3. Current Trend = Symmetrical Triangle Formation 2nd Phase
4. Overlapping Green Dotted Lines = Market Open
5. Overlapping Red Dotted Lines = Market Close
IMO: In my opinion whether or not current setup becomes invalidated I do not see current price action falling below 23 POINTS is the POINT OF CONTROL TO THE DOWNSIDE while 31 POINTS is the POINT OF CONTROL TO THE UPSIDE.
MACD: Current MACD levels continue to fall and are bound to flip into negative territory further confirming current setup that needs some pullback for VIX.
RSI: Current RSI levels are dropping and no current signs of DIVERGENCE that would indicate a sudden flip to positive territory.
SCENARIO #1: VIX price action agrees with current setup & respects symmetrical triangle setup and bounces off 25 in coming session & precedes to the upside to break 29.
SCENARIO #2: VIX price action disagrees with current symmetrical triangle setup and breaks below 25 & faces possible bounce at 23 instead.
FULL CHART LINK:https://www.tradingview.com/chart/UUCv2fGk/
TVC:VIX
AMEX:UVXY

AUD/USD - Kangaroo ScalpOANDA:AUDUSD
The Aussie went down under against the US Dollar for a bit.
So took a scalp of 5pips, yes thats a small 5pip hard TP.
Price action moves 5pips up/down, and any given hour, ANY.
Do the math, Rinse and Repeat...
Trade smart
Trade well

EUR/JPY - DXY Told us somethingOANDA:EURJPY
Initial DXY dollar reaction to Fed Chair, bullish move.
So looking for plays and took the EUR/JPY
Easy 10pip short hard TP
When all triggers align, don't second guess, jump in, do or die.
They key is TRADE MANAGEMENT.
Trade well

Here We Go - The Real Start of the WeekTVC:DXY
Jerome Hayden "Jay" Powell
Chair of the Federal Reserve
Testimony
10:00am NY EST UTC-5
Trade Well

Gold ( Head & Shoulder Pattern ) EasyHey Traders
Another Easy Target For Gold Keep In Mind As Per My Analysis ( You Can Check Out My Previous Analysis To Know More ) Every Pump Is A Selling Opportunity So Be-careful And Good Luck :)

DXY ( Dollar Index)During Friday's New York session, on the 4h TF, there was a strong bearish candle. Mostly, on the 4H TF, whenever there's a strong bearish/ bullish candle. price will re-visit where it once started which is 104.200.
Eyes on the 50 ema which might cut price bearish move at 103.19-18, for a bull run into 104.2
Eyes on the FOMC on Wednesday
#DXY

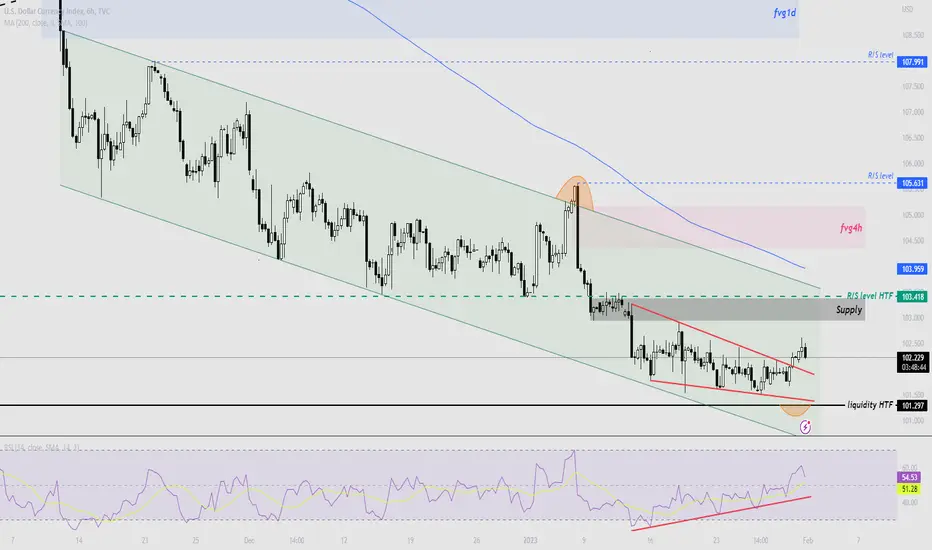
DXY FOMC expectationDXY expectation in and after FOMC meeting... I expect we deviate the lows first before move towards the supply zone... Be alert... When it goes to supply zone first, short it down towards liquidity zone...

NQ Power Range Report with FIB Ext - 2/1/2023 SessionCME_MINI:NQH2023
- PR High: 12121.50
- PR Low: 12096.00
- NZ Spread: 57.0
Evening Stats (As of 12:05 AM)
- Weekend Gap: N/A
- 8/19 Session Gap: -0.04% (open > 13237)
- Session Open ATR: 260.07
- Volume: 19K
- Open Int: 275K
- Trend Grade: Bear
- From ATH: -27.9% (Rounded)
Key Levels (Rounded - Think of these as ranges)
- Long: 12391
- Mid: 11820
- Short: 10678
Keep in mind this is not speculation or a prediction. Only a report of the Power Range with Fib extensions for target hunting. Do your DD! You determine your risk tolerance. You are fully capable of making your own decisions.

BTC updateMy BIAS also has changed on BTC. Bitcoin is weak, parallel with DXY who is broken out, heading towards supply zone. Reverse my setups after new target is hit.
Looking for a "clean" short setup...
The FOMC meeting will disrupt the market again. Will increase my positions after volatility clears up.
Be alert!

DXY update...BIAS changed. The market is weak and DXY is broken out, heading towards supply zone. Reversed my setups...
The FOMC meeting will disrupt the market again. Will increase positions after volatility clears up.
Stay safe...