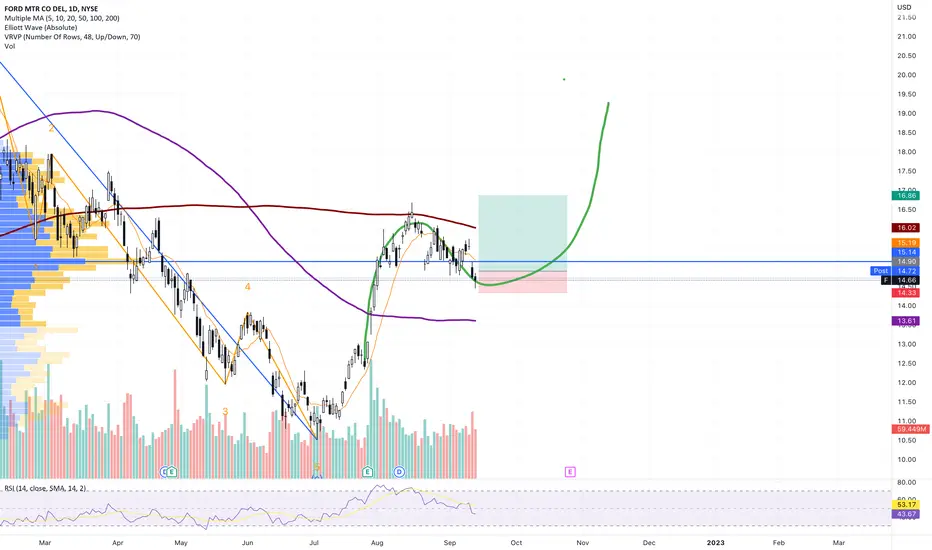
F bullish hammer on daily at the bottom of the S curve restCatching the bottom of the rest of S curve on daily F. A bit concerned about the volume spike (should be low) and earning coming up. The rest is cool.
FORD

Ford stock down big 10%+ and on most active list $f #ford Ford warns investors of $1billion in costs related supply chain issues. Big move in the stock over 10% so far. Makes me wonder if any other car makers are affected. What would you think, yay or nay?

Ford in a falling wedge.Ford - Intraday - We look to Buy a break of 16.11 (stop at 15.38)
Price action has formed a bullish ending wedge formation.
Daily signals are mildly bullish.
The 1 day moving average should provide resistance at 16.00.
A break of 15.80 is needed to confirm follow through bullish momentum.
The bias is to break to the upside.
Our profit targets will be 17.95 and 18.35
Resistance: 15.00 / 15.30 / 15.80
Support: 14.50 / 14.00 / 13.20
Disclaimer – Saxo Bank Group. Please be reminded – you alone are responsible for your trading – both gains and losses. There is a very high degree of risk involved in trading. The technical analysis , like any and all indicators, strategies, columns, articles and other features accessible on/though this site (including those from Signal Centre) are for informational purposes only and should not be construed as investment advice by you. Such technical analysis are believed to be obtained from sources believed to be reliable, but not warrant their respective completeness or accuracy, or warrant any results from the use of the information. Your use of the technical analysis , as would also your use of any and all mentioned indicators, strategies, columns, articles and all other features, is entirely at your own risk and it is your sole responsibility to evaluate the accuracy, completeness and usefulness (including suitability) of the information. You should assess the risk of any trade with your financial adviser and make your own independent decision(s) regarding any tradable products which may be the subject matter of the technical analysis or any of the said indicators, strategies, columns, articles and all other features.
Please also be reminded that if despite the above, any of the said technical analysis (or any of the said indicators, strategies, columns, articles and other features accessible on/through this site) is found to be advisory or a recommendation; and not merely informational in nature, the same is in any event provided with the intention of being for general circulation and availability only. As such it is not intended to and does not form part of any offer or recommendation directed at you specifically, or have any regard to the investment objectives, financial situation or needs of yourself or any other specific person. Before committing to a trade or investment therefore, please seek advice from a financial or other professional adviser regarding the suitability of the product for you and (where available) read the relevant product offer/description documents, including the risk disclosures. If you do not wish to seek such financial advice, please still exercise your mind and consider carefully whether the product is suitable for you because you alone remain responsible for your trading – both gains and losses.

F is resting on daily to continue bullish S curveLove decreasing volume at rest, should compress and shoot up. Will set up a trade once there's a candle

SELL TSLA BUY FORDThis DAILY CHART shows the ratio of the TSLA price to the F price
to generate signals to buy and sell Ford and Tesla by exchanging
stock one for the other upon a signal.
Eton Musk who is not a stupid or poor guy just the other day
sold $6 TSLA stock at the local pivot high. He is an insider;
others will follow his lead.
S horting TSLA or buying near term put options may be a wise
reaction to the move TSLA and its CEO are making.

$F Somebody needs a shampoo here.Not an advise. First PT 14.50 second PT 13.19 Last PT 12
I am probably wrong but I'd like to see what's coming the next days.

FORD Swing Trade after REVERSAL in JulyNYSE:F
F is trending up while TSLA heads down
US Legislation to support EV purchases with tax credits is helpful
GM's financial troubles are helpful.
Chart shows upgoing BB/EMA channels
and mid-range RSI with recent K/D crossover.
Both suggest a potential swing entry. Depend on unforeseen
changes in the automotive market or the market at large
and a recession versus continued uncertainty, F could
the uptrend for several months also made for the
opportunity to trade call options.
Trade often. Trade well !
TSLA versus F - Stock Price and so Market CapThis DAILY chart shows the RATIO between Tesla and Ford stock and so comparisons
between market cap.
A rising ratio indicates that TLSA is gaining market cap compared with F while a decreasing
ratio shows the opposite.
A long-term investor who wants to own either TSLA or F or a blend of the two could use
a chart like this to make trade decisions.
When the ratio is high and approaching the upper BB with high relative strength, such
the hypothetical investor may want to either sell TSLA or buy F.
When the ratio is increasing lower with the value approaching the lower BB and
confirmation with low relative strength he/she might want to buy TSLA or Sell F
or some combination.
This strategy might be back-tested vs an equal proportion of F and TSLA.
without any share swapping.
One caveat moving forward is TSLA has China headwinds, with COVID lockdowns
and the geopolitical uncertainty of the Taiwan situation; F not so much could
easily trump technicals. Additionally, it could help explain why Musk liquidated
$ 6 Billion in shares. NASDAQ:TSLA

#ford powerful twisted continuedHere and there markets are showing up positive signals of what near future will bring.
big markets are ready to suck in more money now.
Here we have a nice burst of price increase for Ford , that we expect to follow up to 18,45 USD by this cycle, with safenets that would suggest 17,90 target for us.

F:Not out of woods yetFord
Short Term - We look to Sell a break of 15.43 (stop at 16.33)
We are trading at overbought extremes. A lower correction is expected. A break of 15.50 is needed to confirm follow through negative momentum. A break of support at 15.50 should lead to a more aggressive move lower towards 13.00. Further downside is expected.
Our profit targets will be 13.04 and 12.00
Resistance: 16.00 / 18.00 / 21.00
Support: 15.50 / 13.00 / 11.00
Please be advised that the information presented on TradingView is provided to Vantage (‘Vantage Global Limited’, ‘we’) by a third-party provider (‘Signal Centre’). Please be reminded that you are solely responsible for the trading decisions on your account. There is a very high degree of risk involved in trading. Any information and/or content is intended entirely for research, educational and informational purposes only and does not constitute investment or consultation advice or investment strategy. The information is not tailored to the investment needs of any specific person and therefore does not involve a consideration of any of the investment objectives, financial situation or needs of any viewer that may receive it. Kindly also note that past performance is not a reliable indicator of future results. Actual results may differ materially from those anticipated in forward-looking or past performance statements. We assume no liability as to the accuracy or completeness of any of the information and/or content provided herein and the Company cannot be held responsible for any omission, mistake nor for any loss or damage including without limitation to any loss of profit which may arise from reliance on any information supplied by Signal Centre.

FORDContinue to our analysis for Ford
Price cross 16$
Waiting for the Retest on the channel to buy again

Is Ford ticker following the uptrend of the Pitch Fork?Let’s see if the current uptrend follows the support / resistance predicted by the pitch fork.

7/27/22 FFord Motor Co ( NYSE:F )
Sector: Consumer Durables (Motor Vehicles)
Market Capitalization: 53.023B
Current Price: $13.19
Breakout price: $13.55
Buy Zone (Top/Bottom Range): $12.60-$10.90
Price Target: $14.80-$15.40 (1st), $17.90-$18.30 (2nd)
Estimated Duration to Target: 28-30d (1st), 70-74d (2nd)
Contract of Interest: $F 8/19/22 14c, $F 12/16/22 15c
Trade price as of publish date: $0.32/contract, $0.75/contract


More af-FORD-able?Ford - Short Term - We look to Buy at 12.42 (stop at 11.47)
Broken out of the channel formation to the upside. Price action looks to be forming a bottom. A higher correction is expected. Expect trading to remain mixed and volatile.
Our profit targets will be 14.45 and 16.00
Resistance: 13.28 / 13.96 / 14.46
Support: 12.42 / 11.78 / 10.61
Disclaimer – Saxo Bank Group. Please be reminded – you alone are responsible for your trading – both gains and losses. There is a very high degree of risk involved in trading. The technical analysis, like any and all indicators, strategies, columns, articles and other features accessible on/though this site (including those from Signal Centre) are for informational purposes only and should not be construed as investment advice by you. Such technical analysis are believed to be obtained from sources believed to be reliable, but not warrant their respective completeness or accuracy, or warrant any results from the use of the information. Your use of the technical analysis, as would also your use of any and all mentioned indicators, strategies, columns, articles and all other features, is entirely at your own risk and it is your sole responsibility to evaluate the accuracy, completeness and usefulness (including suitability) of the information. You should assess the risk of any trade with your financial adviser and make your own independent decision(s) regarding any tradable products which may be the subject matter of the technical analysis or any of the said indicators, strategies, columns, articles and all other features.
Please also be reminded that if despite the above, any of the said technical analysis (or any of the said indicators, strategies, columns, articles and other features accessible on/through this site) is found to be advisory or a recommendation; and not merely informational in nature, the same is in any event provided with the intention of being for general circulation and availability only. As such it is not intended to and does not form part of any offer or recommendation directed at you specifically, or have any regard to the investment objectives, financial situation or needs of yourself or any other specific person. Before committing to a trade or investment therefore, please seek advice from a financial or other professional adviser regarding the suitability of the product for you and (where available) read the relevant product offer/description documents, including the risk disclosures. If you do not wish to seek such financial advice, please still exercise your mind and consider carefully whether the product is suitable for you because you alone remain responsible for your trading – both gains and losses.

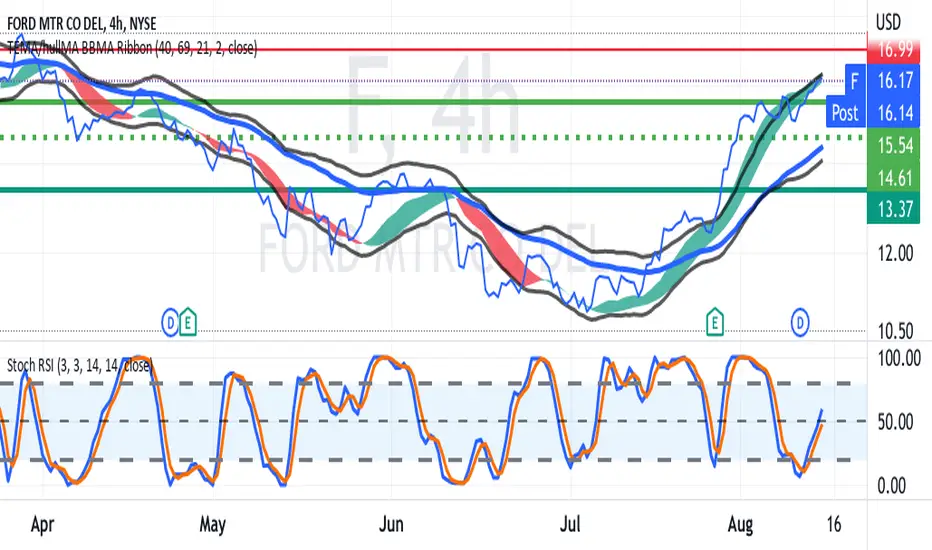
Ford AnalysisAn analysis for Ford (F)
Similar positions above similar downward trending channels
Just above the green dotted line which is the line that I would consider the bullish support


$F Analysis, Key Levels, and Targets$F Analysis, Key Levels, and Targets
200 Weekly MA… what do y’all think? Buy… or wish you bought 😬
I know... it's cheap, and that doesn't mean it cant get cheaper.... but I like this level... I'm buying on tuesday... 💃🏻
I smoke way too much weed on 3 day weekends...
—-
I am not your financial advisor. Watch my setups first before you jump in… My trade set ups work very well and they are for my personal reference and if you decide to trade them you do so at your own risk. I will gladly answer questions to the best of my knowledge but ultimately the risk is on you. I will update targets as needed.
GL and happy trading.
IF you need anything analyzed Technically just comment with the Ticker and I’ll do it as soon as possible…

LONG $F , SHORT $TSLAAlthough I am a huge fan of Tesla and believe they are way ahead of the competition, I think they are in for a pretty major correction. Best case $540, more realistically around $350 IMO. Especially if we head into a recession, which it looks like we might. In the meantime, I think Ford looks pretty cheap around here and will gain some significant market share.
-TSLA currently at 95 P/E ratio
-Ford at ~4.7 P/E

Ford - A good spot for a swing trade Long?Looking at the Ford weekly chart, share price has fallen hard since Jan. of this year with no relief pull-back. Well over 50% from the low in March 2020. Is it at a good level now for that pull-back to happen?
Notice a possible head and shoulder formation brewing in the works. Price is at the 200ema on the weekly and at the .618 fib level. The .618 fib level is at a point of support also. Stoch RSI has been under 20 since early Feb. Maybe a good time to pick up a few shares for the longer term investor. Or possibly a nice swing trade long.
It'll be interesting if price just destroys this zone or reacts to it.

Ford - Similar Indicator Situations Similar scenario right now to the area first in yellow
Price has dipped similarly to the 100MA
This touch on the 100MA on this Weekly timeframe will be bullish and lead to continuation above the major trend line
Major point is the initial and latter scenario are very similar
Bullish

Possible Head and Shoulders formingLots to look at these days. Be careful with your funds. Im no pro, do you research, make good decisions.
