EURUSD: Bearish Continuation
Our strategy, polished by years of trial and error has helped us identify what seems to be a great trading opportunity and we are here to share it with you as the time is ripe for us to sell EURUSD.
Disclosure: I am part of Trade Nation's Influencer program and receive a monthly fee for using their TradingView charts in my analysis.
❤️ Please, support our work with like & comment! ❤️
Forecast

XAUUSD/GOLD | 1H | SELL NOW Hello, everyone,
My gold target level is 3,190.0.
My friends, every single like from you is my biggest motivation to share my analysis.
Thank you very much to everyone who supports me with likes.

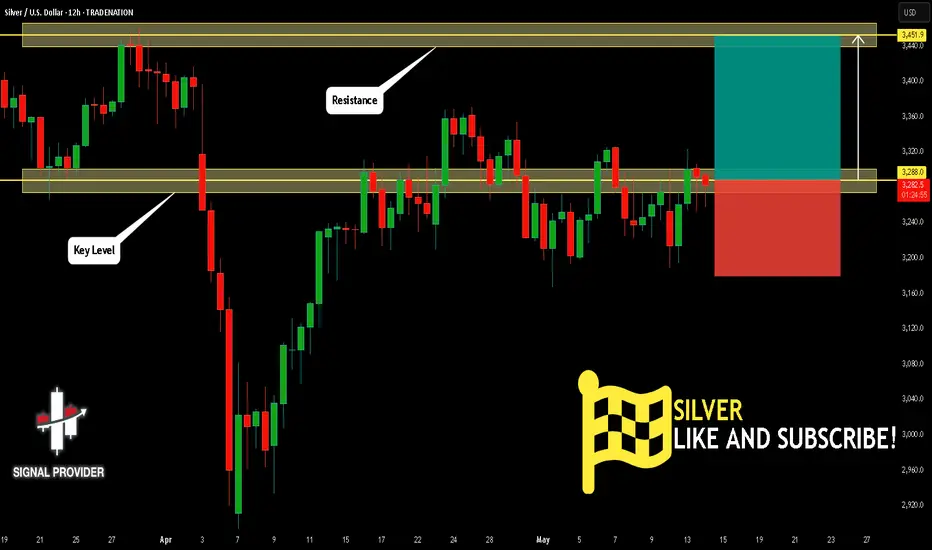
SILVER Is Going Up! Long!
Please, check our technical outlook for SILVER.
Time Frame: 12h
Current Trend: Bullish
Sentiment: Oversold (based on 7-period RSI)
Forecast: Bullish
The market is approaching a key horizontal level 3,288.0.
Considering the today's price action, probabilities will be high to see a movement to 3,451.9.
P.S
Please, note that an oversold/overbought condition can last for a long time, and therefore being oversold/overbought doesn't mean a price rally will come soon, or at all.
Disclosure: I am part of Trade Nation's Influencer program and receive a monthly fee for using their TradingView charts in my analysis.
Like and subscribe and comment my ideas if you enjoy them!
USDJPY Will Fall! Sell!
Please, check our technical outlook for USDJPY.
Time Frame: 9h
Current Trend: Bearish
Sentiment: Overbought (based on 7-period RSI)
Forecast: Bearish
The price is testing a key resistance 147.944.
Taking into consideration the current market trend & overbought RSI, chances will be high to see a bearish movement to the downside at least to 146.291 level.
P.S
The term oversold refers to a condition where an asset has traded lower in price and has the potential for a price bounce.
Overbought refers to market scenarios where the instrument is traded considerably higher than its fair value. Overvaluation is caused by market sentiments when there is positive news.
Disclosure: I am part of Trade Nation's Influencer program and receive a monthly fee for using their TradingView charts in my analysis.
Like and subscribe and comment my ideas if you enjoy them!

USOIL BEARS ARE GAINING STRENGTH|SHORT
USOIL SIGNAL
Trade Direction: short
Entry Level: 63.61
Target Level: 55.26
Stop Loss: 69.15
RISK PROFILE
Risk level: medium
Suggested risk: 1%
Timeframe: 1D
Disclosure: I am part of Trade Nation's Influencer program and receive a monthly fee for using their TradingView charts in my analysis.
✅LIKE AND COMMENT MY IDEAS✅

EUR/AUD BUYERS WILL DOMINATE THE MARKET|LONG
EUR/AUD SIGNAL
Trade Direction: long
Entry Level: 1.729
Target Level: 1.801
Stop Loss: 1.681
RISK PROFILE
Risk level: medium
Suggested risk: 1%
Timeframe: 1D
Disclosure: I am part of Trade Nation's Influencer program and receive a monthly fee for using their TradingView charts in my analysis.
✅LIKE AND COMMENT MY IDEAS✅

EUR/GBP BEST PLACE TO BUY FROM|LONG
Hello, Friends!
We are now examining the EUR/GBP pair and we can see that the pair is going down locally while also being in a downtrend on the 1W TF. But there is also a powerful signal from the BB lower band being nearby indicating that the pair is oversold so we can go long from the support line below and a target at 0.854 level.
Disclosure: I am part of Trade Nation's Influencer program and receive a monthly fee for using their TradingView charts in my analysis.
✅LIKE AND COMMENT MY IDEAS✅

USD/CHF BEARS WILL DOMINATE THE MARKET|SHORT
Hello, Friends!
It makes sense for us to go short on USD/CHF right now from the resistance line above with the target of 0.820 because of the confluence of the two strong factors which are the general downtrend on the previous 1W candle and the overbought situation on the lower TF determined by it’s proximity to the upper BB band.
Disclosure: I am part of Trade Nation's Influencer program and receive a monthly fee for using their TradingView charts in my analysis.
✅LIKE AND COMMENT MY IDEAS✅

GBPJPY: Bears Will Push Lower
The recent price action on the GBPJPY pair was keeping me on the fence, however, my bias is slowly but surely changing into the bearish one and I think we will see the price go down.
Disclosure: I am part of Trade Nation's Influencer program and receive a monthly fee for using their TradingView charts in my analysis.
❤️ Please, support our work with like & comment! ❤️

GBPNZD: Bullish Forecast & Outlook
The recent price action on the GBPNZDpair was keeping me on the fence, however, my bias is slowly but surely changing into the bullish one and I think we will see the price go up.
Disclosure: I am part of Trade Nation's Influencer program and receive a monthly fee for using their TradingView charts in my analysis.
❤️ Please, support our work with like & comment! ❤️

GOLD Will Go Up! Buy!
Here is our detailed technical review for GOLD.
Time Frame: 12h
Current Trend: Bullish
Sentiment: Oversold (based on 7-period RSI)
Forecast: Bullish
The market is trading around a solid horizontal structure 3,242.49.
The above observations make me that the market will inevitably achieve 3,415.14 level.
P.S
Please, note that an oversold/overbought condition can last for a long time, and therefore being oversold/overbought doesn't mean a price rally will come soon, or at all.
Disclosure: I am part of Trade Nation's Influencer program and receive a monthly fee for using their TradingView charts in my analysis.
Like and subscribe and comment my ideas if you enjoy them!

AUDUSD Will Move Lower! Sell!
Take a look at our analysis for AUDUSD.
Time Frame: 7h
Current Trend: Bearish
Sentiment: Overbought (based on 7-period RSI)
Forecast: Bearish
The market is testing a major horizontal structure 0.642.
Taking into consideration the structure & trend analysis, I believe that the market will reach 0.635 level soon.
P.S
The term oversold refers to a condition where an asset has traded lower in price and has the potential for a price bounce.
Overbought refers to market scenarios where the instrument is traded considerably higher than its fair value. Overvaluation is caused by market sentiments when there is positive news.
Disclosure: I am part of Trade Nation's Influencer program and receive a monthly fee for using their TradingView charts in my analysis.
Like and subscribe and comment my ideas if you enjoy them!

AUDCAD Is Very Bullish! Buy!
Here is our detailed technical review for AUDCAD.
Time Frame: 1D
Current Trend: Bullish
Sentiment: Oversold (based on 7-period RSI)
Forecast: Bullish
The market is approaching a significant support area 0.898.
The underlined horizontal cluster clearly indicates a highly probable bullish movement with target 0.913 level.
P.S
Overbought describes a period of time where there has been a significant and consistent upward move in price over a period of time without much pullback.
Disclosure: I am part of Trade Nation's Influencer program and receive a monthly fee for using their TradingView charts in my analysis.
Like and subscribe and comment my ideas if you enjoy them!

EURCHF Will Go Down From Resistance! Sell!
Take a look at our analysis for EURCHF.
Time Frame: 2h
Current Trend: Bearish
Sentiment: Overbought (based on 7-period RSI)
Forecast: Bearish
The market is testing a major horizontal structure 0.936.
Taking into consideration the structure & trend analysis, I believe that the market will reach 0.934 level soon.
P.S
Overbought describes a period of time where there has been a significant and consistent upward move in price over a period of time without much pullback.
Disclosure: I am part of Trade Nation's Influencer program and receive a monthly fee for using their TradingView charts in my analysis.
Like and subscribe and comment my ideas if you enjoy them!

USD/CAD SHORT FROM RESISTANCE
USD/CAD SIGNAL
Trade Direction: short
Entry Level: 1.398
Target Level: 1.366
Stop Loss: 1.420
RISK PROFILE
Risk level: medium
Suggested risk: 1%
Timeframe: 1D
Disclosure: I am part of Trade Nation's Influencer program and receive a monthly fee for using their TradingView charts in my analysis.
✅LIKE AND COMMENT MY IDEAS✅

AUD/USD BEARS WILL DOMINATE THE MARKET|SHORT
Hello, Friends!
It makes sense for us to go short on AUD/USD right now from the resistance line above with the target of 0.638 because of the confluence of the two strong factors which are the general downtrend on the previous 1W candle and the overbought situation on the lower TF determined by it’s proximity to the upper BB band.
Disclosure: I am part of Trade Nation's Influencer program and receive a monthly fee for using their TradingView charts in my analysis.
✅LIKE AND COMMENT MY IDEAS✅

NZD/USD SENDS CLEAR BEARISH SIGNALS|SHORT
Hello, Friends!
Bearish trend on NZD/USD, defined by the red colour of the last week candle combined with the fact the pair is overbought based on the BB upper band proximity, makes me expect a bearish rebound from the resistance line above and a retest of the local target below at 0.586.
Disclosure: I am part of Trade Nation's Influencer program and receive a monthly fee for using their TradingView charts in my analysis.
✅LIKE AND COMMENT MY IDEAS✅

NZD/CAD SHORT FROM RESISTANCE
Hello, Friends!
We are going short on the NZD/CAD with the target of 0.818 level, because the pair is overbought and will soon hit the resistance line above. We deduced the overbought condition from the price being near to the upper BB band. However, we should use low risk here because the 1W TF is green and gives us a counter-signal.
Disclosure: I am part of Trade Nation's Influencer program and receive a monthly fee for using their TradingView charts in my analysis.
✅LIKE AND COMMENT MY IDEAS✅

INR has made a major top against USDFall of INR against the USD began in early 1970s, or perhaps late 1960s--we don't know for sure for lack of trading data. Since then, it has depreciated against the USD in crystal-clear 5 legs, or waves according to Elliott Wave Theory (EWT). To validate EWT, there occurred a gigantic gap of 9.23% in July 1991 where third wave is supposed to be--a hallmark of third waves. Furthermore, there's even a divergence between Price and Elliott Wave Oscillator (5/35 MACD) on the Monthly chart--typical of fifth waves.
So, what's next then? Considering the time frame of the entire price move till date, I would say that a bear wave of Supercycle degree has just ended and we are looking at a 10-15 year advance in Indian Rupee against the US Dollar . In support of my forecast, INR has just posted a beautiful, unambiguous 5-wave advance in the shape of an expanding diagonal--hallmark of first waves--from 87.972 to 83.7625.
If I'm right, price should retreat a bit toward the classic 61.8% level at 86.3396, and then fall hard--and I mean very hard, with a gap--toward the levels below 80, followed by another pause and a small retreat, and another fall, thereby completing a set of 5 distinct waves . Should price follow the path of my forecast to that point, we would have a definite confirmation on hand that a Supercycle bear wave has indeed ended.
The final target of this Supercycle bull wave of INR vs. USD? It's too early and too far ahead to hazard a guess, but as per EWT principles, it should be somewhere close to 44. Yes. 1$ = ₹44. I hope I live to see that day. It's going to take a while, till 2040 perhaps, but we'll get there alright.

USOIL Is Going Down! Short!
Take a look at our analysis for USOIL.
Time Frame: 1D
Current Trend: Bearish
Sentiment: Overbought (based on 7-period RSI)
Forecast: Bearish
The market is on a crucial zone of supply 63.388.
The above-mentioned technicals clearly indicate the dominance of sellers on the market. I recommend shorting the instrument, aiming at 57.927 level.
P.S
Please, note that an oversold/overbought condition can last for a long time, and therefore being oversold/overbought doesn't mean a price rally will come soon, or at all.
Disclosure: I am part of Trade Nation's Influencer program and receive a monthly fee for using their TradingView charts in my analysis.
Like and subscribe and comment my ideas if you enjoy them!

EURUSD Will Go Down! Short!
Here is our detailed technical review for EURUSD.
Time Frame: 4h
Current Trend: Bearish
Sentiment: Overbought (based on 7-period RSI)
Forecast: Bearish
The market is approaching a significant resistance area 1.125.
Due to the fact that we see a positive bearish reaction from the underlined area, I strongly believe that sellers will manage to push the price all the way down to 1.114 level.
P.S
The term oversold refers to a condition where an asset has traded lower in price and has the potential for a price bounce.
Overbought refers to market scenarios where the instrument is traded considerably higher than its fair value. Overvaluation is caused by market sentiments when there is positive news.
Disclosure: I am part of Trade Nation's Influencer program and receive a monthly fee for using their TradingView charts in my analysis.
Like and subscribe and comment my ideas if you enjoy them!

EURCHF: Market of Sellers
The analysis of the EURCHF chart clearly shows us that the pair is finally about to tank due to the rising pressure from the sellers.
Disclosure: I am part of Trade Nation's Influencer program and receive a monthly fee for using their TradingView charts in my analysis.
❤️ Please, support our work with like & comment! ❤️

EURNZD: Bullish Continuation is Highly Probable! Here is Why:
It is essential that we apply multitimeframe technical analysis and there is no better example of why that is the case than the current EURNZD chart which, if analyzed properly, clearly points in the upward direction.
Disclosure: I am part of Trade Nation's Influencer program and receive a monthly fee for using their TradingView charts in my analysis.
❤️ Please, support our work with like & comment! ❤️
