"Thrill Rides is our DNA" - 7:1 Long on SIX What a rollercoaster of a stock since before the crash of of 2020 ... my charting of Six Flags is inspired by just now listening to a video about the company (not produced by me), and by my recollections of Magic Mountain from as early as the 1970s. Hopefully you will challenge my forecast and/or my measurements with your tough questions, since this venue is meant to arouse the reverse-engineers and to provoke the thinkers to do what we do best, right?
As always, I strive to render these ideas of mine so obviously that their explanation will require no words. Although my trading strategy is built on innate Pattern Recognition and a hard-won sympathy for the Market Maker’s Business Model, my tactics - including the beauty of Tradingview and how it makes me look good - are based on identifying the opportunities within VOLUME, VOLATILITY and TREND EXHAUSTION.
The details of the chart speak for themselves, however the fundamental narrative on which it is based is not all mine, only my initiative to look for a trade in it (see links below, for reference).
You will note that, as of this writing, the price has not fallen into my entry point, nor do I have conviction in the full harmonic potential. Even the heat map w/in the Range Analysis agrees with my medium term vision, which ends in an implied retracement.
Another 8:1 Long trade is also implied, should this forecast play out, however that will depend on fundamentals that will have evolved significantly by then ... which is to say that Six Flags may not survive a recession even with a decent turnaround strategy.
I am preparing a video on prospecting for opportunities during the current Sector Rotation, and Six Flags might become part of it. First, though, I have a few more ideas to upload as I update other key charts for the final Quarter of 2023, in preparation for live streaming.
Until then, be liquid !!!
. . .
NOTES:
"The Death of Six Flags Is Getting Ugly"
www.youtube.com
After reporting their Q2 Six Flags 2023 earnings report, Six Flags stockholders have been shell shocked and the future of Six Flags looks dim. What will become of all the best roller coasters in the world that the Six Flags parks have assembled? Will 6 Flags survive or will the Six Flags 2023 season be one of their last?
Forecastingtechniques

XRP Bull Breaker - Alternate View By Popular Request (5:1 Short)My most popular idea by far, with over 70 comments in half as many hours, is this one, which I've revised in order to show the Trend Exhaustion details w/in the AVWAP Array on the 1D chart. Again, if you are a long term Bull, you won’t like it, and yet since I operate by the Steel Man principle, I welcome your toughest questions and chart-based counter-arguments.
As I always, I strive to render my ideas so that I need no words to explain them, although I can (and do) write detailed paragraphs (elsewhere).
Anyways, in the medium term, I expect price to fall to the $0.3785 shown here, which also marks the Point-of-Control from the last major swing low. Price Action already tested the positive 3rd Standard Deviation of the AVWAP from the same reference point, as shown, and will, by degrees, retest the negative 2nd Standard deviation below (+/- $0.22 USD as of this writing).
The stop loss shown here is discretionary and conservative, and should be revised for current conditions if you are considering a short trade. Closer study on lower timeframes may reveal a better entry or stop loss as the chart unfolds over time.
Hopefully this version clarifies a few details for the confused.
In practice, the Trend Exhaustion Wedge reveals stop loss and profit targets for day traders on the lowest time frames (minutes, even seconds), which are, by nature, moving targets on any given day. The AWVAP Array, on the other hand, is dynamic, and prints according to the timeframe, unlike the trend lines.
I intend to start live-streaming soon, so feel free to ask questions if you have any. Critical thinkers only ... XRP-Trolls need not apply.
Until then, be liquid!

XRP Bull Breaker - 7.77:1 Short + Longterm ForecastI just finished a complete overhaul of my XRPUSD chart, a portion of which is on display here in order to publish my medium and long range forecasts for this most “distributive” of digital assets. If you are a long term Bull, you won’t like it, and yet since I operate by the Steel Man principle, I welcome your toughest questions and chart-based counter-arguments.
As I always, I strive to render my ideas so that I need no words to explain them, although I can (and do) write detailed paragraphs (elsewhere).
Anyways, in the short term, I expect price to fall below the $0.3785 shown here (purely for the 7.77 R-Value) down to ~ $0.34, then to ~ $0.28 in the medium term and finally to ~ $0.22 at or near the next BTC Halving event.
From there your eye leads up to the Trend Exhaustion Limit and retraces until the end of 2025. Three years later, if my forecast is correct, there will be a final speculative peak, after which price should level off to some stable range of intrinsic value of ~ $5.89 throughout the next decade.
Obviously, this chart is not tradable, per se, and serves instead as an an introduction and reference point for lower timeframe ideas and videos I intend to publish. The complete chart has many granular details for targeting stop losses, and new details will be constantly updated (and erased) as price action unfolds.
Until then, be liquid!

Enjoy my Bitcoin Chart & its Bearish ForecastThose who know my work will recognize that my chart has taken this essential form for over 18 months, with only minor refinements. Hopefully you will challenge my forecast with your tough questions and counter-arguments. After all, this venue exists to arouse the reverse-engineers and to provoke the thinkers to do what we do best, right?
As always, I strive to render these ideas of mine so obviously that their explanation will require no words, and this forecast is no exception.
My trading tactics - including the beauty of Tradingview and how it makes me look good - are based on identifying the opportunities within VOLUME, VOLATILITY and TREND EXHAUSTION.
There are too many details here to discuss, which I will save for future, more detailed posts. For now, you may concentrate on the downside targets and how the price action interacts with the implied forecast as we move forward through time.
On a practical level, this chart is meant to be traded on the 15 minute chart and below, all the way down to 1 second. Whereas the big picture imparts a sense of directional bias, the hyper-granularity of the many intersecting color-coded diagonals reveals precise targets on the lowest time frames suitable for daily scalping in the futures markets.
Speaking of the future, until then, be liquid !!!

How We Use The Forecast Model PatternsThe current position of all patterns (with the exception of the Cumulus Triangles) are not set in stone. The patterns can extend across many different price and time ranges at any given point in time. The current positions are default locations determined by analyzing the historical average position were each pattern occurred across all cycles. We currently have every pattern in this default position to help us gauge where the Bitcoin price most likely will be in the future, and to compare historical price behavior to the current situation.
Thanks for watching!

🔍 Understanding the Volatility Crush: Navigating ETH Recent PA
Hello, traders! In the ever-evolving world of cryptocurrency, we often encounter intriguing phenomena like the "volatility crush." 📊
🔍 What is a Volatility Crush? A volatility crush occurs when the price of an asset, in this case, Ethereum (ETH), experiences a significant reduction in its price volatility. It's like the storm clouds clearing after a turbulent period, leading to calmer, less erratic price movements.
💡 Recent ETH Price Action: Indeed, as you've observed, ETH exhibited rapid price movements at the end of last month. However, at the start of this month, there's been a noticeable decrease in trading volume and price volatility. This suggests a potential volatility crush in progress.
🌪️ Adaptability in Wild Times: So, how can traders adapt during such times of reduced volatility?
Diversification: Consider diversifying your portfolio beyond ETH. Explore other cryptocurrencies or assets to spread risk.
Risk Management: Tighten your risk management strategies. Lower leverage and set stop-loss orders to protect your capital.
Stay Informed: Keep a close eye on news and developments. Crypto markets are sensitive to external factors, and unexpected news can spark volatility.
Patience: Be patient. Reduced volatility doesn't mean inaction. It might be a good time to reassess your long-term goals and strategies.
Education: Continuously educate yourself about market dynamics. Understanding the underlying technology and market sentiment can guide your decisions.
Remember, adaptability is the name of the game in the crypto world. The ability to shift your strategies as market conditions change can help you not only survive but thrive in wild times.
Stay vigilant and trade wisely! 🚀📉
#CryptoInsights #VolatilityCrush #Adaptability #ETHPriceAction

The FOMO Funnel! 🌪 Forecast Model Churns Out Another Pattern!In times of extreme FOMO the Bitcoin Market can be an emotionally challenging place. The Crypto Weather Channel's Forecast Model (The Jet stream) spins out yet another price pattern in the Bitcoin chart to help us navigate these times. Also, a few additional price targets will be established as we approach this moment. No one but The Crypto Weather Channel is planning this far ahead in the future! Thanks for watching.

DJI next swing?hi..
this is weekly chart, so i forecast next week there will be a swing for DJI, hopefully reversal..
PS: +/-1 bar is still valid

BTC/USD short selling opportunityAll through its an downward trend for short selling go short for half an hour and see the magic.

Nifty Wave Count Update and Price ProjectionHello friends,
After C truncation - impulse started and yesterday we got 1 more confirmation of channel breaking.
Here I am posting approximate target of all impulse waves - it is not definite it is approximate
spot nifty
entry
18049
stop loss
17870
exit value
180404.85
Wave 1 = 10 hourly candles
from 17761 to 18049
Wave 2 = 6.2 candles
17870
wave 3 = 16 candles
18627.88
wave 4 = 6 candles
18116.85
wave 5 = 10 candles
18404.85
This is an estimate - subject to change

Time and Price Pivots - XRPHello traders, this chart is an exercise observing the relationship between time and price. Specifically, we are observing how past price behavior may forecast future highs and lows.
For this example I've picked XRP/USDT on MEXC since that is what I use to trade currently but this can be done on any instrument/chart and repeating this on the exchanges should yield similar results.
First let me break-down how this is constructed. If the information seems vague - I'd be happy to do a tutorial once I have enough TradingView reputation to post pictures for a tutorial to do a true break-down.
Anyway, we first start by:
Drawing a horizontal line on the range low and high.
We then draw a trendline from the low to the high and observe the angle of the line.
Regarding angles and chart scaling:
It is important to note that this process should be done with either a locked chart scale or extreme restrain of scaling time and price bars. The above example was done on a logarithmic chart. I have not tested yet to see if the results are really any difference from a locked chart. However, the important thing to grasp is that the angles are all relative to your current scale. So when you are squaring the range , as I will mention shortly, the 90 degree angle you form is relative to your current scale and if changed will be relative to that one, and so on and so forth. There is a slightly degree of inaccuracy, but I think that mostly has to do with how TradingView tools seem to "snap" regardless of magnet settings.
Continuing on:
We square the high and low of the range by forming a 90 degree angle from the trendline on the high and low.
We then find the 1/2 angle (45 degrees) and draw these as a trend line for the high and the low
Continue to divide the space between the angles this from both the high and low. A Gann fan with the 1/2 point aligned with the 45 degree line can be sufficient.
Take note of a few things:
Where angles intersect the high and low of the range.
Where angles intersect each other.
Observe what happened at these moments in time. You will notice a pattern of highs and lows forming at these moments in time. The angles provide dynamic support and resistance, whilst the intersection provide us a time when the market pivots. This can be done on any timeframe.
Now, some could argue, "If I divide my chart up a million times, then of course I'll hit highs and lows."
Yes, but I didn't. In fact we only have 20 angles or so on this chart where we can derive with accuracy these pivot points. Almost all intersections are at a high or low. I would also add that these points don't mean something HAS to happen , but these should be areas of interest where it is HIGHER probability for market to shift.
Using this data we can essentially forecast potential points time where we could expect shifts in the market - a new high or low. I have March of 2023 marked as a potential area of interest next year as we have two of our major lines intersecting then.


AUDJPY - FUNDAMENTAL + TECHNICAL BIAS#AUDJPY
Due to MARKET RISK being on in the previous days, AUDJPY is slightly UP. But even now we see that the MARKET is somewhat MARKET RISK ON. We expect AUDJPY to RETRACE to higher resistance.
Anyway, if AUDJPY goes DOWNSIDE again, VIX should go up, JPY should go up, and STOCKS should go down. The dollar should continue to strengthen in this way. If MARKET RISK is ON, you can definitely BUY at 96.21 LEVEL. Currently, MARKET RISK is ON. But somehow it may go down to 89.74 LEVEL before going UP. After that, AUDJPY may go up to 96.31 LEVEL.
To buy AUDJPY, VIX must be DOWN and SNP500 must be UP. Further, the TREND LINE should be BREAK. And COMMODITIES should definitely be UP. We are waiting for the change in the above mentioned MARKETS.
If the dollar is strengthened by the FED, MARKETS RISK should be off. Then after JPY STRONG, AUDJPY can be LONG TERM BUY.

USDJPY - CURRENT SENTIMENT , FUNDAMENTAL BIAS#USDJPY
- USDJPY is currently BUYing. The reason for that is that with US ECONOMIC DATA being POSITIVE, UJ was BUY very well until last week. And FED UPDATES were very POSITIVE. Another major reason was that the dollar continued to strengthen on Friday's LABOR DATA. So JPY went down automatically in previous days. But with the intervention of the BANK OF JAPAN, there is now a very good demand for YEN in the market.
- At the moment, the MARKET is taking a bit of RISK OFF, that's why the JPY is going up. According to the USDJPY ANALYSIS we provided earlier, the USDJPY UPSIDE WAVE is currently UP around 120 ++ PIPS.
- There is definitely a high chance that USDJPY will go down a bit more and move to 143.536 LEVEL. The reason for that is because the MARKETS RISK OFF is already happening, so it can happen. After that USDJPY price can go up to 148.194 LEVEL. We focus on MARKET UPDATES and MARKET SENTIMENT. Follow the given MARKET STRUCTURE.

Gold analysis and signal🧐No comment!
Everything is visible in the chart!
✅ ✅ Risk warning, disclaimer: the above is a personal market judgment and analysis based on published information and historical chart data on The trading view,
And only some of these analyzes are my actual real trades.
I hope Traders consider I am Not responsible for your trades and investment decision.
------------------------------
✅ Please write any advice or suggestions.
Dear friends, request any cryptocurrency pair, currencies pair for forex, and any index that you want to be analyzed, and ask any questions about chart analysis.
Thanks for your attention

CADJPY : Current Situation & Technical , Fundamental View#CADJPY
- At this point, CADJPY is selling very well due to the current MARKET SENTIMENT. So CAD automatically went down. Also, unexpectedly, a JPY STRONG came in the last few days. This was because the Bank of Japan intervened to strengthen the JPY.
- But after that the price of OIL went down very fast. Due to this reason CAD was sold very fast before. You can check it by going to CAD CHARTS.
But now with JPY WEAKNESS, CADJPY is selling very fast.
- Currently, the MARKET is slightly RISK OFF, JPY is going UP, therefore, CADJPY is being SELL.
- Definitely CADJPY should be slightly DOWN until 102.91 LEVEL. After that, the possibility of moving to 110.06 LEVEL is very high. The reason for that is because even now OIL PRICES are going up a bit.

SBIN can be open Bullish as per Pure Price Action SBIN Forecasting for Friday morning- as per price action tomorrow morning market can be open in bullish side, stock making ascending triangle and SBIN made bullish continuation candle on one day candlestick pattern

NG Backwardation PlayClassic backwardation scenario, a textbook move. Major supply disruptions at Prelude floating liquefied natural gas (FLNG) facility in Australia, Nord stream at 20% flow, and a lag between demand and LNG deliveries to Europe will likely drive prices higher, but we are betting on what we know, the difference between spot and the August contract. We can expect the future price, to converge towards the spot price, making this position a long.

ABANDON SHIP! *Says the blind mind* - How to trade the bottomTL;DR - While the 28-32k resistance area was a very high probability reversal zone to form another lower range boundary for our big pappa Bitcoin (a range built between 65k and 30k), extreme market volatility has pushed prices much lower. Because of this extreme volatility and major bearish market sentiment you CAN NOT try to catch a falling knife and instead should wait for a retrace-off key resistance to enter give the wider bearish structure. Even though there is an extremely high probability this is the bottom, everyone and their grandma was saying that at 30k. Risk management and appropriate trading is the only thing that will keep you in the game for the long run despite how amazing a trading opportunity might be.
----
Wow what a huge amount of panic there has been. Just half a year ago people were calling for 100k Bitcoin and now the whole world has collapsed. Risk management was the only thing that stopped players from getting liquidated and holy hell has this been a liquidation event.
I am going to keep this post short:
My previous series of analysis pointed to the fact that bitcoin was building a large range between 65k (upper range boundary) and 30k (lower range boundary). As we were on the 28-32k support and at the lower edges of the range, this was a high probability area for bitcoin to reverse and make another attempt at the all time highs. Probability of this was heavily tainted towards a bullish breakout of the range as the previous trend (before reaching 65k in early 2020), had been bullish. But sometimes in trading, even if probability is in your favour that 10/20% thing can still happen and in this case... it did.
Given this we must start afresh with our analysis and start to find a new range low. The context for this is clear and the chart above shows this - On the higher timeframes (weekly and monthly) Bitcoin broke out of its range built between 2017-2020, trended to 65k in an epic bull run and is now forming an even bigger range to digest prices. We have built an upper range boundary at 65k and we are now searching for a new lower range boundary. As mentioned above, the probability is tainted bullish as price action since Bitcoins birth has consistently trended bullish, then ranged. This is not opinion this is technical analysis fact and so with probability in our favour we look for this trend to continue.
Within this higher timeframe range (daily/weekly) we have formed a bearish trend (4H/daily) that has pushed price down from 65k area to the 17k low. Here is where we start looking for certain price action that increases the probability that this bearish trend has ended and we are instead building a bottom. The process of finding this bottom / lower range boundary is done by first neutralising all the bearish pressure / sentiment. Markets never (or very very rarely) go from one extreme thought (trending bullish or bearish) to the other. Much like within life, they cycle through phases with a neutral point in between their ebs and flow (or oscilations). In this case, we have been trending bearish and so it is very likely that we will range or at least retrace heavily at these lower levels in order to build a bottom. As you may have heard, bottoming is a process not a single event - I know it sounds bad because its human nature to find the best prices but in reality waiting for the later stages of this bottoming process offers a significantly better risk/reward as you have evidence that price will not collapse and so your money is safer. Just like at 30k when everyone was calling this "the bottom", markets can go crazy and so waiting is always the best option even if you don't get the best prices.
The chart above (and the first one in this post) shows you what the bottoming process is likely to look like. It is not a certainty and with the lower risk comes the low probability that price just keeps chugging upwards. But to create a bottom it is very often that a retrace occurs after the first bullish price action starts following the bearish trend. In this case the 28-32k resistance area is the most likely candidate for that resistance to show up and push prices down somewhat for a better entry. Don't get me wrong, bullishness can go further but at some point there will be a retrace. We get two important bits of information for waiting for this retrace (and believe me, every professional trader will be waiting for this information as well):
1: Using Fibonachi levels we can find high probability reversal areas that allow us to watch for appropriate signals (with buying happening either at the 50%/61%/78% fib levels)
2: These high probability areas tell us the strength of the bullish price action - if we only retrace 50% of the bullish move from the bottom as opposed to 78% then that shows us that buyers are buying heavily and are in control. This gives a higher probability of further bullishness. With this information we can gauge where to take profits - a weak bounce off 78% fib will mean lower profit targets and a potential break of the 20k area towards 11k, where as a strong bounce off 50% will mean no profit taking until the 50k area.
That is it. It is that simple. The complexity in trading comes with controlling your emotional bias. How many people (including massive firms like 3AC) were unable to control their emotional involvement in the market and so went too big too quickly. Unlike them, you must trade in a cold hard calculative way, ignoring greed, fear and uncertainty and instead patiently waiting for favourable opportunities to emerge where probability is in your favour. Buying now is not favourable as, even though the bottom is in, we just don't KNOW that it is and so we must wait for a more appropriate entry where we can gauge risk. If you do that 100 times over your life you will be a millionaire, but if you mess up once you can lose everything. That is the game we play.
P.

GBPJPY ForecastMore selling Expected. Trade Carefully. Trade in Harmony with the trend, do not go against the flow of the trend.

BITCOIN and the 800 EMA- What You should know!Padawans,
Bitcoin has been reacting to the 800 Ema since the 24th of January 2022. Most people like to use the 50, 100, 200 day MA`s or EMA`s. However I like to use the 800 day EMA.
On the 9th of April 2024, Bitcoin broke the trendline formed on February 24th, it retested that trendline Yesterday on the 10th of April and was rejected. However what I want you to take note of something:
If we take a look at the chart we will notice on the 24th of January we had a test of the 800 EMA followed by the evaporation of selling pressure followed by a move to the upside resulting in a green candle
On the 24th of February again there was move downwards towards the 800 day EMA, followed by the evaporation of selling pressure followed by a move to the upside resulting in a green candle and a new trendline being formed
Take note that with each of the above mentioned events we are forming Higher Highs
So what Am I Looking For
First a test a retrace to $38735, which is 0.236 of the Fibs and also a convergence at that point with the downward trendline
Then I am looking for a wick to make a move downwards towards the 800 ema and if the same confluence of events happen as happened on the 24th of January and 24th of February
then, in my mind you will have confirmation of the resumption of an uptrend and is this happens
Padawan- Hand me my Lightsaber

Total Crypto Market Capitalization This is a projection with the current metrics that the graph is inputting in this particular time/space

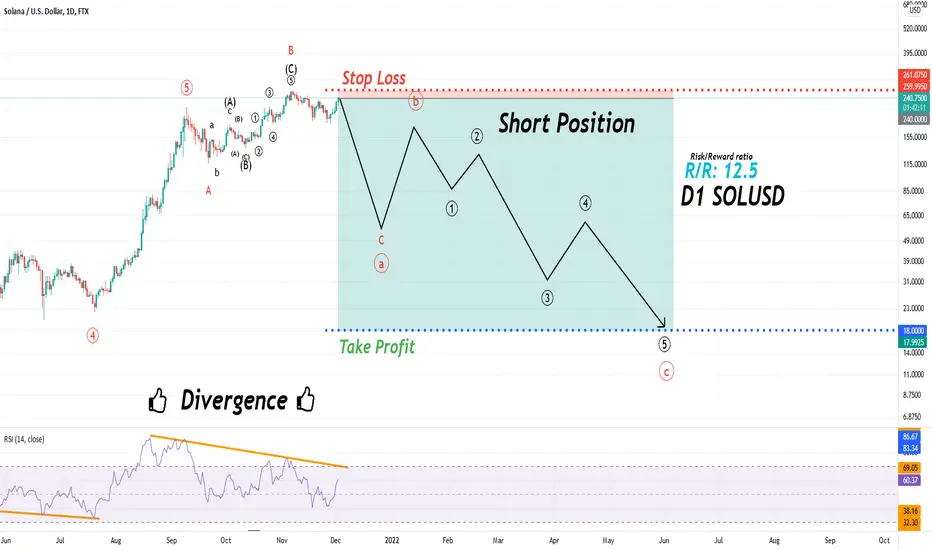
SOLUSD Trend and Wave analysis (Wave Elliot + Divergence) Big drop in prices on cryptocurrencies.
It is in the C wave and initially the price fall with the Elliott wave. In this analysis, it seems that the price will move down. The Stop loss and Take profit are marked on the price chart.
The price trend is down and there is a divergence in the charts. In many cryptocurrencies, the price growth seems to be over.
The wave you see in the future price on the chart is a schematic of a possible price trend and will not be formed just to clarify the possible price movement.
This is a personal analysis and should not be considered a criterion for buying or selling. Please pay attention to the Take profit and Stop loss. Cryptos show emotional and unforeseen price behavior.
I use Elliott and Price Action in my analysis, and my analysis is based on that. The structure of the Elliott wave count is complex and different patterns are formed in the chart, so there is a possibility of a change in the price movement of the price.