NeutralUSD/JPY is in a flat correction where it has completed the leg A and B, now to finish the remaining C leg, it has to come down in 5 waves but after then it will either reverse to the downside or continue the bullish trend to the upside
Forex-currency

AUDUSD Holding .70000I bought the AUDUSD right around .70000. It held the support really well. If it closes below, I will think differently. However, going into the weekend I will close the position and see how it plays out next week. Pullbacks are expected, but so far so good. All the best!

NZDJPY sell (4hr) (wait for breakout below support zone)NZDJPY sell (4hr) (wait for breakout below support zone)

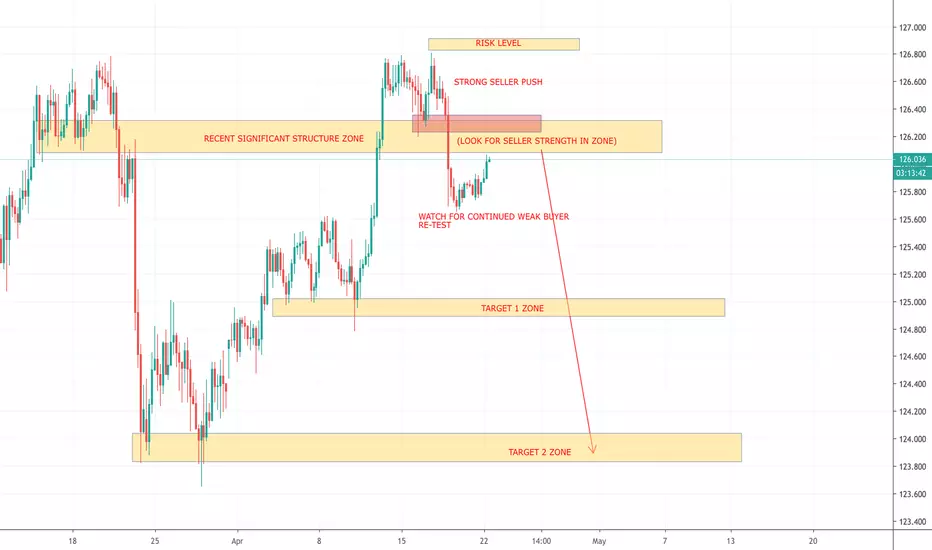
EURJPY POTENTIAL SHORT OPPORTUNITY EURJPY POTENTIAL SHORT
IF YOU LOOK AT THIS CURRENCY PAIR YOU CAN SEE THAT ON THE LEFT HAND SIDE OF THE 4H CHART THE DATA IS DISPLAYING VERY STRONG SELLER MOMENTUM OCCURRING. WHEN YOU APPLY THAT TO RECENT DATA MOVEMENT YOU CAN SEE THAT THERE WAS A STRONG SELLER PUSH TO THE DOWNSIDE LAST WEEK ON THE 4H CHART AS WELL AS A BREAK OF RECENT STRUCTURE. THIS IS SHOWING THAT THERE IS A HIGHER PROBABLE CHANCE OF THE MARKET CONTINUING TO THE DOWNSIDE. KEEP AN EYE ON THE MOMENTUM OF THIS RE-TEST INTO STRUCTURE. THE RE-TEST WILL GIVE A 75-80% BETTER DISPLAY OF WHAT THE NEXT PROBABLE MOVE COULD BE. MAKE SURE IT CONTINUES TO BE WEAKER THAN THE DROP FROM LAST WEEK. LETS BREAK IT DOWN
1D CHART:
*STRONG SELLER MOMENTUM AS WELL AS BEARISH ENGULFING CLOSE ON THIS TIMEFRAME CHART
4H CHART:
*ON THIS TIMEFRAME WE SAW A STRONG SELLER REACTION IN RECENT SIGNIFICANT STRUCTURE
*STRONG PUSH AS WELL AS OBSTRUCTION OF STRUCTURE ON THE 4H TIMEFRAME CREATING A LOWER LOW
1H CHART:
*ON THIS TIMEFRAME YOU CAN UTILIZE THE DATA TO BE ABLE TO GET A BETTER IDEA OF MOMENTUM COMING INTO PLAY BEFORE THE LARGER MOVE HAPPENS
*WATCH THIS TIMEFRAME FOR ACCURACY OF ENTRY AS WELL AS RISK/REWARD RATION COMPARISON
PLEASE LIKE AND FOLLOW MY PAGE FOR MORE PROFITABLE SETUPS! CHEERS!
CADJPY THE BULLS HAVE BROKEN OUT! - UPSIDE MOMENTUM.Weekly Timeframe - Very Bullish Closure
Daily Timeframe - Break out of an Inside bar/Mother candle formation & counter trend line break
First Target 70 pips away, Im looking for a swing high. Could we see 85.00? then 86.00? I think so.

EURCHF ShortIf price fails to break current resistance, judging from price exhaustion from the TDI and our current zone. I'll be looking for sell confirmations to go short.


GBPAUD long?THis is my long idea for the gbpaud
Here we see on the chart that there a bullish cypher pattern that was printed, followed with the osc being over sold.
Probabilities on these setups are usually high.
This is an idea only and not intended for a signal
Cheers

EURUSD: Is this the long term chart we should focus on?EURUSD has been practically trading sideways since November 2018, with however relative bearish bias since 1W is on Lower Highs (RSI = -40.078, MACD = -0.008, Highs/Lows = -0.0063, B/BP = -0.0113).
Our attention is currently expanding on the larger 1M time-frame where the bearish long term sentiment is clearer. STOCH, STOCHRSI, Williams are all oversold, and as seen on the chart the price is currently near a Lower Low and has in fact been trading on the lower band (below median) of the Channel Down. The oversold stochastic state comes as no surprise then.
Despite the fact that 1D is a Channel Down (RSI = 38.591, Highs/Lows = -0.0053) we should start shifting our focus towards buying again and although 1W/ 1D still have potential for a Lower Low at 1.1130, we will be targeting 1.1300 and 1.1380 in extension.
We shouldn't overlook also the probability of a break-out above the median (but still within the Channel Down), as the pair has been trading so long below it. Don't ignore the fact that the price action for the past couple of months or so, is a balance of power (supply intervention) between the two central banks (the ECB and the Federal Reserve). This is what has been causing the Lower Highs and Lower Lows inside the technical bearish channel. If that channel breaks downwards then we are looking very realistically at a 1M Gap Fill to the January 2017 1.0342 Bottom.
See below our previous studies on selling and buying the Highs and Lows of the current Channel Down:
** If you like our free content follow our profile (www.tradingview.com) to get more daily ideas. **
Comments and likes are greatly appreciated.

eurcad long incoming?this is my long idea,
you notice a bullish cypher printed on the chart, following with some double osc over sold action.
these setups are usually pretty potent.
This is purely and simply an idea, not intended to be a signal.
Trade at your own risk!
Cheers!

CADJPY LONG IDEAThis is an idea for my long position on cadjpy.
Not intended to be a signal.
Trade at your own risk.


GBPNZD: Buy opportunity on 1D.The pair is trading within a 1D Channel Up (RSI = 52.233, MACD = 0.004, Highs/Lows = 0.0000). The candle sequence is repetitive inside the pattern and that allows us to make the estimate that the price will rebound on that (inner) Higher Low (maybe a near double bottom) towards a new Higher High. TP1 = 1.9600, TP2 = 1.9800.
** If you like our free content follow our profile (www.tradingview.com) to get more daily ideas. **
Comments and likes are greatly appreciated.

USDSGD: Bearish sequence on 1D.The pair is trading on a 1W Channel Down (RSI = 42.533, Highs/Lows = -0.0041, B/BP = -0.0178, MACD = -0.002) which is close to pricing a top based on a recurring bearish pattern inside the channel. A new Lower Low should follow so we are going short, TP = 1.3400.
** If you like our free content follow our profile (www.tradingview.com) to get more daily ideas. **
Comments and likes are greatly appreciated.

GBPUSD POTENTIAL LONG (HIGHER TIMEFRAME VISION) GBPUSD FUTURE UPSIDE POTENTIAL
WHEN TAKING A LOOK AT GBPUSD ON THE DAILY AND WEEKLY TIMEFRAME, BASED ON THE MOMENTUM THE MARKET IS SHOWING ME I CANT HELP BUT THINK OF THIS MAKING A MOVE TO THE UPSIDE. THE MARKET IS SITTING AT WEEKLY CYCLE LOWS AS WELL AS A LOW POINT IN THE MARKET. ITS BEEN HAVING LARGER RESTS BY THE BUYERS AND SELLER ALLOWING FOR LARGER RESTS TO THE UPSIDE. RECENT MOVEMENT ON THE 4H AS WELL AS DAILY TIMEFRAME ARE SHOWING HEALTHY BUYER MOMENTUM. KEEP YOUR EYES OUT ON THIS PAIR AND FOR POTENTIAL MOVEMENT TO UPSIDE. WILL BE A LONG PERIOD OF TIME BEFORE POTENTIALLY HITTING TARGET ZONE MARKED ON THE CHART.
CHEERS! PLEASE LIKE AND FOLLOW MY PAGE FOR MORE PROFITABLE ANALYSIS

British Pound (GBP/USD), Daily Chart Analysis Feb 27Technical Analysis and Outlook
The British Pound has established its path towards extended Currency Rally marked at 1.3480 following completion of the Inner Currency Rally $1.3333 . On the downside, we have developed a new strategic Key Sup $1.3040 (For more Market Commentary, please visit the TradingSig_dot_com).

British Pound (GBP/USD), Daily Chart Analysis Feb 8Technical Analysis and Outlook
The Sterling has completed Currency Dip 1.2878 , therefore, expect a solid rebound to Mean Res 1.3064 and /or 1.3112 , while on the downside we have established Mean Sup 1.2715 . (For more Market Commentary, please visit the TradingSig_dot_com).

Possible long opportunity on - EURUSD Have been rolling down for about 180 pips. Aiming to retrace at least 50% taking support on trend line.
Entry now or with confirmations.

FXA Australian Dollar Index Trade Idea to $75FXA (Australian Dollar Index) appears undervalued and due for a rise towards $75. A pair idea is AUDUSD buy.

UUP - US Dollar Index Trade Ideas to $25.00Sell target on the Invesco CurrencyShares US Dollar Index is $25.00. A trade idea is buy AUDUSD.

British Pound (GBP/USD), Daily Chart Analysis Jan 18Technical Analysis and Outlook
Sterling performed superbly by coming-off of Mean Resistance 1.2876 to fulfill Mean Support 1.2714 trading range for healthy 162 pips down and up in the same session.
On the upside, we have current Key Resistance 1.2990 as a significant roadblock; however, while next Currency Rally 1.3026 is resting comfortably above. (For more Market Commentary, please visit the TradingSig_dot_com).

NZDJPYVery nice respect of the trend zone. Testing the 200 EMA and if we see a nice push upwards the 8 EMA will cross the 18 MA. Also testing major support.
I'm long for now, already entered.

NZD/USD - SHORT (1/6/2019)NZD/USD
looking to enter short at the (12h) breaker
targeting the fresh demand zone below (grey box)
conservative stop posted in case it goes for the liquidity resting above
