Forex-currency

EURUSD Trading Guide for Next Week!The next resistante level is @ 1.21500 . Those levels date back from the fall in 2015 and 2012.
The Green Ascending Trendline from the wedge is a must hit retest. Afterwards, two scenarios are drawable:
a) BLUE - Climb either to this week's high, or to the 1.21500 levels (wither with retest of the channel line, or straigh breakout). Note how low the RSI levels are... Gives a bullmarket a lot of strength and breathing room.
b) RED - Pullback parallel channel line, and a continuation down to a support line which will coincide with a prallel of the top trendline thus forming a channel.
b) We fall into the channel, retest it, and pullback to a support level that will coincide with the channel's bottom trendline. We'd like to see Price Action fall under the Mov Avg, retest it and then go back down FX:EURUSD before shorting.
Note, this channel is worth what it's worth. market has yet to come close to it as the only real pattern we have was the Wedge it broke out of. Although, experience hints that the channel will exist in the future and sets for a great TP.
THE BIG QUESTION:
Are we going to push to 2015 resistance levels, and weaken the Dollar even more? Or are we going to come back down into the 1.18 area...
Good luck! Discipline needed to execute these setups.

EURGBP - Longs again.Hello guys!
After our last successful trade on EURGBP It's looking again for longs. We will be looking for break above the consolidation pattern, to pull the trigger.
- Please use this analyse only to support yours! Use correct MM and Strategy!


Sell EURJPY breakout Retest happened on lower time frames.
Monthly sitting on 0.618
Trend lines broken
Short to the downside to the next point

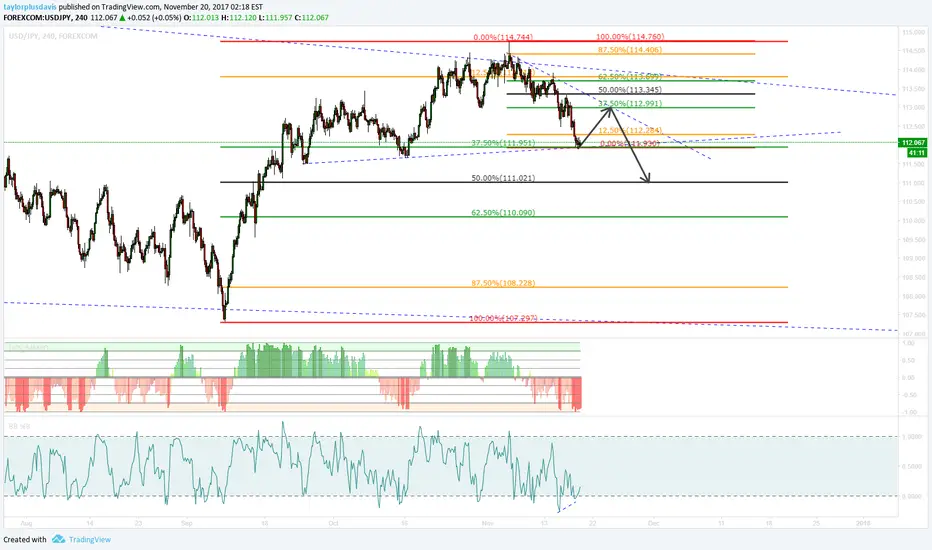
Long at Support LevelLooking for long opportunity at 112.96. If PA break below the 200ema, this analysis is invalid.
Reward to risk is 3: 1

Double bottom - Looking to long AUDCHFIf retest at 0.7459 and did not break below the low I will look to long. Tight stop loss as it is counter trend so if PA break means the analysis is invalid. Reward to risk is 5.5 : 1

USDJPY SHORT H&S*Idea
Rejection of previous trading range and headed to the base structure trading range
Waiting for retest at 200ema to long GBPCHFWaiting for retest and if did not break I will look for opportunity to long
Reward to risk is 6 : 1

Looking To Long EURUSD At PullbackDaily TF still uptrend and H4 now closed above 200ema. Looking to long at pullback at 200ema.
If break below the 200ema, the analysis is invalid.
Reward to risk is 3.5 : 1

Looking to short NZDUSD at Fibonacci Retracement 61.8Powell as the next Fed Chair seem to result is some pullback in the market. However, my sentiment is that dollar will appreciate in the long-term under his lead as there will still be gradual rate hike and reduction in balance sheet. U.S. economy is starting to pick up also. Nevertheless, today there is NFP data release which will show whether the employment in U.S continuous to improvement.
Looking to short if price did not break and close above 200ema and 61.8.
Reward to risk for this analysis is 8:1

Ascending Triangle NZD/JPY 1H Long. Ascending Triangle pattern on 1H Chart. NZD/USD and USD/JPY both in immediate term uptrends on their 1H timeframes as well which should provide minimal pressure from bears to hinder NZD/JPY from going higher should the pattern provide a buy signal with a break above most recent highs. Measured move for profit target comes in very cleanly at next resistance level.


GBPCHF - Possible LongIt was noted that CHF could be losing strength against the GBP.
We have added Divergence as confirmation increasing the probability of this setup.
R:R, 1:1.2
Good Luck :-)

GBPUSD - Possible Long FormingIt was noted that GBP could be gaining some short term strength against the USD.
Furthermore, we have Divergence on the short term time frame supporting our trade setup and increasing the probability of success in this analysis.
Entry: 1.3050
SL: 1.3008
TP: 1.3134
RR, 1:1.9
Good Luck :-)

Ready to buy dips or break outsUSDCAD is looking pretty oversold, 1.2460 looks like a nice level to start getting long, watching 1.2740/50 area for the first target. USD seems eternally weak so I will protect profits quickly and aggressively.


EURGBP - Possible RetracementIt was noted that the EUR could be losing some steam while the pound could pick up pace to the upside on this setup.
We have Divergence in play which further increases the probability of this setup.
RR, 1:2
Good Luck :-)

AUDUSD - Possible ReversalWe have a possible reversal forming on AUDUSD.
Good Divergence in play already.
R:R, 1:2
Good Luck :-)

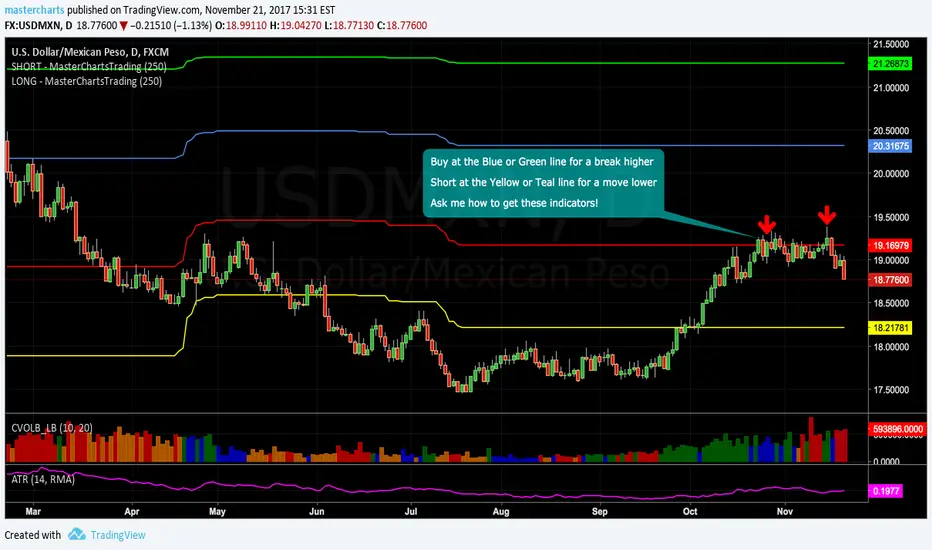
A red week in store for MXNWith Banxico raising rates to 7% I think $16 is a possibility for the Peso in the coming weeks.
I posted about the Peso being oversold on Friday and longed it back to $18, however I am short for the rest of the week.


