GOLD XAUUSD Gold moving as expected respecting our price and entries, will look for swinging opportunities ,and SL adjustments to BE
Forex-free-signals

NZDCHF – Bullish Breakout Sets Stage for ReversalNZDCHF has broken decisively out of a long-term descending channel, signaling a potential trend reversal. Price action confirmed multiple bullish flags within the falling structure, followed by a clean breakout and higher low retest, supporting a bullish continuation bias.
Currently, the pair is stabilizing just above prior resistance turned support around 0.4760–0.4780, forming a potential launchpad for the next leg higher.
Upside Targets:
TP1: 0.48336
TP2: 0.48844
TP3: 0.49319
Invalidation Zone:
A drop below 0.4720 would invalidate the breakout structure and expose the downside.
Fundamental Drivers:
🇳🇿 NZD Strength: RBNZ remains relatively hawkish compared to other central banks, and the Kiwi may gain from improving risk sentiment and easing global recession fears.
🇨🇭 CHF Weakness: Swiss Franc is under mild pressure as safe-haven flows weaken amid improving tone on US-China-EU trade headlines and fading ECB rate cut bets.
🗓️ Macro Flow: Upcoming risk events (Fed comments, trade updates, and NZ economic prints) could inject momentum into the pair, especially if risk appetite improves.
Bias: ✅ Bullish (Buy)
Confidence: ★★★★☆
Watch for: Clean hold above 0.4770 zone + bullish momentum continuation.

Market next move 1. Over-Reliance on Support Zone
The analysis heavily leans on the assumption that the support zone (marked with the purple "Support" label) will hold.
However, this support has already been tested multiple times, which weakens its strength.
A break below this zone could trigger significant stop-loss hunting, leading to a bearish breakdown instead of a bullish reversal.
2. Volume Analysis Suggests Weak Momentum
The recent bounce lacks strong volume. This suggests that buying interest is not convincing at this level.
Without volume confirmation, any bullish move is less likely to sustain.
3. Lower Highs Pattern
Despite small rallies, the chart is forming lower highs, which is typically a bearish signal.
This hints at seller dominance, and the yellow bullish projection might be overly optimistic.
4. Resistance Overhead
The price is approaching a short-term resistance zone (red box), which has rejected the price previously.
Without a clear breakout above that, the bullish case is speculative.
5. Fundamental Factors Unaccounted
The chart doesn’t account for macro factors like U.S. dollar strength, interest rates, or geopolitical influences that often affect gold.
If the dollar strengthens, gold may drop, breaking the support.
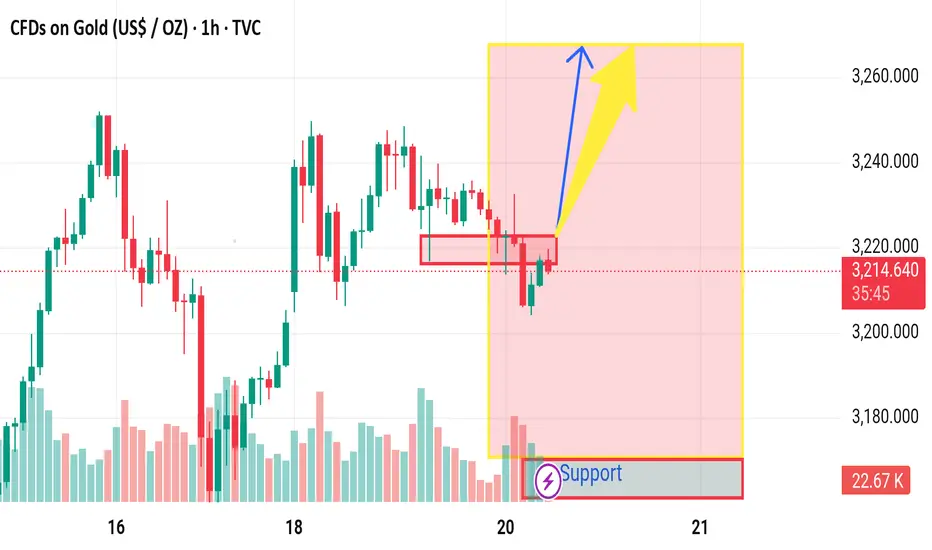
Market next move Bearish Disruption Analysis:
1. Range Weakness and Exhaustion Risk:
The price has been ranging within a tight zone, and repeated tests of the support line near 3,215–3,218 show weakening buyer pressure.
If bulls were strong, we might have already seen a breakout with momentum. Instead, there's sideways choppiness, suggesting indecision or exhaustion.
2. Lower Highs Forming:
Despite a flat support zone, price is forming lower highs, a bearish signal. Sellers are stepping in earlier on each bounce, tightening the range from the top.
3. Volume Depletion:
Volume is gradually dropping during this consolidation. If a breakout happens without a volume surge, it risks becoming a false breakout.
4. Liquidity Sweep Possibility:
Market makers might push price below the support zone (~3,215) to trigger stop-losses and accumulate orders before a potential real breakout. This would trap late buyers who enter early.
5. Bearish Scenario Path:
If price breaks below 3,215 and closes under that on decent volume, expect a move to the next demand zone near 3,200 or lower.
Downside target could be around 3,180–3,190, where the previous demand base formed on May 15.

Usdjpy dropping level read the caption In the bigger picture, correction from 151.81 (2023) high could have completed at 140.25 already. Rise from 127.20 (2023 low), as part of the long term up trend, is probably ready to resume. Decisive break of 151.93 resistance (2022 high) will confirm this bullish case. Next medium term target will be 61.8% projection of 127.22 to 151.88 from 140.22 at 155.21 This will remain the favored case as long as 146.46 support holds, in case of another pullback.

GBP/USD
Hello traders ,what do you think about GBPUSD? This currency pair has broken its trend line and support zone. It is expected to fall to the specified level after correction and pullback to the broken zone.
If this post was useful to you, do not forget to like and comment.🙏

Dow Jones ready to jump read the caption Dow Jones The index is drifting lower from its record high seen on Monday, but with no sign yet of a more significant move lower.The continued barrage of earnings may act to drive the price downwards, in which case last week’s lows around 37,200 may provide support. Below this, the 50-day simple moving average (SMA) becomes the next area to watch.
A close back above 38,001 leaves the index on course to hit new highs.

Btc confirm analysis read the caption Btc The technical picture now is more bearish as the decline from the 20-month high reached two weeks ago has continued, with the price trading above the big round number at $40,000 and breaking above some resistance levels which have now likely flipped to become resistance.
Despite this bearishness, over the past couple of days the price has firmed up and established a couple of higher lows and support levels. However, the price chart below shows that the price is well within a bearish price channel, although the lack of symmetry in the channel suggests that it may not be very reliable. Nevertheless, there is a confluence of the upper trend line of this channel with a zone of resistance stretching from $40,423 to $40,667. This looks likely to be a great place to enter a short trade if we get a bearish reversal rejecting that area.

Eurusd expected move read the caption Eurusd relatively volatile after the latest flash manufacturing and services PMI numbers from the US and Europe. It initially jumped to a high of 1.08980 and then pulled back as traders wait for the upcoming ECB decision and US economic data.
The latest numbers by S&P Global showed that European manufacturing sector continued to contract in January as companies complained about inflation and supply chain issues. In Europe, the manufacturing PMI rose to 46.5, better than the expected 44.7. Despite the improvement, it remained below 51, meaning that the contraction phase continued.

Usoil follow the trendline read the caption It has been an unpleasant month for oil traders. Crude oil has risen $3 this month but it's been a rough road getting there with repeated whipsaws intraday and extreme choppiness in trading.
Headlines about the Red Sea have been faded over and over again despite bullish implications and fears of an OPEC breakdown remain high.
However when you back it out, the chart starts to look promising. A series of higher lows began on December 14 and oil is now trading at a five-week high. If $76.16 breaks, it will be an six-week high.

Gold struggle to selling read the caption Gold has bullish it's a good opportunity as it has been widely used as a store of value and medium of exchange. Currently, apart from its shine and usage for jewelry, the precious metal is widely seen as a safe-haven asset, meaning that it is considered a good investment during turbulent times. Gold is also widely seen as a hedge against inflation and against depreciating currencies as it doesn’t rely on any specific issuer or government.

Dow Jones ready to fly read the caption US stocks climbed broadly higher on Monday, etching in fresh all-time highs as last week’s late break into record prices carried over into the new trading week, with tech stocks leading the way higher and sending the Dow Jones Industrial Average (DJIA) over the $38,500.00 valuation for the first time ever.
Dow Jones ready to bullish trend The Standard & Poor’s (S&P) 500 major equity index continues its march towards $5,000.00, ending Monday at $4,800.43 after hitting a new record high of $4,880.05 as investors continue to pile into stock bets.

BTC uptrend a good opportunity read the caption Therefore, the outlook for Bitcoin is bullish, with the next point to watch being at $34,000. In the longer term, however, there is a likelihood that it will bounce back and retest the in few month high of 44 080

Eurusd ready to downfall read the caption The eurusd pair trade little change for a second eurusd will down soon so wait and see consecutive day changing hands at around 1.0880 ahead of united states us opening the peaked at 1.0906 while it net a bottom at 1.0876

EURUSDGoing with the trend we can ensure our profits, sure enough!
We are going on a downtrend, a reversal since May 23, we can see a new LL created after breaking an old HL, and creating a new support
selling in this trade
1.5
Trade at your own risk!

USDJPY NEXT UP MOVE FOREXUSDJPY NEXT UP MOVE FOREX,
Forex Lovers Can Follow Us For Intraday Trades..


USDJPY UPDATE: Buy; H4 TIMEFRAMEUSDJPY has rejected the 135.663 level by a bullish engulfing candle, foll [wed by a pin bar, heading to the 137.794 resistance level. Place your stop below the support zone, below 135. 663 as indicated in the chart.

QUICK UPDATE ON EURUSD: YOU ONLY NEED TO SELL IT.Zoom to see, please . Chart analysis: H1 timeframe. There is a confluence right now in the eurusd chart: the price has retraced to the trendline after breaking it, and it has rejected the horizontal and sloppy trendlines at the same time. The present candle has formed a bearish pin bar. It is a sell time. Our first profit target will be 1. 05961. Trade like a pro; don't trade like a newbie.
The arrow drawn is indicating the confluence point in the chart.

EU BIAS: SHORT, BUT BE PATIENT. DON'T RUSH!Hello there, my fellow traders,
Zoom It To See Clearly .
Yeah, the wedge has been broken, but the price is still above the support and resistance zone. What next? What should you do now? The simple answer is waiting, meaning you have to exercise patience here to see if the price will break and close below this zone and the 1.0583 level before looking for a sell signal. Don't rush.
Fact: the market may experience a short-term pullback before resuming the downward movement. So, just wait to see that the price closes below the zone before selling. If It breaks and closes below it, then look for a selling opportunity in the small timeframe.

GU BIAS: IT'S A SELL COUNTINUATIONHello there,
What is happening today in the cable market? Nothing much! It's just that, currently, the cable is selling strong. In the H4 timeframe, we have seen that the price has pulled back, respecting and rejecting the 23.6 fib level. If the current candle closes to form a bearish engulfing candlestick pattern, then we are good to sell It right away.
Why should you sell the cable now? The strong trendline has been broken and the price is now below the 50 and 20 moving averages. This shows us that the momentum is in favor of the bears.
Stop loss: 1.2238
First Take profit: 1.2138
Second take profit: 1.1942
Entry: market
Shalom.

GU UPDATE: IT IS A BUYHi there again, this analysis is from the H1 timeframe. An inside bar candlestick has formed now. It's a buy time. Don't be scared. It's going to end in profit. We have seen the confluence: the price has respected the horizontal line and the trendline support level area. A Doji candle has formed. Just wait for this current candle to close for confirmation.
Entry: market
Take profit: 1.2438
Stop loss: 1.22688
Shalome

GBPUSD BIAS: GO LONG: DON'T SHORT ITAre you shorting the cable? No. No. No! Don't! Why? It's because the cable is strongly bullish. The bulls are in control of the market. Remember, the trend is your friend. Don't go against the trend, dear trader. This analysis is from the H4 timeframe.
Currently, the resistance level has been broken and retested, and the price is heading to the level of 1.24071. The probability of the price breaking this level to continue going up this week is 75%.
