#006: EUR/NOK SHORT Investment Opportunity
Hi, I'm Andrea Russo and today I want to show you this SHORT investment opportunity on an often undervalued but extremely interesting pair: EURNOK.
I would like to thank in advance our Official Broker Partner PEPPERSTONE for the support in creating this article.
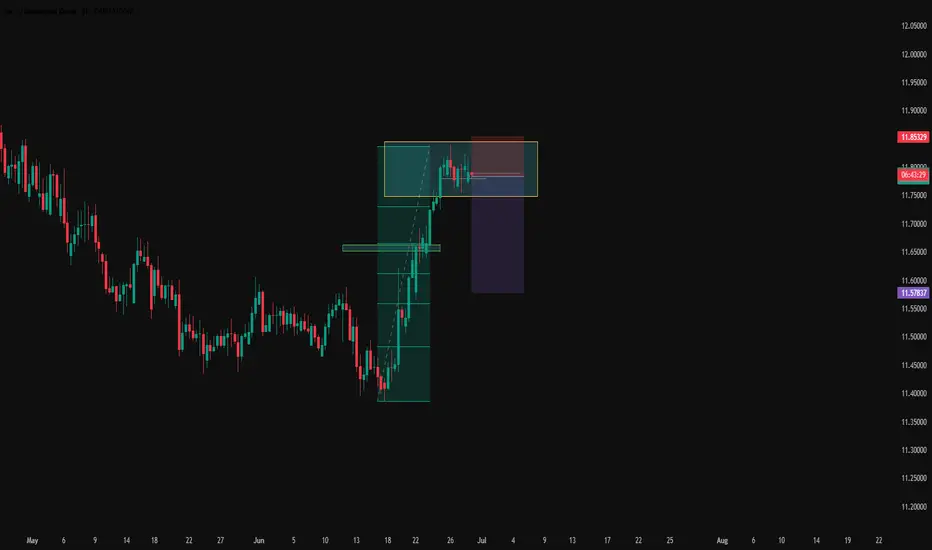
The Euro / Norwegian Krone exchange rate has reached an excess area, with a recent high in the 11.79 area, showing signs of bullish exhaustion on multiple timeframes. Prices are currently above the EMA200, but this data is not enough to justify a further extension of the rise, especially considering the behavior of institutional operators and the macro weakness of the euro.
Technical context
The price structure shows a congestive lateral phase, with upper spikes that do not find continuation, signaling a probable distribution phase. The level of 11.8530 has acted as an upper protective zone, often defended with declining volumes and passive orders.
The target at 11.5800 corresponds to a historical cluster of volumes, and is supported by protections at the level of options and open interest. In the event of a break of the local lows, an acceleration of the bearish movement is plausible.
Fundamental context
The Norwegian krone is currently benefiting from an improvement in domestic macro data, while the euro is suffering from a fragile context with divergences between member countries and signs of slowdown.
Market sentiment shows a balanced positioning by retail traders, indicating a possible expectation of institutional investors to strike forcefully in the opposite direction to any future imbalances.
Stay tuned for more updates.
Forex-trade
Gold price analysis July 1On the D1 chart, the price has recovered positively when the candle closed above 50% of the decrease range of last Friday's session. This shows that buying power is returning and a new uptrend is forming, with the target heading towards the GAP zone around 3363.
Today's trading strategy:
Prioritize buying (BUY) if the price has a correction to the support zone of 3300.
Sell strategy should only be implemented at important resistance zones, with short-term profit expectations because the main trend is leaning towards the uptrend.
Important technical levels:
Support: 3300 - 3337 - 3360
Resistance: 3334 - 3348 - 3363

Exclusive: GBP/USD Swing Heist – Limited-Time Opportunity!🏴☠️ GBP/USD HEIST ALERT: Bullish Loot Grab Before the Cops Arrive! 🚨💰
🌟 Attention, Market Pirates & Profit Raiders! 🌟
"The vault is unlocked—time to swipe those pips!"
🔥 THIEF TRADING STRATEGY (Swing/Day) 🔥
Based on high-risk, high-reward technical & fundamental analysis, here’s the master plan to plunder GBP/USD ("The Cable")!
📈 ENTRY (Bullish Heist Zone)
"The vault is OPEN!" – Long at any price, but for precision:
Buy Limit orders preferred (15m-30m timeframe).
Pullback entries from recent swing lows/highs = sneakiest loot grab!
🛑 STOP LOSS (Escape Route)
Thief SL: Nearest swing low (4H chart).
Adjust based on: Risk tolerance, lot size, & number of orders.
"A good thief always has an exit plan!"
🎯 TARGETS
1.37500 (or escape early if the cops 🚓 (bearish traps) show up!).
Scalpers: Only long-side raids! Use trailing SL to lock profits.
💥 WHY THIS HEIST? (Bullish Momentum)
Technicals + Fundamentals align for a potential breakout.
Overbought? Risky? Yes—but the best loot is guarded!
📢 TRADING ALERT (News & Risk Mgmt)
Avoid new trades during high-impact news (volatility = police sirens!).
Trailing stops = Your getaway car. Protect profits!
🚀 BOOST THE HEIST!
💖 Hit "Like" & "Boost" to fuel our next raid!
💬 Comment your loot tally below!
"Stay sharp, thieves—see you at the next heist! 🤑🔥"

"USD/CHF Breakout - Real Deal or Trap?"🏦 SWISS BANK HEIST: USD/CHF BULLISH LOOT GRAB 🚨
(Professional Money Snatching Strategy)
🦹♂️ Attention All Market Bandits!
(Hola! Oi! Salut! Hallo! Ahlan!) 🎭💰
🔥 Thief Trading Intel Confirmed!
The USD/CHF "Swissy" vault is ready for cracking! Our bullish robbery plan targets 0.84500 - but we must escape before the bears (police) set their trap!
🔓 ENTRY: CRACKING THE SAFE
"0.82800 MA is the vault door!"
✔ Option 1: Buy Stop above MA (breakout play)
✔ Option 2: Buy Limit at swing low (15m/30m pullback)
🔔 Pro Tip: Set alerts - real thieves never miss their heist!
🚨 STOP LOSS: POLICE EVASION PLAN
📍 Thief SL: 0.81900 (below 3H swing low)
⚠️ Warning: No SL before breakout! You'll trigger the alarms!
💎 TARGET: ESCAPE WITH THE LOOT
🎯 Primary Take: 0.84500
💰 Scalpers: Long-only! Trail SL like a getaway car!
📊 MARKET CONDITIONS
⚖️ Neutral Trend (but bullish potential brewing!)
🔍 Key Intel Needed: COT reports, macro data, CHF safe-haven flows
🌐 Full Briefing: Bi0 linkss 👉🔗 (don't go in blind!)
🚦 RISK MANAGEMENT PROTOCOLS
• ❌ Avoid trading during news events
• 🔒 Always use trailing stops
• 💣 Position size = your explosive potential
🦾 SUPPORT THE SYNDICATE
💥 SMASH THAT BOOST BUTTON!
💬 Comment your heist results below!
🔔 Next robbery coming soon - stay tuned!
🤑 Remember thieves: Book profits before the Swiss police arrive!

"CHF/JPY Bullish Trap? We’re Stealing Profits Anyway!"🔥 Swiss-Yen Bank Heist: Bullish Loot Grab! (CHF/JPY Master Plan) 🔥
🌟 Hi! Hola! Ola! Bonjour! Hallo! Marhaba! 🌟
Attention Money Makers & Market Robbers! 🤑💰💸✈️
Based on the 🔥Thief Trading Style🔥 (technical + fundamental analysis), we’re plotting a bullish heist on the CHF/JPY "Swiss-Yen" Forex Bank. Follow the strategy on the chart—long entry is our golden ticket! Target? The high-risk Red Zone—where police traps, overbought signals, and bearish robbers lurk. But we’re sneaky thieves… and we always get the loot! 🏆💸
📈 Entry: "The vault is wide open!" Swipe bullish gains at any price—the heist is LIVE!
Pro Tip: Place buy limit orders within 15-30 min (swing lows/highs).
🛑 Stop Loss:
Thief-style SL at recent 4H swing low (174.100) (Day/scalping trade)
Adjust based on your risk, lot size, and multiple orders.
🎯 Target: 177.200 (Time to cash out!)
🧲 Scalpers: Eyes here! 👀
Only scalp LONG.
Big money? Charge in! Small budget? Join swing traders and execute the robbery.
Trailing SL = Your money’s bodyguard. 💰
Why CHF/JPY?
Bullish momentum fueled by:
Fundamentals (COT reports, macro trends)
Sentiment + Intermarket analysis (Check our bioo for deep dives! 🔗👉👉👉)
⚠️ Trading Alert: News = Chaos! 📰🗞️🚫
Avoid new trades during major news.
Trailing stops = Profit protector.
💖 Support the Heist!
Smash the Boost Button! 💥
Strengthen our robbery squad. Steal profits daily with the Thief Trading Style! 🏆💪🚀
Stay tuned—another heist drops soon! 🤑🐱👤🤩

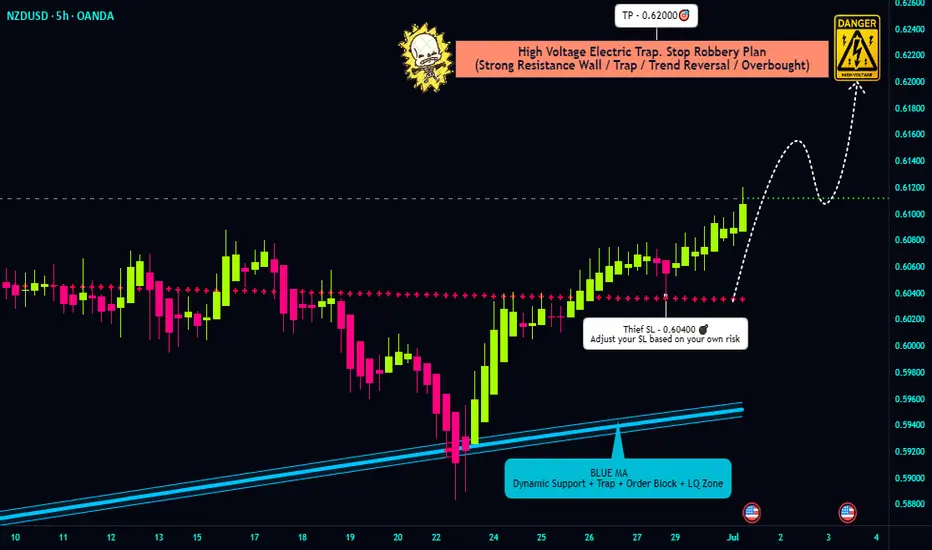
"NZD/USD Bullish Heist! Steal Pips Before the Reversal Trap! 🏴☠️ NZD/USD Kiwi Heist Masterplan – Steal the Bull Run! 💰
🌟 Hola, Money Makers & Market Marauders! 🌟
Welcome to the Thief Trading Style raid on the NZD/USD "The Kiwi" Forex vault. Follow the blueprint sketched in the chart for a bold long takeover — escape the high‑risk Yellow MA Zone before guards tighten!
🎯 Heist Blueprint
1. Entry 🚀
"The vault swings wide—yank that Bull loot at any price!"
Drop your buy-limit orders within the next 15–30 min (or at the latest swing low/high). Don’t sleep—set chart alerts for the perfect breach.
2. Stop‑Loss 🛑
Thief-style SL lurks at the nearest 5h swing‑low wick (≈ 0.60400) for intra‑day.
Adjust your SL based on your risk appetite, position size, and combo of orders.
3. Target 🎯
Aim to escape by 0.62000, or bail early for safety.
4. Scalpers’ Edge 🔍
Only rob on the long side. Big bankroll? Go all‑in. Prefer safety? Slide into the swing crew with a trailing SL to lock in your spoils.
🔍 Market Intel
Why the Kiwi Loot is Ripe:
Bullish momentum marches on, fueled by macroeconomic clues, COT data, sentiment shifts, inter-market moves — all pointing upward.
📚 For Full Recon:
Dive into the fundamental, macro, COT, quant, sentiment & intermarket intel — plus trend targets and scorecards. Check the data here 👉🔗🔗
⚠️ Caution Zone
News Watch & Position Safety:
Major news = guarded vault. Don't open new trades during release windows.
If you're in already, use trailing stops to shield your haul and lock in gains.
💪 Support the Crew
Smash that “Boost” to fuel our team and keep the raid running smooth. With Thief Trading Style, every day’s a payday.
🗓️ Stay tuned for the next Kiwi Heist – we’re just getting started. Happy robbing, legends! 🐱👤💥
EUR/CAD Raid Alert: Last Chance to Loot This Bullish Breakout!🏴☠️ EUR/CAD LOOT ALERT: Can We Steal 100 Pips Before the Trap Springs? (Thief Trading Blueprint)
🌟 Hola! Bonjour! Ciao! Hallo! Marhaba! 🌟
Attention Forex Bandits & Loonie Raiders! 💶🦫💰
🔥 Thief Trading Intel: We're targeting EUR/CAD for a MA breakout heist! Long entry only - eyeing that 1.57200 breakout level. High-risk MA Zone ahead: overbought, consolidating, perfect for our ambush.
"Take your pips and vanish - this steal's on the house!" 💨💵
🚪 ENTRY: The Trap is Set!
📈 "Wait for MA breakout at 1.57200 - then STRIKE!"
Option 1: Buy Stop above MA (breakout confirmation)
Option 2: Buy Limit at swing levels (15-30 min TF)
📌 Pro Thief Move: SET THOSE ALERTS!
🛑 STOP LOSS: Escape Plan
🔊 "Listen up, rookies!" 🗣️
Breakout trades? NO SL until after confirmation!
Rebels: Place wherever... but sleep with one eye open! 👁️
📍 Smart Crew SL: Nearest swing low (1H TF)
🎯 TARGET: Loot & Scoot!
🎯 1.58200 (100 pips of pure profit!)
⚡ SCALPERS' QUICK HIT
👀 Long only!
Deep pockets? Raid now
Light wallet? Join swing heist
Trailing SL = Your Getaway Car! 🚗💨
📢 WHY THIS HEIST?
"Euro vs Loonie" showing strength! Watch for:
COT data & Macro trends
Intermarket analysis
Sentiment shifts
🔗 Full dossier? Bio0 links below! 👉🏻☝🏻👉🏻☝🏻
⚠️ WARNING: News = Police Raid! 📰🚨
CAD news moves fast! Protect your stash:
❌ No new trades during news
🔒 Trailing stops = Handcuff-proof profits
💖 SUPPORT THE CREW!
💥 SMASH THAT BOOST BUTTON! 💥
More boosts = bigger future scores!
Stronger crew = more pips for all!
Next currency heist coming soon... 💶🔫

GBP/USD HEIST ALERT: Bullish Breakout or Bearish Trap?🌟 Hey! Hola! Ola! Bonjour! Hallo! Marhaba! 🌟
Calling all Market Robbers & Profit Pirates!💸💰
🔥 Thief Trading Intel: Our crew’s latest heist targets GBP/USD "The Cable"—bullish breakout incoming! Long entry only. High-risk Red Zone ahead: overbought, consolidating, and ripe for a reversal. Don’t get caught in the bear trap! 🏴☠️
"Take your loot and run, trader—you’ve earned this steal!" 💪🎯
🚪 ENTRY: The Heist Begins!
📈 "Wait for MA breakout (1.36000) then STRIKE—bullish profits await!"
Option 1: Buy Stop above Pink Resistance (breakout confirmation).
Option 2: Buy Limit at swing low/high (15-30 min TF).
📌 Pro Tip: SET AN ALERT! Don’t miss the breakout.
🛑 STOP LOSS: Escape Route
🔊 "Yo, listen up! 🗣️
Buy Stop orders? NO SL until after breakout! 🚀
Rebels: Place SL wherever—but you’ve been warned! ⚠️🔥
📍 Thief SL (Smart Crew): Recent/swing low (1.35000, 4H TF).
📍 Adjust based on your risk, lot size, and orders.
🎯 TARGET: Loot & Exit!
🎯 1.37500 (or escape early if the market turns!)
⚡ SCALPERS’ QUICK GRAB
👀 Long scalps ONLY!
Big wallets? Raid now.
Small stacks? Join swing traders.
Trailing SL = Your Money Shield! 🛡️💰
📢 WHY THIS HEIST? (GBP/USD Bullish Momentum)
"The Cable" is heating up! Key drivers:
Fundamentals (COT, Macro Data)
Sentiment & Intermarket Trends
Future Targets & Score Outlook
🔗 Full intel? Bio links below! 👉👉
⚠️ TRADING ALERT: News = Danger Zone! 📰🚨
News = Volatility Spikes! Protect your loot:
❌ Avoid new trades during news.
🔒 Trailing SL = Profit Lock.
💖 SUPPORT THE HEIST CREW!
💥 SMASH THAT BOOST BUTTON! 💥
More boosts = easier money grabs!
Stronger crew = bigger heists!
Profit daily with Thief Trading Style! 🏆🚀
Next heist coming soon—stay tuned! 🤑🐱👤🤩

NZD/CHF Heist Blueprint: Snag the Kiwi vs. Franc Profits!Ultimate NZD/CHF Heist Plan: Snag the Kiwi vs. Franc Loot! 🚀💰
🌍 Greetings, Wealth Raiders! Hola! Ciao! Bonjour! 🌟
Fellow money chasers and market bandits, 🤑💸 let’s dive into the NZD/CHF "Kiwi vs. Franc" Forex heist with our 🔥Thief Trading Style🔥, blending sharp technicals and solid fundamentals. Follow the charted strategy for a long entry, aiming to cash out near the high-risk ATR zone. Watch out for overbought signals, consolidation, or a trend reversal trap where bearish robbers lurk. 🏴☠️💪 Seize your profits and treat yourself—you’ve earned it! 🎉
Entry 📈
The vault’s open wide! 🏦 Grab the bullish loot at the current price—the heist is live! For precision, set Buy Limit orders on a 15 or 30-minute timeframe, targeting a retest of the nearest high or low.
Stop Loss 🛑
📍 Place your Thief SL at the recent swing low on a 4H timeframe for day trades.
📍 Adjust SL based on your risk tolerance, lot size, and number of orders.
Target 🎯
Aim for 0.50400 or slip out early to secure your loot! 💰
Scalpers, Listen Up! 👀
Stick to long-side scalps. Got big capital? Jump in now! Smaller stacks? Join swing traders for the robbery. Use a trailing SL to lock in your gains. 🧲💵
NZD/CHF Market Intel 📊
The Kiwi vs. Franc is riding a bullish wave, fueled by key drivers. Dig into the fundamentals, macro trends, COT reports, sentiment, intermarket analysis, and future targets for the full scoop. 🔗👇
⚠️ Trading Alert: News & Position Safety 📰
News drops can shake the market! To protect your loot:
Skip new trades during news releases.
Use trailing stops to secure profits and limit losses. 🚫
Join the Heist! 💥
Support our robbery plan—hit the Boost Button! 🚀 Let’s stack cash with ease using the Thief Trading Style. 💪🤝 Stay sharp for the next heist plan, bandits! 🤑🐱👤🎉

USDJPY h4 strongly bullish opportunity Dip into/under support (~144.5)
2. Trap and reverse hard
3. Break above 148 with momentum
4. Stretch target → 149.50–150.20

EURUSD h4 strongly bullish Instead of buying the breakout, consider selling the exhaustion. Be open to:
Short setups near 1.18500
Re-entry zones after BOS failure
Lower time-frame signs of momentum divergence

BTCUSD h4 strong down opportunity Price is in a resistance zone and expected to dump heavily.
Support zone seen as temporary.
Long-term bearish target near $97,000-$98,000, possibly below
Trend Rejection & Dump Trap & Pump
Pattern Ending Diagonal Bullish Flag
Target $102K → $97K $108K → $112K+
Strategy Sell Resistance Buy Trap Break

GBP/NZD: The Great Liquidity Grab? (Long Trade Plan)"🏦💰 GBP/NZD BANK VAULT RAID: Bullish Heist in Progress! (Long Setup) 💰🏦
🚨 Overbought Trap? Or Trend Continuation? Here’s How to Loot Pips Safely! 🚨
🦸♂️ GREETINGS, MARKET MARAUDERS!
To all the Profit Pirates & Risk-Takers! 🌍💸
Using our 🔥Thief Trading Tactics🔥 (a ruthless combo of price action + liquidity grabs + macro triggers), we’re executing a bullish heist on GBP/NZD ("Sterling vs Kiwi")—this is not advice, just a strategic raid blueprint for those who trade like outlaws.
📈 THE HEIST PLAN (LONG ENTRY FOCUS)
🎯 Profit Zone: 2.28700 (or escape earlier if momentum stalls)
💥 High-Stakes Play: Overbought but squeezing higher—trap for bears.
🕵️♂️ Trap Spot: Where sellers get liquidated.
🔑 ENTRY RULES:
"The Vault’s Open!" – Swipe bullish loot on pullbacks (15-30min TF).
Buy Limit Orders near swing lows for better risk/reward.
Aggressive? Enter at market—but tighter stops.
📌 SET ALERTS! Don’t miss the breakout retest.
🛑 STOP LOSS (Escape Route):
Thief SL at recent swing low (2H timeframe).
⚠️ Warning: "Ignore this SL? Enjoy donating to the market."
🎯 TARGETS:
Main Take-Profit: 2.28700 (or trail partials).
Scalpers: Ride long waves only. Trailing SL = VIP exit pass.
📡 FUNDAMENTAL BACKUP (Why This Heist Works)
Before raiding, check:
✅ COT Data (Are funds long GBP/short NZD?)
✅ Rate Spreads (GBP vs NZD yield shifts)
✅ Commodity Correlations (Dairy prices? Risk mood?)
✅ Sentiment Extreme (Retail over-shorting?)
🚨 NEWS RISK ALERT
Avoid new trades during RBNZ/BOE speeches (unless you like volatility casinos).
Trailing stops = your bulletproof vest.
💣 BOOST THIS HEIST!
👍 Smash Like to fuel our next raid!
🔁 Share to recruit more trading bandits!
🤑 See you at the target, rebels!
⚖️ DISCLAIMER: Hypothetical scenario. Trade at your own risk.
#Forex #GBPNZD #TradingView #LiquidityGrab #TrendContinuation #ThiefTrading
💬 COMMENT: "Long already—or waiting for a deeper pullback?" 👇🔥

NZDJPY “Kiwi Poised to Fly as Japan Muddles ThroughNZDJPY shows a bullish breakout from a descending trendline, with bullish structure holding near 87.20–87.25.
Key resistance targets:
87.97 (Previous high)
88.64 (Next resistance / projected fib target)
Two upside scenarios are shown:
Conservative target: ~87.97
Aggressive swing: ~88.64
If 87.00–87.20 zone holds as support, expect bullish continuation.
🧩 Current Bias: Bullish
📌 Key Fundamentals Driving NZDJPY
NZD Side (Strengthening):
RBNZ hawkish hold: RBNZ recently kept rates at 5.50% and warned that inflation remains persistent, requiring prolonged tight policy.
Resilient NZ GDP: Stronger-than-expected GDP print signals economic resilience.
Terms of trade improvement: Commodity exports holding firm, China consumption rebound showing hints of demand recovery (see recent 618 festival sales data).
AUD correlation: AUD and NZD are moving together; if AUD strengthens, NZD often follows.
JPY Side (Weakening):
BoJ remains ultra-dovish: Despite inflation trends, BoJ is hesitant to tighten further, preferring gradual tapering.
Yen under pressure from yield differentials: Global central banks (like RBNZ, Fed) remain hawkish while BoJ is not.
Geopolitical funding flows: JPY used as a funding currency amid global volatility (carry trade boost for NZDJPY).
⚠️ Risks That May Reverse the Trend
BoJ surprise tightening rhetoric (e.g. bond purchase taper announcement).
China data deterioration, hurting Kiwi sentiment.
Sharp equity sell-off and geopolitical escalation (Yen safe-haven reversal).
📅 Important News to Watch
🇳🇿 NZ Trade Balance (upcoming)
🇯🇵 Tokyo Core CPI (Jun 28) – Critical for BoJ policy speculation.
RBNZ or BoJ member speeches (hawkish or dovish shifts)
Fed tone shift or US dollar strength spillover
🏁 Who Leads the Move?
NZDJPY could lead among yen crosses due to the RBNZ’s clear inflation fight versus BoJ’s passive stance. NZDJPY is also more responsive to commodity and global risk-on flows than EURJPY or USDJPY.

Traders, it's time to pay close attention! 🚨 USDJPY 4H Setup Alert – High-Probability Play Unfolding! 🚨
Traders, it's time to pay close attention! 🧠📊
The USDJPY pair has just perfectly tapped into a key bullish Fair Value Gap (FVG) on the 4-hour chart — a classic move in the smart money playbook. What’s more? We've just seen a clean sweep of internal range liquidity (IRL) — a textbook liquidity grab that signals potential accumulation by larger players. 💥💼
This is not just noise — it's a significant signal. The market structure is hinting at a possible shift in momentum, and bullish pressure is building. The trap has been set, the weak hands have been shaken out, and smart money may be preparing for a strong upward push. 📈🐂
🔮 What’s the next move?
All eyes are now on the external range liquidity (ERL) — a prime liquidity pool sitting above current price levels. If price accelerates toward it, this zone could act as the magnet and the catalyst for the next explosive move upward. 🚀
🔥 Key Points to Watch:
Bullish FVG reaction ✅
IRL liquidity swept ✅
Bullish market structure forming 🏗️
ERL liquidity resting overhead — potential target 🎯
Volume profile & order flow confirming accumulation? 👀
⚠️ Stay alert and don’t chase — let the setup come to you.
Smart money might already be stepping in, and if this momentum follows through, we could be witnessing the beginning of a strong leg up.
Mark your charts and monitor closely — opportunity is knocking. 📍🕵️♂️

EURUSD Long Setup – Bullish Rejection from Demand ZoneEURUSD remains supported by strong eurozone fundamentals and broad USD softness. The pair has retraced into a key demand zone around 1.1490 and is showing signs of bullish rejection. With the Fed likely to pause further rate hikes and the ECB maintaining a steady tone, the bias favors further upside toward recent highs.
⚠️ Geopolitical tensions in the Middle East (Israel-Iran conflict) have introduced mild safe haven demand, but so far the USD has underperformed versus the euro, suggesting EUR remains relatively insulated.
Watch for confirmation and entries within the blue demand box.
🔍 Technical Analysis:
Structure: Clear uptrend with higher highs and higher lows. Price retraced to a well-defined 1H demand zone between 1.1490–1.1500.
Setup: Anticipating a bounce from the demand zone targeting the recent high near 1.1620–1.1630.
Entry Zone: 1.1490–1.1500 (bullish reaction area)
Target: 1.1620–1.1630 (previous supply zone)
Stop Loss: Below 1.1439 (recent swing low)
Risk-Reward Ratio: Approximately 1:2.5
🧠 Fundamental Context (as of June 16):
EUR Bias: Bullish – ECB has paused cuts; euro is resilient despite geopolitical headwinds.
USD Bias: Bearish – Fed is on pause; soft inflation data and geopolitical risks weigh on dollar strength.
Key Drivers:
Fed dovish tone (FOMC pause, lower CPI)
Strong EU resilience despite global tensions
CHF and JPY attracting safe haven flows over USD
📅 Key Events to Watch:
US Core PCE (next major inflation readout)
FOMC commentary and Fed speakers
Eurozone CPI and sentiment data

Opportunity to buy EURUSDI see an opportunity to buy the EUR/USD pair from the support shown in the image and the target will be 1.16316

GBPJPY - Major Resistance Zone Threatens Further UpsideThe GBP/JPY 4-hour chart reveals the pair is approaching a critical resistance zone around the 196.00-196.50 level, marked by the upper boundary of the highlighted rectangular area, which represents a significant technical ceiling that has been tested multiple times over the past month. This resistance level coincides with previous swing highs and appears to be acting as a formidable barrier to further upside progress, suggesting that traders should exercise heightened caution as selling pressure is likely to intensify in this area. The pair's recent rally from the May lows around 190.50 has been impressive, but the multiple rejections from this upper resistance zone indicate that institutional sellers may be positioned to defend these levels aggressively. Given the historical significance of this resistance area and the potential for profit-taking after the substantial advance, market participants should be prepared for increased volatility and possible reversal signals as the pair approaches or tests this key technical barrier, making risk management particularly crucial at current levels.
Disclosure: I am part of Trade Nation's Influencer program and receive a monthly fee for using their TradingView charts in my analysis.

CAD/JPY "Loonie-Yen" Forex Bank Bullish Heist Plan🌟Hi! Hola! Ola! Bonjour! Hallo! Marhaba!🌟
Dear Money Makers & Robbers, 🤑 💰💸✈️
Based on 🔥Thief Trading style technical and fundamental analysis🔥, here is our master plan to heist the CAD/JPY "Loonie-Yen" Forex Bank. Please adhere to the strategy I've outlined in the chart, which emphasizes long entry. Our aim is the high-risk Red Zone. Risky level, overbought market, consolidation, trend reversal, trap at the level where traders and bearish robbers are stronger. 🏆💸Book Profits Be wealthy and safe trade.💪🏆🎉
Entry 📈 : "The vault is wide open! Swipe the Bullish loot at any price - the heist is on!
however I advise to Place buy limit orders within a 15 or 30 minute timeframe most recent or swing, low or high level for pullback entries
Stop Loss 🛑:
Thief SL placed at the recent / nearest low level Using the 30Min timeframe (104.800) swing trade basis.
SL is based on your risk of the trade, lot size and how many multiple orders you have to take.
🏴☠️Target 🎯: 106.000 (or) Escape Before the Target
🧲Scalpers, take note 👀 : only scalp on the Long side. If you have a lot of money, you can go straight away; if not, you can join swing traders and carry out the robbery plan. Use trailing SL to safeguard your money 💰.
CAD/JPY "Loonie-Yen" Forex Market Heist Plan (Scalping / Day Trade) is currently experiencing a bullishness,., driven by several key factors.☝🏻👆🏻☝🏻👆🏻
📰🗞️Get & Read the Fundamental, Macro, COT Report, Quantitative Analysis, Sentimental Outlook, Intermarket Analysis, Future trend targets..., go ahead to check 👉👉👉🔗
📌Keep in mind that these factors can change rapidly, and it's essential to stay up-to-date with market developments and adjust your analysis accordingly.
⚠️Trading Alert : News Releases and Position Management 📰 🗞️ 🚫🚏
As a reminder, news releases can have a significant impact on market prices and volatility. To minimize potential losses and protect your running positions,
we recommend the following:
Avoid taking new trades during news releases
Use trailing stop-loss orders to protect your running positions and lock in profits
💖Supporting our robbery plan 💥Hit the Boost Button💥 will enable us to effortlessly make and steal money 💰💵. Boost the strength of our robbery team. Every day in this market make money with ease by using the Thief Trading Style.🏆💪🤝❤️🎉🚀
I'll see you soon with another heist plan, so stay tuned 🤑🐱👤🤗🤩

"GBP/NZD: The Perfect Long Trade (Risk-Managed Heist Plan)"🏦💰 GBP/NZD BANK HEIST: The Ultimate Sterling vs. Kiwi Money Grab! 💰🏦
🌟 Hi! Hola! Ola! Bonjour! Hallo! Marhaba! 🌟
Attention all Money Makers & Market Robbers! 🤑💸✈️
Based on the 🔥Thief Trading Style🔥 (technical + fundamental analysis), here’s our master plan to loot the GBP/NZD "Sterling vs Kiwi" Forex Bank Heist!
📜 THE HEIST BLUEPRINT:
✅ Entry Strategy (Long Only!) 📈
"The heist is ON! Wait for the breakout above the previous high (2.25500) – then strike! Bullish profits await!"
Option 1: Place Buy Stop orders above the Moving Average.
Option 2: Use Buy Limit orders near recent swing lows (15-30 min timeframe) for pullback entries.
📌 Pro Tip: Set an ALERT for the breakout entry—don’t miss the robbery window!
🛑 Stop Loss (Listen Up!)
"Yo, thieves! 🗣️ If you’re entering on a Buy Stop, DO NOT set your SL until after the breakout! 🚀 Place it where I say (or wherever you dare 😈), but remember—your risk, your rules! ⚠️🔥"
📍 Thief SL Placement: Nearest swing low (1H timeframe) – 2.23700 (adjust based on risk & lot size).
🎯 Profit Target: 2.28700 (Time to escape with the loot!)
⚡ Scalpers’ Note: Only scalp LONG! Big wallets? Go all in. Small wallets? Ride the swing. Use trailing SL to protect your stolen cash! 💰
📰 WHY THIS HEIST? (Fundamental Edge)
GBP/NZD is showing bullish momentum due to:
Macroeconomic factors
COT Report insights
Sentiment shifts & intermarket trends
🔗 Full analysis? Check our bio0 for the deep dive!
⚠️ Trading Alert: News = Danger Zone! 📰🚫
Avoid new trades during high-impact news.
Use trailing stops to lock in profits & dodge volatility traps.
💥 BOOST THE HEIST!
💖 Support the robbery crew—SMASH THAT LIKE BUTTON! 💖
🚀 More heists coming soon—stay tuned, thieves! 🏆🤝🎉

DXY Short-Term Reversal Zone in SightUS Dollar Index (DXY) is approaching a strong support zone at 98.90–98.00, which has historically acted as a base for bullish reversals. The price is now testing the lower bound of this zone after a steady downtrend from the 101.94 high.
Key Technical Structure:
Support Zone: 98.90–98.00 (tested 3+ times)
Double Bottom Potential forming if bulls hold the zone
Upside Targets:
101.94: Key horizontal resistance
103.50: Swing high from early April
Scenarios to Watch:
🔹 Bullish Rebound:
Price bounces off 98.90–98.00 support
Confirmation: Break and close above 100.50 near-term resistance
Could fuel move back to 101.94, possibly 103.50
🔹 Bearish Breakdown:
Daily close below 98.00 would invalidate bullish setup
Opens downside to 97.00 and even 95.50
Macro Drivers to Watch:
FOMC speakers and interest rate guidance
US jobless claims or inflation surprise
Risk-off sentiment (benefits USD) vs. continued global risk appetite
Conclusion:
DXY is trading at a make-or-break support zone. Watch for clear bullish reaction or bearish breakdown before committing. The setup favors a bounce unless 98.00 fails.

Pipping the Aussie-Swiss Bank: Day Trading Strategy UnleashedUltimate AUD/CHF Forex Heist Plan 🚨 Swing Trade Mastery for Epic Gains! 🚀
Greetings, Wealth Warriors & Market Mavericks! 👋💸
Get ready to execute a legendary heist on the AUD/CHF "Aussie vs Swissy" Forex market with our exclusive Thief Trading Style! 🎯 This meticulously crafted strategy blends technical precision and fundamental firepower to maximize your profits. Follow the plan outlined in the chart, focusing on a long entry to conquer the high-risk Yellow MA Zone—a battleground of overbought conditions, consolidation, and potential trend reversals where bearish bandits lurk. 🐻 Stay sharp, lock in profits, and trade safely! 💪🎉
Entry 📈: The heist begins! Watch for the MA pullback in the market maker’s trap zone (0.52200 OR above) to strike. Bullish riches await! Set buy stop orders above the Moving Average or place buy limit orders within the 15 or 30-minute timeframe’s recent swing low/high.
Pro tip: Set an alert to catch the breakout entry in action! 🔔
Stop Loss 🛑: Place your Thief SL at the recent swing low/high on the 4H timeframe for swing trades basis. Adjust SL based on your risk tolerance, lot size, and multiple orders.
Target 🎯: Aim for 0.54800 or make a swift exit before the target to secure your loot!
🧲 Scalpers, listen up! 👀 Stick to long-side scalps. Big players can jump in now; others, join the swing trade heist. Use a trailing SL to protect your stash. 💰
💵 AUD/CHF "Aussie vs Swissy" Forex Heist Plan (Swing Trade) is riding a bullish wave 🐂, fueled by critical market drivers. Dive into the fundamentals—Macro Economics, COT Reports, Quantitative Analysis, Intermarket Analysis, Sentiment Outlook, and Future Trends—before launching your heist. Check the linkKs for the full scoop! 🔗👉
📌 Markets move fast, so stay vigilant and adapt your analysis to the latest developments.
⚠️ Trading Alert: News & Position Management 📰🚨
News releases can shake up prices and volatility. Protect your positions by:
Avoiding new trades during news events
Using trailing stop-loss orders to lock in gains
💖 Boost our heist plan! 💥 Hit the Boost Button to supercharge our team’s strength and make stealing profits a breeze. With the Thief Trading Style, you’ll conquer the market daily with ease! 🏆🤝🎉
Stay tuned for the next epic heist plan, Money Makers! 🤑🐱👤🚀

Market next move Original Analysis Summary:
Identifies a bullish structure breaking above a support area.
Projects a potential continuation to higher targets.
Suggests consolidation and bounce from support before climbing.
---
Disruptive Bearish Interpretation:
1. Lower High Possibility:
Recent price action might be forming a lower high rather than a continuation signal, signaling weakness in buying pressure.
2. Volume Imbalance:
Notice how the large green candle was followed by lower bullish volume, suggesting buying momentum is fading.
3. Breakout Trap:
The "Support area" may instead be a liquidity zone where breakout traders entered long positions and could now be trapped. A break below this area could cause a panic sell-off.
4. Trendline Respect (Rejection):
Price is currently retesting the underside of a descending trendline — a common reversal spot.
