AUDJPY ShortsOn the back of global stock markets taking a hit as central banks withdraw there stimulus programs, while covid19 cases still rising.
Forex-trade

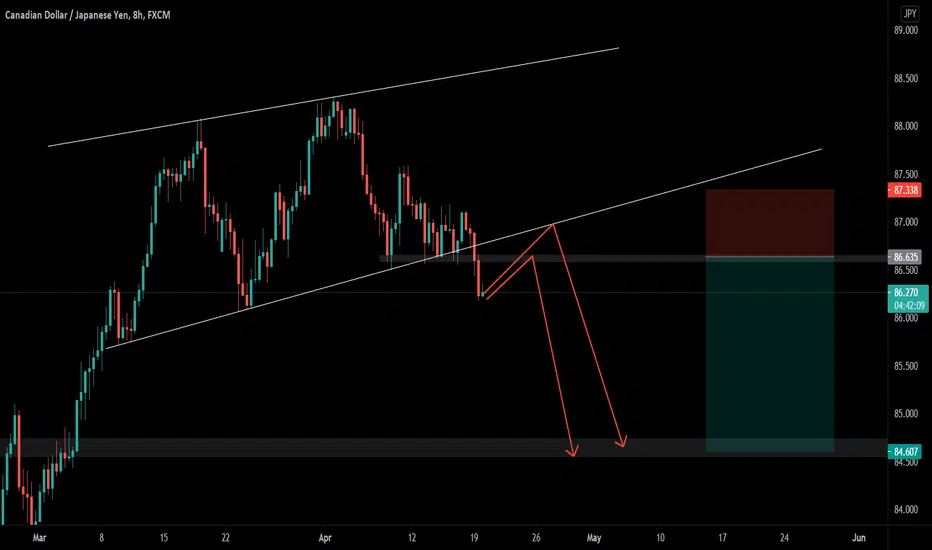
USDCAD trade easy setup even for newbieslook for the trendline to break to the bottom side to get traders in short then long at the local support area with a stop below the lowest wick.

USDCADTP 1.25000 OR 1.26000
Please consider to put a like to my idea for supporting me & subscribe for more ideas.
Idea is not the financial advice!


as we predicted 1.4000 fill for comming days we predict gbp go down ,touch breakout trend then fly up (if you have open sell 100% put tp above trend line 1.3940)
green arrow=powerfull buylimit place with SL=400
note=our main target is 1.47000 for this we advice stand on buy side looking for buy ,dont pick sell signals
good luck


Current view on BTC and testing new way of tradingCurrent view on BTC, 1 hour chart. Took a short earlier which is running nicely in profit at the moment, SL is set to breakeven already so its a risk free one.
This is my first post and i will share information and my personal view on Forex and Crypto pairs with possible trade setups.
Please note i am not a financial advisor and you need to do your own research.
If you like this content, please follow here and if you like this post and want to support me without paying, register on PrimeXBT through my link:
primexbt.com


Gold inverted Head and shoulder...(bullish)Let's buy GOlD to 1753
Before USD new release during london session

NZDUSD - FOREX - 11 April 2021we have a good priceaction pattern in this chart.
as always I'm waiting for the price touching the support and resistance and after that i should wait for a good confirmation, then I will enter that trade,
we have another option that we should wait for the price breakout the pattern and after a pullback and good confirmation, enter the trade!
show me some love with following my tradingview chart and please do not forget to like this idea!❤️

AUDCAD BUY | Day Trading Analysis With Volume ProfileHello Traders, here is the full analysis for this pair.
Watch strong action at the current levels for BUY GOOD LUCK! Great BUY opportunity AUDCAD .
I still did my best and this is the most likely count for me at the moment.
Support the idea with like and follow my profile TO SEE MORE.
Traders, if you liked this idea or if you have your own opinion about it, write in the comments. I will be glad 🤝
Patience is the If You Have Any Question, Feel Free To Ask 🤗


AUDJPY Trade Setup 24/03/2021 LongAUDJPY Trade Setup 24/03/2021 Long
TP3 83.838 (147 pips)
TP2 83.319
TP1 82.769
ENTRY 82.364 - Buy Limit
SL 81.948 (42 pips)
R/R: 3.54


AUDCHF RANG pattern for this dayswe show our idea for u !
u can trade in this R & S price levels for few days !

EURUSD sell now| Going downHello Traders, here is the full analysis for this pair.
Watch strong action at the current levels for SELL. GOOD LUCK! Great SELL opportunity in EURUSD .
I still did my best and this is the most likely count for me at the moment.
Support the idea with like and follow my profile TO SEE MORE.
Traders, if you liked this idea or if you have your own opinion about it, write in the comments. I will be glad 🤝
Patience is the If You Have Any Question, Feel Free To Ask 🤗

EURUSD sell now | Going downHello Traders, here is the full analysis for this pair.
Watch strong action at the current levels for SELL. GOOD LUCK! Great SELL opportunity in EURUSD .
I still did my best and this is the most likely count for me at the moment.
Support the idea with like and follow my profile TO SEE MORE.
Traders, if you liked this idea or if you have your own opinion about it, write in the comments. I will be glad 🤝
Patience is the If You Have Any Question, Feel Free To Ask 🤗
