GBP_AUD RIKSY LONG|
✅GBP_AUD is going down to retest
A horizontal support of 2.2504
And we are locally bullish biased
So I think that we will see a rebound
And a move up from the level
Towards the target above at 2.2571
LONG🚀
✅Like and subscribe to never miss a new idea!✅
Disclosure: I am part of Trade Nation's Influencer program and receive a monthly fee for using their TradingView charts in my analysis.
Forex-trading

GBP_AUD MOVE DOWN AHEAD|SHORT|
✅GBP_AUD has retested a key resistance level around 2.1034
And as the pair is already making a bearish pullback
A move down to retest the demand level below at 2.0859 is likely
SHORT🔥
✅Like and subscribe to never miss a new idea!✅
Disclosure: I am part of Trade Nation's Influencer program and receive a monthly fee for using their TradingView charts in my analysis.

EUR-GBP Resistance Ahead! Sell!
Hello,Traders!
EUR-GBP made a nice
Rebound from the support
Level below just as we predicted
In our previous analysis and is
Growing nicely but the pair
Will soon hit a horizontal resistance
Level of 0.8460 from where
A local bearish correction
Is to be expected on Monday!
Sell!
Comment and subscribe to help us grow!
Check out other forecasts below too!
Disclosure: I am part of Trade Nation's Influencer program and receive a monthly fee for using their TradingView charts in my analysis.

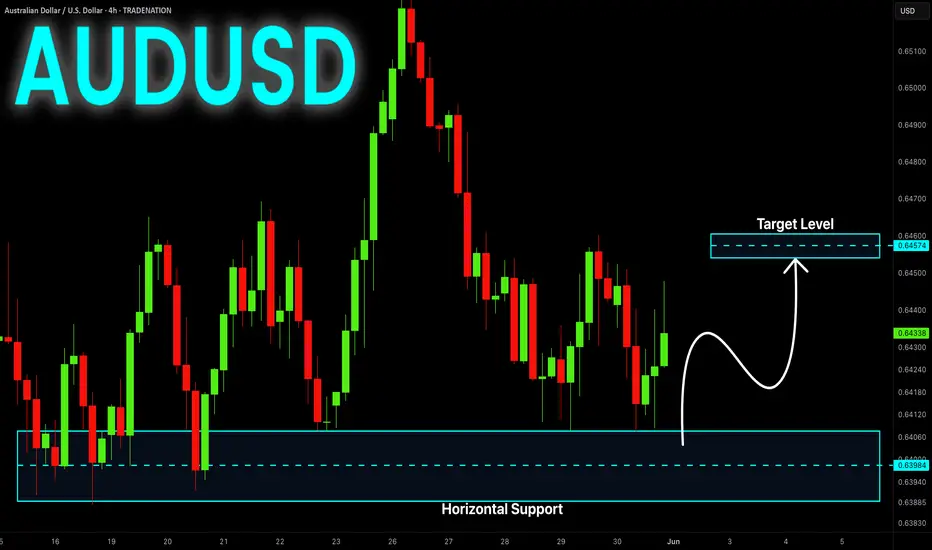
AUD-USD Rebound Ahead! Buy!
Hello,Traders!
AUD-USD made a retest
Of the horizontal demand
Area around 0.6394 and
We are already seeing a
Nice bullish reaction from
The level so we are locally
Bullish biased and we will
Be expecting a further
Local bullish move up
On Monday
Buy!
Comment and subscribe to help us grow!
Check out other forecasts below too!
Disclosure: I am part of Trade Nation's Influencer program and receive a monthly fee for using their TradingView charts in my analysis.
EUR-USD Bearish Bias! Sell!
Hello,Traders!
EUR-USD will soon hit a
Strong horizontal resistance
Level around 1.1420 so as
It is a strong level a local
Bearish pullback and a move
Down are to be expected
On Monday
Sell!
Comment and subscribe to help us grow!
Check out other forecasts below too!
Disclosure: I am part of Trade Nation's Influencer program and receive a monthly fee for using their TradingView charts in my analysis.

EUR_USD WILL FALL|SHORT|
✅EUR_USD is going up now
But a strong resistance level is ahead at 1.1425
Thus I am expecting a pullback
And a move down towards the target
Below at 1.1310on Monday!
SHORT🔥
✅Like and subscribe to never miss a new idea!✅
Disclosure: I am part of Trade Nation's Influencer program and receive a monthly fee for using their TradingView charts in my analysis.

GBP-JPY Growth Ahead! Buy!
Hello,Traders!
GBP-JPY is trading in an
Uptrend along the rising
Support line and the pair
Will soon retest is to we
Will be expecting a rebound
And a bullish move up on Monday
Buy!
Comment and subscribe to help us grow!
Check out other forecasts below too!
Disclosure: I am part of Trade Nation's Influencer program and receive a monthly fee for using their TradingView charts in my analysis.

USD-CHF Growth Ahead! Buy!
Hello,Traders!
USD-CHF is approaching a
Key horizontal support area
Around 0.8189 which is a
Strong level so after the retest
A local bullish correction
And a move up are to be expected
Buy!
Comment and subscribe to help us grow!
Check out other forecasts below too!
Disclosure: I am part of Trade Nation's Influencer program and receive a monthly fee for using their TradingView charts in my analysis.

GBP_JPY RISING SUPPORT|LONG|
✅GBP_JPY is trading along the rising support
And as the pair will soon retest it
I am expecting the price to go up
To retest the supply levels above at 194.500
LONG🚀
✅Like and subscribe to never miss a new idea!✅
Disclosure: I am part of Trade Nation's Influencer program and receive a monthly fee for using their TradingView charts in my analysis.

AUD_NZD BEARISH BREAKOUT|SHORT|
✅AUD_NZD made a bearish
Breakout of the key horizontal
Level of 1.0783 and the breakout
Is confirmed so we are locally
Bearish biased and we will be
Expecting a further bearish
Move down
SHORT🔥
✅Like and subscribe to never miss a new idea!✅
Disclosure: I am part of Trade Nation's Influencer program and receive a monthly fee for using their TradingView charts in my analysis.

GBP-CHF Risky Long! Buy!
Hello,Traders!
GBP-CHF will soon hit
A wide horizontal support
Level around 1.1048 and
After the retest a local
Bullish rebound and a move
Up are to be expected
Buy!
Comment and subscribe to help us grow!
Check out other forecasts below too!
Disclosure: I am part of Trade Nation's Influencer program and receive a monthly fee for using their TradingView charts in my analysis.

USD_CHF WILL GROW|LONG|
✅USD_CHF is falling down
And will soon retest
A horizontal demand level of 0.8190
So I think that we will see a rebound
And a move up from the level
Towards the target above at 0.8253
LONG🚀
✅Like and subscribe to never miss a new idea!✅
Disclosure: I am part of Trade Nation's Influencer program and receive a monthly fee for using their TradingView charts in my analysis.

CAD-CHF Bearish Wedge! Sell!
Hello,Traders!
CAD-CHF formed a bearish
Wedge pattern and now we
Are seeing a powerful breakout
Which is confirmed so we are
Locally bearish biased and
We will be expecting a
Further bearish move down
Sell!
Comment and subscribe to help us grow!
Check out other forecasts below too!
Disclosure: I am part of Trade Nation's Influencer program and receive a monthly fee for using their TradingView charts in my analysis.

CAD_JPY LONG FROM SUPPORT|
✅CAD_JPY has been falling recently
And the pair seems locally oversold
So as the pair is approaching
A horizontal support of 104.200
Price growth is to be expected
LONG🚀
✅Like and subscribe to never miss a new idea!✅
Disclosure: I am part of Trade Nation's Influencer program and receive a monthly fee for using their TradingView charts in my analysis.

GBP-USD Swing Long! Buy!
Hello,Traders!
GBP-USD is trading in an
Uptrend and the pair made
A retest of the horizontal
Support of 1.3419 from where
We are already seeing a
Bullish rebound so we will be
Expecting a further
Bullish move up
Buy!
Comment and subscribe to help us grow!
Check out other forecasts below too!
Disclosure: I am part of Trade Nation's Influencer program and receive a monthly fee for using their TradingView charts in my analysis.

EURJPY: Move Up Ahead! 🇪🇺🇯🇵
EURJPY is going to rise more after breaking
a resistance line of a tiny horizontal consolidation range
that was formed on a retest of a recently broken daily structure.
Goal - 164.8
❤️Please, support my work with like, thank you!❤️
I am part of Trade Nation's Influencer program and receive a monthly fee for using their TradingView charts in my analysis.

GBP_NZD RISKY LONG|
✅GBP_NZD is going down now
But a strong support level is ahead at 2.2520
Thus I am expecting a rebound
And a move up towards the target of 2.2609
LONG🚀
✅Like and subscribe to never miss a new idea!✅
Disclosure: I am part of Trade Nation's Influencer program and receive a monthly fee for using their TradingView charts in my analysis.

EUR-USD Free Signal! Buy!
Hello,Traders!
EUR-USD is going down
And the pair will soon hit
A horizontal support level
Around 1.1270 from where
We will be able to go long
With the Take Profit of 1.1328
And the Stop Loss of 1.1254
Buy!
Comment and subscribe to help us grow!
Check out other forecasts below too!
Disclosure: I am part of Trade Nation's Influencer program and receive a monthly fee for using their TradingView charts in my analysis.

Market next move 🚨 Disruptive Take on the Current Silver-CFD Setup (1 h)
⚠️ Key Issue Why It Undermines the Long-Target Thesis
1. Target looks “wishful” The arrow projects a move into the 33.55–33.60 zone without price ever clearing the nearest resistance band around 33.30–33.35. A premature target can bait traders into chasing the tail end of a relief rally.
2. Volume doesn’t back the bounce Notice how the big green climb out of the pit on the 27 th started on strong volume, but the last 10–12 candles show shrinking green bars. Demand is decaying as price inches higher—a classic recipe for a bull trap.
3. Momentum is stalling The most recent candle printed red right at the dotted mid-line, hinting at exhaustion. Without a fresh momentum kick (e.g., higher high ➜ bullish engulfing), upside continuation is statistically fragile.
4. Structure still favors lower highs The broader pattern since the 25–26 th is a series of lower swing-highs. Until that diagonal is broken decisively, every uptick remains a counter-trend bounce, not a new up-trend.
5. Macro landmine ahead The U.S. flag icon marks an impending data release. Silver’s intraday volatility tends to spike on USD events; any dollar strength could instantly unwind the thin-volume rise. Trading into news with no contingency ≠ smart risk.
6. Stop-loss placement is unclear Without a clearly defined invalidation level (e.g., below 33.00 or under the 27 th swing-low), the R-R profile is lopsided: limited upside room vs. plenty of air underneath.

EUR_AUD WILL GO DOWN|SHORT|
✅EUR_AUD price grew again
To retest the resistance of 1.7640
But it is a strong key level
So I think that there is a high chance
That we will see a bearish move down
SHORT🔥
✅Like and subscribe to never miss a new idea!✅
Disclosure: I am part of Trade Nation's Influencer program and receive a monthly fee for using their TradingView charts in my analysis.

GBP_AUD PULLBACK AHEAD|SHORT|
b]✅GBP_AUD has retested
A resistance level of 2.1036
And we are seeing a bearish reaction
With the price going down so we are
Bearish biased now and we will be
Expecting the pair to go further down
SHORT🔥
✅Like and subscribe to never miss a new idea!✅
Disclosure: I am part of Trade Nation's Influencer program and receive a monthly fee for using their TradingView charts in my analysis.

EUR-AUD Short From Resistance! Sell!
Hello,Traders!
EUR-AUD made a retest
Of the key horizontal
Resistance level of 1.7640
From where we are already
Seeing a bearish pullback so
As we are locally bearish
Biased and we will be
Expecting a further
Bearish move down
Sell!
Comment and subscribe to help us grow!
Check out other forecasts below too!
Disclosure: I am part of Trade Nation's Influencer program and receive a monthly fee for using their TradingView charts in my analysis.

AUD_USD LONG FROM RISING SUPPORT|
✅AUD_USD is trading along
The rising support line
And as the pair will soon retest it
I am expecting the price to go up
To retest the supply levels above 0.6460
LONG🚀
✅Like and subscribe to never miss a new idea!✅
Disclosure: I am part of Trade Nation's Influencer program and receive a monthly fee for using their TradingView charts in my analysis.
