USD_JPY WILL GO DOWN|SHORT|
✅USD_JPY will be retesting a
Resistance level soon around 147.500
From where I am expecting a bearish reaction
With the price going down but we need
To wait for a reversal pattern to form
Before entering the trade, so that we
Get a higher success probability of the trade
SHORT🔥
✅Like and subscribe to never miss a new idea!✅
Disclosure: I am part of Trade Nation's Influencer program and receive a monthly fee for using their TradingView charts in my analysis.
Forex-trading

GBP-USD Support Ahead! Buy!
Hello,Traders!
GBP-USD is trading in an
Uptrend and the pair is
About to retest a horizontal
Support level around 1.3178
From where we will be expecting
A local rebound and a
Further bullish move up
Buy!
Comment and subscribe to help us grow!
Check out other forecasts below too!
Disclosure: I am part of Trade Nation's Influencer program and receive a monthly fee for using their TradingView charts in my analysis.

EUR_USD LOCAL LONG|
✅EUR_USD is going down now
But a strong support level is ahead at 1.1187
Thus I am expecting a rebound
And a move up towards the target of 1.1278
LONG🚀
✅Like and subscribe to never miss a new idea!✅
Disclosure: I am part of Trade Nation's Influencer program and receive a monthly fee for using their TradingView charts in my analysis.

GBP/USD Pressure Mounts on Weak UK DataThe GBP/USD currency pair faced downward pressure on Wednesday, largely due to disappointing data from the UK’s Purchasing Managers Index (PMI). This index showed a contraction in private sector business activity for April, signaling potential challenges in the UK economy. As a result, the Pound Sterling weakened against its major counterparts during European trading hours, reflecting growing concerns among investors about the economic outlook.
As the day progressed, the focus shifted to the US Dollar (USD), which was buoyed by increasing optimism regarding easing tensions between the United States and China. Investors reacted positively to news surrounding potential diplomatic efforts and economic collaborations, leading to a stronger USD and further pulling the GBP/USD pair lower. This shift in sentiment highlights how geopolitical developments can significantly impact currency markets.
Interestingly, the price action in the GBP/USD pair reached a notable Weekly Supply zone. This area has historically acted as a resistance level, and despite the current bearish trend, many retailers remain bullish on the Pound. This divergence in sentiment suggests that traders are closely monitoring the situation for signs of a reversal. Given the current conditions, there is speculation that the pair could experience a turnaround as it interacts with this important price level.
Overall, the dynamics between the GBP and USD underscore the ongoing volatility in the foreign exchange market, driven by economic data and geopolitical events. Moving forward, market participants will likely keep a close eye on upcoming indicators and developments that could influence the trajectory of this currency pair, particularly in light of the recent fluctuations and the current positioning within the Weekly Supply zone.
Weekly chart 6B1!
✅ Please share your thoughts about GBP/USD in the comments section below and HIT LIKE if you appreciate my analysis. Don't forget to FOLLOW ME; you will help us a lot with this small contribution.

NZD/USD Climbs on US-China Optimism and RBNZ Rate Cut ExpectatioNZD/USD Climbs on US-China Optimism and RBNZ Rate Cut Expectations
The NZD/USD currency pair edged higher during European trading hours on Thursday, recovering from two consecutive sessions of losses. Trading near 0.5982, the pair benefited from renewed optimism surrounding potential US-China trade negotiations, a key factor given New Zealand's strong economic ties with China.
This resurgence in the Kiwi dollar (NZD) contrasts with the broader trend of recent days. The previous decline was likely fueled by concerns over global economic growth and the impending interest rate decisions from central banks across the globe. The pair's upward movement now suggests a shift in sentiment, with investors recognizing the potential positive impact of a potential trade thaw.
Crucially, expectations surrounding the Reserve Bank of New Zealand's (RBNZ) upcoming May meeting are also playing a significant role. Markets are overwhelmingly pricing in a 25 basis-point cut to the Official Cash Rate (OCR) from its current 3.5%. Furthermore, there's a growing expectation of further easing to 2.75% by the year-end. This anticipated easing of monetary policy in New Zealand is providing substantial support to the NZD, adding another bullish element to the current trading environment.
From a technical perspective, the price action around the crucial 0.5980 level highlights the interplay of fundamental and technical factors. While the price has reached a weekly supply zone, the confluence of optimistic trade sentiment and the expected OCR cut is currently outpacing any bearish technical indicators.
However, a sustained move above the significant resistance of the 0.6000 level is critical to confirming the renewed bullish momentum. A break above this psychological barrier would signal further strength in the Kiwi dollar, whereas a reversal below 0.5980 would bring the previously discussed bearish factors back into the forefront.
Looking ahead, the key to future direction for the NZD/USD will likely depend on the outcome of the US-China trade negotiations and any potential further developments regarding the RBNZ's interest rate decisions. Markets will be watching closely for any tangible progress in either area, as this will likely dictate the pair's trajectory.
✅ Please share your thoughts about NZD/USD in the comments section below and HIT LIKE if you appreciate my analysis. Don't forget to FOLLOW ME; you will help us a lot with this small contribution.

AUD/USD Inflation Data Crucial for RBA Decision. Key Supply ZoneThe AUD/USD exchange rate is approaching a key supply zone on the weekly chart, a region where significant long positions are concentrated. This presents a potential reversal point for the currency pair. Adding to the market's focus is the imminent release of Australia's inflation data on Wednesday. This report will be crucial in shaping expectations for the Reserve Bank of Australia's (RBA) next policy move. Market forecasts generally point towards a 25-basis-point interest rate cut in May, a decision likely driven by concerns over the potential economic fallout from recently imposed US tariffs. The upcoming inflation data will be closely scrutinized to confirm or challenge these anticipated policy adjustments. The confluence of technical analysis (the supply zone) and macroeconomic factors (the inflation report and RBA considerations) makes this a potentially pivotal week for AUD/USD.
✅ Please share your thoughts about AUD/USD in the comments section below and HIT LIKE if you appreciate my analysis. Don't forget to FOLLOW ME; you will help us a lot with this small contribution.

GBP_AUD RESISTANCE AHEAD|SHORT|
✅GBP_AUD surged again
To retest the resistance of 2.0769
But it is a strong key level
So I think that there is a high chance
That we will see a bearish pullback and a move down
SHORT🔥
✅Like and subscribe to never miss a new idea!✅
Disclosure: I am part of Trade Nation's Influencer program and receive a monthly fee for using their TradingView charts in my analysis.

EUR-USD Support Cluster! Buy!
Hello,Traders!
EUR-USD is trading in an
Uptrend and the pair is
About to retest a support
Cluster of the rising and
Horizontal support lines
Around 1.1257 so after
The retest we will be
Expecting a local bullish
Rebound and a move up
Buy!
Comment and subscribe to help us grow!
Check out other forecasts below too!
Disclosure: I am part of Trade Nation's Influencer program and receive a monthly fee for using their TradingView charts in my analysis.

AUD-CHF Bearish Wedge Pattern! Sell!
Hello,Traders!
AUD-CHF has formed a
Bearish wedge pattern
And the pair is now trying
To make a bearish breakout
So IF the breakout is confirmed
We will be expecting a
Local bearish move down
Sell!
Comment and subscribe to help us grow!
Check out other forecasts below too!
Disclosure: I am part of Trade Nation's Influencer program and receive a monthly fee for using their TradingView charts in my analysis.

EUR_CHF BULLISH FLAG BREAKOUT|LONG|
✅EUR_CHF is trading in a
Local uptrend and the pair
Broke out of the bullish flag
Pattern so we are bullish
Biased now and we will be
Expecting a further local
Bullish move up
LONG🚀
✅Like and subscribe to never miss a new idea!✅
Disclosure: I am part of Trade Nation's Influencer program and receive a monthly fee for using their TradingView charts in my analysis.

NZD_USD LOCAL PULLBACK AHEAD|SHORT|
✅NZD_USD will soon retest a key resistance level of 0.6036
So I think that the pair will make a pullback
And go down to retest the demand level below at 0.6000
SHORT🔥
✅Like and subscribe to never miss a new idea!✅
Disclosure: I am part of Trade Nation's Influencer program and receive a monthly fee for using their TradingView charts in my analysis.

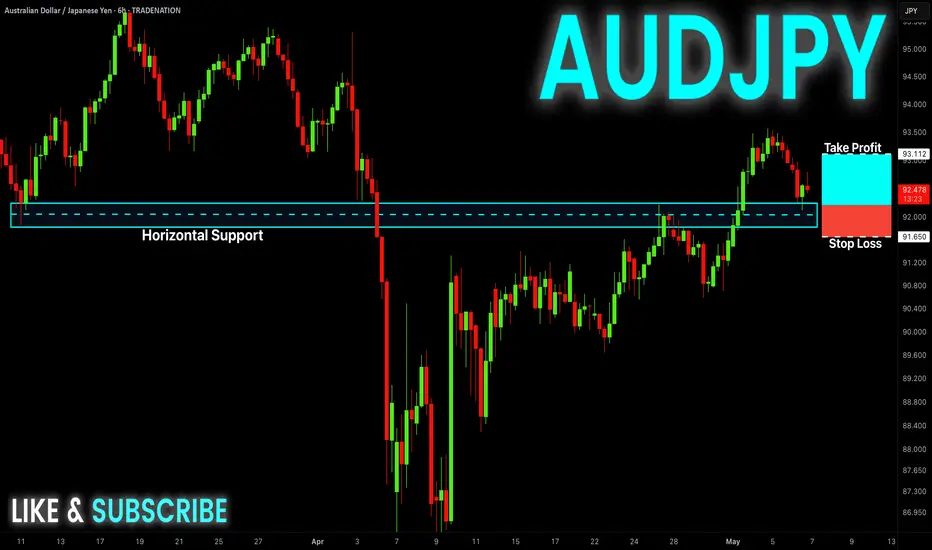
AUD-JPY Free Signal! Buy!
Hello,Traders!
AUD-JPY is trading in an
Uptrend so we are bullish
Biased and as the pair is
Retesting a horizontal
Support level around 92.000
We can go long with the
Take Profit of 93.112 and
The Stop Loss of 91.650
Buy!
Comment and subscribe to help us grow!
Check out other forecasts below too!
Disclosure: I am part of Trade Nation's Influencer program and receive a monthly fee for using their TradingView charts in my analysis.
USD-JPY Local Long! Buy!
Hello,Traders!
USD-JPY has fallen down
Sharply and the pair is
Locally oversold so after
It hits the horizontal support
Of 141.800 a local bullish
Correction is to be expected
Buy!
Comment and subscribe to help us grow!
Check out other forecasts below too!
Disclosure: I am part of Trade Nation's Influencer program and receive a monthly fee for using their TradingView charts in my analysis.

AUD_USD WILL KEEP GROWING|LONG|
✅AUD_USD is trading in an
Uptrend and the pair made a
Bullish breakout of the key
Horizontal level of 0.6450
And the breakout
Is confirmed so as the pair keeps
Growing we will be expecting a
Further bullish move up
LONG🚀
✅Like and subscribe to never miss a new idea!✅
Disclosure: I am part of Trade Nation's Influencer program and receive a monthly fee for using their TradingView charts in my analysis.

NZD-USD Short From Resistance! Sell!
Hello,Traders!
NZD-USD keeps growing
In an uptrend but the pair
Will soon hit a horizontal
Resistance of 0.6029 from
Where we will be expecting
A local bearish pullback
And a further move down
Sell!
Comment and subscribe to help us grow!
Check out other forecasts below too!
Disclosure: I am part of Trade Nation's Influencer program and receive a monthly fee for using their TradingView charts in my analysis.

EurCad = ascending channel + symmetrical triangleHere we have something that to me looks like a combination of a symmetrical triangle and an up ascending channel. It is currently evolving within, and I think it will continue to do it a bit more, especially now that is successfully broke above the symmetrical triangle. It might look like it already has broken out prior, but it wasn't fully formed. Nearer the end, it can be seen that price bounced back and forth within the triangle two times, and accurate. Now that it's broken above, I know of a potential idea which is to buy from a pullback into the level marked which I believe is demand zone.
I also think it can be normal for price to be traded as a break below and selling an ascending channel. But I think in this case it is being held up in a stronger format with support from triangle which might guide its meaning to a different turn.

USDJPY: Pullback From Support 🇺🇸🇯🇵
There is a high chance that USDJPY will pull back from the underlined blue support.
AS a confirmation, I see a violation of a resistance line of a falling
wedge pattern on an hourly time frame.
Target - 144.35
❤️Please, support my work with like, thank you!❤️

AUD-JPY Risky Short! Sell!
Hello,Traders!
AUD-JPY went up and hit
A horizontal supply area
Around 93.597 from where
We are already seeing a local
Bearish pullback so we are
Bearish biased and we will
Be expecting a local
Bearish correction
Buy!
Comment and subscribe to help us grow!
Check out other forecasts below too!
Disclosure: I am part of Trade Nation's Influencer program and receive a monthly fee for using their TradingView charts in my analysis.

EUR_GBP WILL FALL|SHORT|
✅EUR_GBP has hit a key structure level of 0.8540
Which implies a high likelihood of a move down
As some market participants will be taking profit from their long positions
While others will find this price level to be good for selling
So as usual we will have a chance to ride the wave of a bearish correction
SHORT🔥
✅Like and subscribe to never miss a new idea!✅
Disclosure: I am part of Trade Nation's Influencer program and receive a monthly fee for using their TradingView charts in my analysis.

CAD_JPY BULLISH REBOUND|LONG|
✅CAD_JPY is going down now
But a strong support level is ahead at 103.888
Thus I am expecting a rebound
And a move up towards the target of 104.400
LONG🚀
✅Like and subscribe to never miss a new idea!✅
Disclosure: I am part of Trade Nation's Influencer program and receive a monthly fee for using their TradingView charts in my analysis.

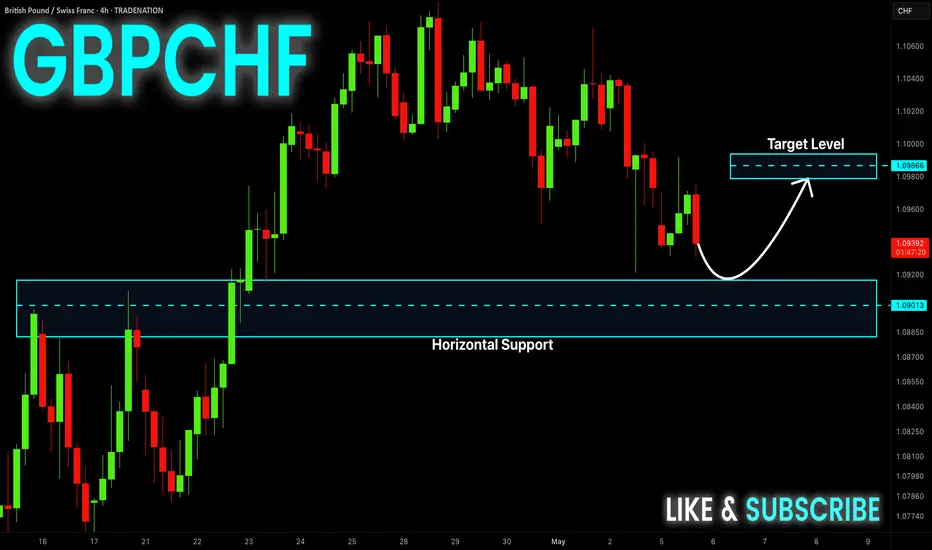
GBP-CHF Local Long! Buy!
Hello,Traders!
GBP-CHF is going down
Now but the pair is close
To the horizontal support
Level of 1.0901 already so
After the retest we will be
Expecting a local bullish rebound
Buy!
Comment and subscribe to help us grow!
Check out other forecasts below too!
Disclosure: I am part of Trade Nation's Influencer program and receive a monthly fee for using their TradingView charts in my analysis.
AudUsd Expanding TriangleAudUsd is making a bullish structure in the more recent timeframes. Based of specific patterns, I'd say this inclines to be an expanding triangle, which price just broke above, and it seems to stay above, after failing to go lower lows near the top. Price broke above, made a retest and I think it is more wise to buy after it made a positive reaction to this well known expanding triangle pattern.

GBP_NZD LONG SIGNAL|
✅GBP_NZD is going down
To retest a horizontal support
Level of 2.2200 so after the
Retest we can enter a long
Trade with the TP of 2.2459
And the SL of 2.2132
LONG🚀
✅Like and subscribe to never miss a new idea!✅
Disclosure: I am part of Trade Nation's Influencer program and receive a monthly fee for using their TradingView charts in my analysis.
