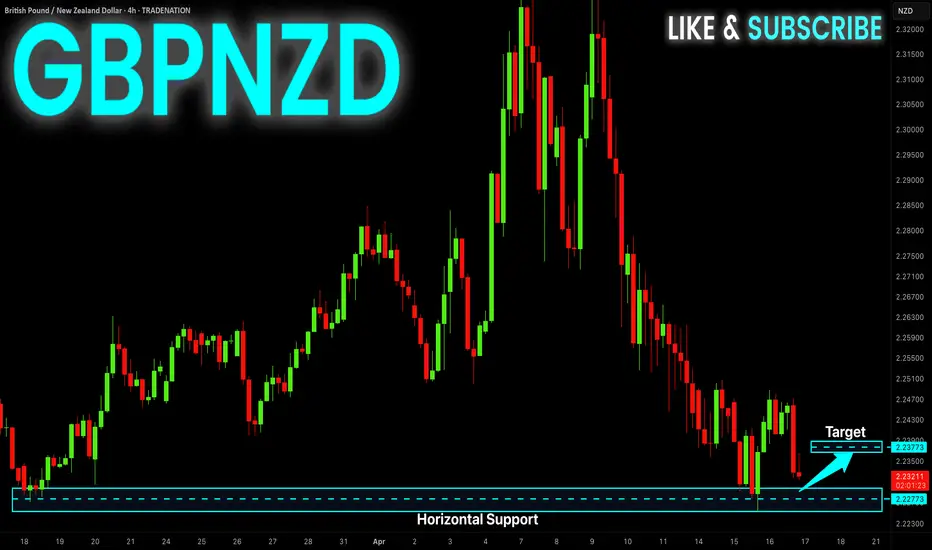
GBP-NZD Local Long! Buy!
Hello,Traders!
GBP-NZD fell down strongly
Through the first line of
Support but a strong support
Was hit around 2.2160 from
Where a local bullish rebound
Is likely to happen on Monday
So we will be able to enter
A long trade with the Take
Profit of 2.2300 and the
Stop Loss of 2.2123
Buy!
Comment and subscribe to help us grow!
Check out other forecasts below too!
Disclosure: I am part of Trade Nation's Influencer program and receive a monthly fee for using their TradingView charts in my analysis.
Forex-trading

EUR-AUD RISKY LONG|
✅EUR_AUD fell again to retest the support of 1.7700
But it is a strong key level
So I think that there is a high chance
We will see a bullish rebound and a move up
LONG🚀
✅Like and subscribe to never miss a new idea!✅
Disclosure: I am part of Trade Nation's Influencer program and receive a monthly fee for using their TradingView charts in my analysis.

EUR-CHF Resistance Ahead! Sell!
Hello,Traders!
EUR-CHF is making a
Bullish rebound now but
The pair will soon hit a
Horizontal resistance of 0.9347
From where we will be expecting
A local bearish pullback
Sell!
Comment and subscribe to help us grow!
Check out other forecasts below too!
Disclosure: I am part of Trade Nation's Influencer program and receive a monthly fee for using their TradingView charts in my analysis.

NZD_USD WILL KEEP GROWING|LONG|
✅NZD_USD is trading in an
Uptrend and the pair made a
Strong bullish breakout of the
Key horizontal level of 0.5927
Which is a support now and the
Breakout is confirmed so we
Will be expecting a further
Bullish continuation
LONG🚀
✅Like and subscribe to never miss a new idea!✅
Disclosure: I am part of Trade Nation's Influencer program and receive a monthly fee for using their TradingView charts in my analysis.

GBP-AUD Bearish Triangle Pattern! Sell!
Hello,Traders!
GBP-AUD has formed a
Bearish triangle pattern
So we are bearish biased
And IF we see a bearish
Breakout then we will be
Expecting a further
Bearish continuation
Sell!
Comment and subscribe to help us grow!
Check out other forecasts below too!
Disclosure: I am part of Trade Nation's Influencer program and receive a monthly fee for using their TradingView charts in my analysis.

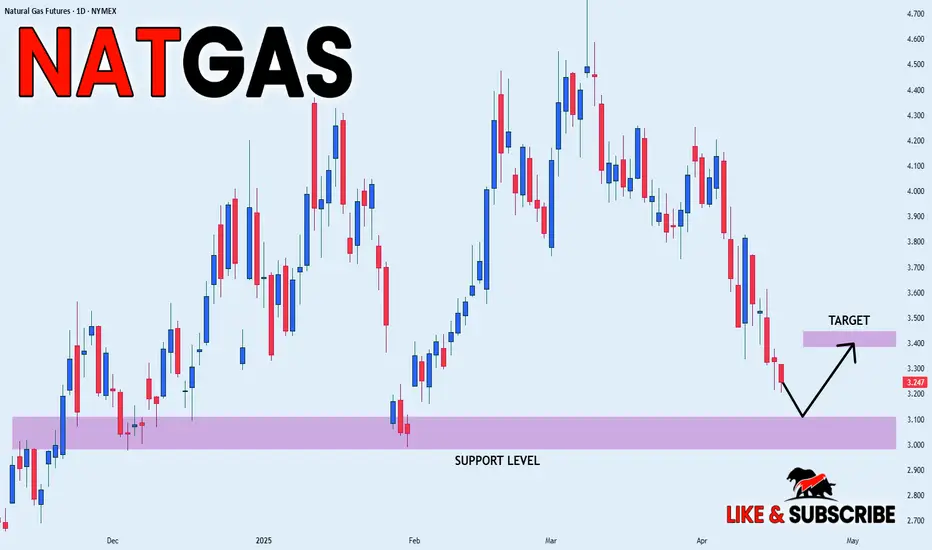
NATGAS Swing Long! Buy!
Hello,Traders!
NATGAS went down after
The support cluster breakout
Just as we predicted in my previous
Analysis but price will soon hit a
Horizontal support level of 3.00$
From where we will be expecting
A local bullish correction
Buy!
Comment and subscribe to help us grow!
Check out other forecasts below too!
Disclosure: I am part of Trade Nation's Influencer program and receive a monthly fee for using their TradingView charts in my analysis.

GBP_USD WILL GO UP|LONG|
✅GBP_USD already made a
Retest of the horizontal support
Of 1.3200 and is making a bullish
Rebound so as the pair is in the
Uptrend we are bullish biased
And we will be expecting the
Pair to go further up
LONG🚀
✅Like and subscribe to never miss a new idea!✅
Disclosure: I am part of Trade Nation's Influencer program and receive a monthly fee for using their TradingView charts in my analysis.

AUD_CAD SHORT SIGNAL|
✅AUD_CAD made a retest
Of the horizontal resistance
Of 0.8880 then established
A beautiful double top pattern
And then broke the local neckline
Around 0.8832 so its a great
Setup for a short trade
With the TP of 0.8778 and
The SL of 0.8887 above the
Resistance upper bound
SHORT🔥
✅Like and subscribe to never miss a new idea!✅
Disclosure: I am part of Trade Nation's Influencer program and receive a monthly fee for using their TradingView charts in my analysis.

GBP-USD Free Signal! Buy!
Hello,Traders!
GBP-USD is trading in an
Uptrend and the pair is
About to retest a horizontal
Support level of 1.3181
From where we will be
Expecting a local rebound
As we are locally bullish biased
So we can enter a long trade
With the Take Profit of 1.3290
And the Stop Loss of 1.3147
Buy!
Comment and subscribe to help us grow!
Check out other forecasts below too!
Disclosure: I am part of Trade Nation's Influencer program and receive a monthly fee for using their TradingView charts in my analysis.

NATGAS SUPPORT AHEAD|LONG|
✅NATGAS is set to retest a
Strong support level below around 3.00$
After trading in a local downtrend from some time
Which makes a bullish rebound a likely scenario
With the target being a local resistance above 3.40$
LONG🚀
✅Like and subscribe to never miss a new idea!✅
Disclosure: I am part of Trade Nation's Influencer program and receive a monthly fee for using their TradingView charts in my analysis.
AUD_JPY LOCAL SHORT|
✅AUD_JPY price went up sharply
But a strong resistance level was hit around 91.500
Thus, as a pullback is already happening
And a move down towards the target of 89.500 shall follow
SHORT🔥
✅Like and subscribe to never miss a new idea!✅
Disclosure: I am part of Trade Nation's Influencer program and receive a monthly fee for using their TradingView charts in my analysis.

GBP-NZD Local Long! Buy!
Hello,Traders!
GBP-NZD is going down
Again to retest the horizontal
Support level of 2.2253 so
After the price hits the level
A local bullish rebound is
To be expected
Buy!
Comment and subscribe to help us grow!
Check out other forecasts below too!
Disclosure: I am part of Trade Nation's Influencer program and receive a monthly fee for using their TradingView charts in my analysis.
Gold Hits New ATH Amid Escalating US–China Tensions📌 Gold Hits New ATH Amid Escalating US–China Tensions: How Far Can It Go? 🧨📈
Gold has reached another all-time high (ATH) as geopolitical tensions between the United States and China intensify. Markets have become incredibly sensitive, reacting sharply to political rhetoric and economic policy shifts from the world’s most powerful leaders.
As investors grow increasingly uneasy, gold continues to serve its role as a safe haven — but the real question now isn't whether gold will rise, but rather: how high can it go?
🌍 Geopolitical Sensitivity at its Peak
A single tariff threat or retaliation can trigger gold to surge by $30–$50.
Conversely, a pause in policy or a diplomatic “cool down” can cause price to drop hundreds of points.
In this environment, political narratives are driving markets more than technical setups.
This is one of those rare moments where fundamentals and news flow completely overshadow traditional chart signals. Even textbook candle confirmations are losing reliability — clean bullish closures are often followed by equally strong bearish rejections.
📊 Key Levels to Watch
Support Zones:
3,280 / 3,268 / 3,258 / 3,240 / 3,230
Resistance Zones:
3,292 / 3,302 / 3,310/ 3330
⚙️ Trading Zones
🔽 Sell Zone:
Entry: 3,330 – 3,332
SL: 3,336
TP: 3,325 → 3,320 → 3,315 → 3,310 → 3,300
📈 Buy Zone #1:
Entry: 3,270 – 3,268
SL: 3,264
TP: 3,274 → 3,278 → 3,282 → 3,286 → 3,290 → 3,300
📈 Buy Zone #2:
Entry: 3,240 – 3,238
SL: 3,234
TP: 3,245 → 3,250 → 3,255 → 3,260 → 3,264 → 3,268 → 3,274 → 3,280 → OPEN
⚠️ Final Thoughts & Risk Advisory
With geopolitical tensions rising and volatility surging, trading gold requires extra caution. Avoid chasing momentum blindly — even strong confirmations can flip without warning.
This is a market driven by emotions, news headlines, and global uncertainty, not just technicals. Always stick to your trading plan, and more importantly: respect your SL/TP at all times.
💬 How are you approaching gold in this macro environment? Share your views below – are you holding long or fading the rallies? 👇👇👇

NZD_JPY SHORT SIGNAL|
✅NZD_JPY went up and
Retested the horizontal
Resistance above around 85.023
So we are locally bearish biased
And we can now take a short
Trade with the TP of 83.645
And the SL of 85.405
SHORT🔥
✅Like and subscribe to never miss a new idea!✅
Disclosure: I am part of Trade Nation's Influencer program and receive a monthly fee for using their TradingView charts in my analysis.

NZD-JPY Will Fall! Sell!
Hello,Traders!
NZD-JPY went up sharply
But then hit a horizontal
Resistance of 85.069
From where we are already
Seeing a bearish pullback
So we will be expecting
A local bearish move down
Sell!
Comment and subscribe to help us grow!
Check out other forecasts below too!
Disclosure: I am part of Trade Nation's Influencer program and receive a monthly fee for using their TradingView charts in my analysis.

AUD-USD BEARISH BIAS|SHORT|
✅AUD_USD will soon retest a key resistance level of 0.6409
So I think that the pair will make a pullback
And go down to retest the demand level below at 0.6318
SHORT🔥
✅Like and subscribe to never miss a new idea!✅
Disclosure: I am part of Trade Nation's Influencer program and receive a monthly fee for using their TradingView charts in my analysis.

EUR-USD Support Ahead! Buy!
Hello,Traders!
EUR-USD is making a bearish
Correction towards the
Horizontal support of 1.1197
So after the retest we will be
Expecting a bullish continuation
Buy!
Comment and subscribe to help us grow!
Check out other forecasts below too!
Disclosure: I am part of Trade Nation's Influencer program and receive a monthly fee for using their TradingView charts in my analysis.

CAD JPY Entry Setup 1 hour timeframe On the 1 hour timeframe CAD JPY has formed a demand level around price 102.000.
Now we wait for price to drop into the demand level before looking for buying opportunities
Entry will be base on candlestick confirmation.

USOIL Chart Overview:
WTI Crude is trading around 61.44, consolidating inside a key resistance zone near62.00. After a strong bullish impulse, price has stalled under this resistance, forming both bullish and bearish paths, highlighting a conflicting market structure
Key Discrepations Identified:
1. Bullish Momentum vs. Resistance Reaction
- Expected: Continuation to 64+ after breakout.
- Reality: Price is struggling below resistance, rejecting upper boundary multiple times.
- Discrepation: Bullish momentum is slowing, and repeated rejections are exposing potential reversal pressure.
2. Volume Strength vs. Breakout Potential
- Volume d…
- Visually this implies strength, but price is hovering in indecision, neither breaking up nor down convincingly.
- Discrepation: Chart setup shows both bullish continuation and bearish breakdown possibilities, confusing structure
4. Double Scenario Projection
- The projection shows both:
- A bullish breakout to 64.
- A rejection and selloff to 58.
- Discrepation: Market is giving mixed technical signals, suggesting traders should wait for confirmation before committing
Discrepation Summary Table:
| Element | Expectation | Observed Reality | Discrepation | Projection Conflict | Clear trend continuation | Dual projection shown | Market indecision + low conviction |
📉 Conclusion:
While WTI remains inside a short-term bullish structure, the presence of conflicting breakout signals, resistance rejections, and declining volume point toward a discrepation. Traders should watch the 62.00 resistance zone closely. A clear rejection or breakout will resolve this divergence, with downside targeting 58.00, and upside toward $64.00.
Let me know if you'd like a summarized version for a caption or post!

SILVER SHORT FROM STRONG RESISTANCE|
✅SILVER is going up now
Following the market-wide
Bullish rebound on most assets
But a strong wide resistance
Level is ahead around 33.00$
Thus I am expecting a pullback
And a move down towards
The local target of 31.75$
SHORT🔥
✅Like and subscribe to never miss a new idea!✅
Disclosure: I am part of Trade Nation's Influencer program and receive a monthly fee for using their TradingView charts in my analysis.

EUR_USD SWING LONG|
✅EUR_USD made a strong
Breakout of the massive wide
Key horizontal level of 1.1235
Which is now a support and
As the breakout is confirmed
And the pair is in a strong
Uptrend our bullish bias is
Confirmed and we will be
Expecting further growth
On Monday
LONG🚀
✅Like and subscribe to never miss a new idea!✅
Disclosure: I am part of Trade Nation's Influencer program and receive a monthly fee for using their TradingView charts in my analysis.

EUR_CAD LOCAL REBOUND COMING|LONG|
✅EUR_CAD is trading in
A strong uptrend and the pair
Made a local correction on Friday
To retest the local horizontal
Support level of 1.5700 so
A bullish continuation is to
Be expected but a small
Lot size use is advised
LONG🚀
✅Like and subscribe to never miss a new idea!✅
Disclosure: I am part of Trade Nation's Influencer program and receive a monthly fee for using their TradingView charts in my analysis.

EUR-CHF Local Bullish Bias! Buy!
Hello,Traders!
EUR-CHF has hit a horizontal
Demand level abound 0.9202
And we are already seeing a
Local bullish rebound so
Despite this being a counter
Trend long, we will still be
Expecting a local bullish
Correction on Monday
Because the pair seems to
Be oversold, however, we
Would suggest using small
Lot size due to how risky and
Volatile the market has been
These last few weeks
Buy!
Comment and subscribe to help us grow!
Check out other forecasts below too!
Disclosure: I am part of Trade Nation's Influencer program and receive a monthly fee for using their TradingView charts in my analysis.
