EUR_CHF SUPPORT AHEAD|LONG|
✅EUR_CHF is about to retest a key structure level of 0.9204
Which implies a high likelihood of a move up
As some market participants will be taking profit from short positions
While others will find this price level to be good for buying
So as usual we will have a chance to ride the wave of a bullish correction
LONG🚀
✅Like and subscribe to never miss a new idea!✅
Forex-trading

EUR-USD Will Keep Growing! Buy!
Hello,Traders!
EUR-USD is trading in a
Strong uptrend and the pair
Made a strong bullish breakout
Of key horizontal level of 1.1245
Which is now a support and
As the breakout is confirmed
Which is only reinforces our
Bullish bias we will be
Expecting a further bullish
Move up towards the
Target of 1.1507
Buy!
Comment and subscribe to help us grow!
Check out other forecasts below too!
Disclosure: I am part of Trade Nation's Influencer program and receive a monthly fee for using their TradingView charts in my analysis.

USD-CAD Swing Long! Buy!
Hello,Traders!
USD-CAD fell sharply to
Retest a horizontal support
Level of 1.3855 and as it is
A strong horizontal demand
Are we will be expecting a
Bullish correction on Monday
Buy!
Comment and subscribe to help us grow!
Check out other forecasts below too!
Disclosure: I am part of Trade Nation's Influencer program and receive a monthly fee for using their TradingView charts in my analysis.

USD_JPY WILL FALL|SHORT|
✅USD_JPY is already making
A bearish pullback from the horizontal
Resistance of 144.500 while trading
In a downtrend so we are bearish
Biased and we will be expecting
A further bearish move down
SHORT🔥
✅Like and subscribe to never miss a new idea!✅
Disclosure: I am part of Trade Nation's Influencer program and receive a monthly fee for using their TradingView charts in my analysis.

EUR-NZD Bullish Bias! Buy!
Hello,Traders!
EUR-NZD is approaching a
Wide horizontal support
Level of 1.9240 so as the
Pair is trading in a local
Uptrend we will be expecting
A local bullish rebound
After the pair retests the
Support on Monday
Buy!
Comment and subscribe to help us grow!
Check out other forecasts below too!
Disclosure: I am part of Trade Nation's Influencer program and receive a monthly fee for using their TradingView charts in my analysis.

NZD_USD SHORT FROM SUPPLY AREA|
✅NZD_USD is going up now
But a strong resistance level is ahead at 0.5860
Thus I am expecting a pullback
And a move down towards the target at 0.5790
SHORT🔥
✅Like and subscribe to never miss a new idea!✅
Disclosure: I am part of Trade Nation's Influencer program and receive a monthly fee for using their TradingView charts in my analysis.

USD-JPY Risky Short! Sell!
Hello,Traders!
USD-JPY is trading in a
Downtrend and the pair
Is making a local pullback
But will soon hit a horizontal
Resistance level of 144.700
From where we will be
Expecting a further
Bearish move down
Sell!
Comment and subscribe to help us grow!
Check out other forecasts below too!
Disclosure: I am part of Trade Nation's Influencer program and receive a monthly fee for using their TradingView charts in my analysis.

EUR_NZD LOCAL LONG|
✅EUR_NZD is going down
Now but a local horizontal
Support level is ahead at 1.9300
So after the retest a local
Bullish rebound is to be expected
LONG🚀
✅Like and subscribe to never miss a new idea!✅
Disclosure: I am part of Trade Nation's Influencer program and receive a monthly fee for using their TradingView charts in my analysis.

EUR-GBP Bullish Bias! Buy!
Hello,Traders!
EUR-GBP is trading in a
Strong uptrend and the pair
Made a bullish breakout of
The key horizontal level
Of 0.8623 then surged
Further up and is now
Making a local bearish
Correction so we are
Bullish biased and after
The retest of the new
Support level we will be
Expecting a further
Bullish move up
Buy!
Comment and subscribe to help us grow!
Check out other forecasts below too!
Disclosure: I am part of Trade Nation's Influencer program and receive a monthly fee for using their TradingView charts in my analysis.

AUD_USD BULLISH BREAKOUT|LONG|
✅AUD_USD is going up now
And the pair made a bullish
Breakout of the key horizontal
Level of 0.6200 which is now
A support and the breakout
Is confirmed so we are locally
Bullish biased and we will be
Expecting a further move up
After a potential pullback
LONG🚀
✅Like and subscribe to never miss a new idea!✅
Disclosure: I am part of Trade Nation's Influencer program and receive a monthly fee for using their TradingView charts in my analysis.

NZD-USD Short From Resistance! Sell!
Hello,Traders!
NZD-USD is once again
About to retest a horizontal
Resistance level of 0.5840
Which is a strong supply
Area from where a local
Bearish pullback is to
Be expected
Sell!
Comment and subscribe to help us grow!
Check out other forecasts below too!
Disclosure: I am part of Trade Nation's Influencer program and receive a monthly fee for using their TradingView charts in my analysis.

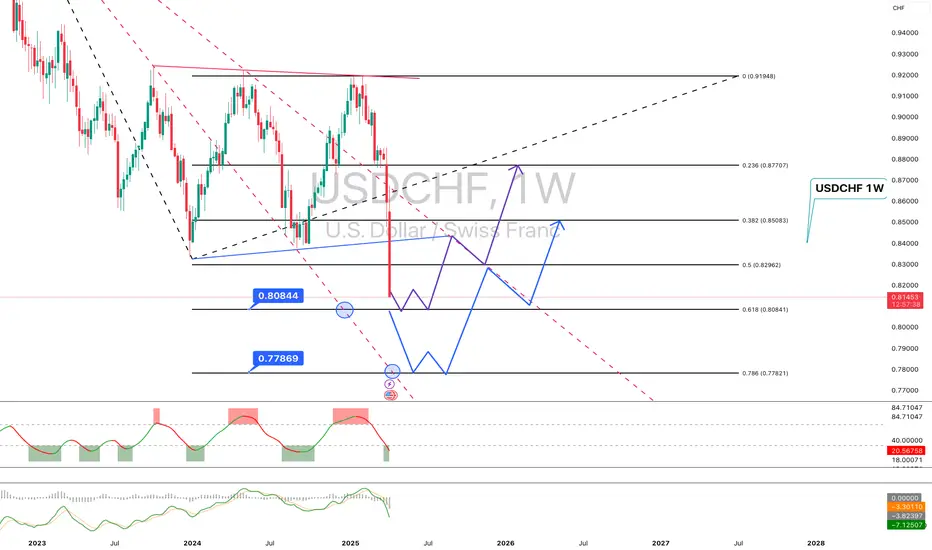
USDCHF (1W) – Preparing for a Potential ReversalThe chart shows strong bearish momentum, but price is approaching a potential demand zone, though it hasn't fully tested it yet. The main focus is on the 0.8080–0.8095 area, aligned with the 0.618 Fibonacci level — a key point where a bounce may occur.
Key Levels:
🔹 Buy Zone #1: 0.8080–0.8095
→ 0.618 Fibonacci, previous consolidation, and a potential reversal point
🔹 Buy Zone #2: 0.7780–0.7800
→ 0.786 Fibonacci, deeper support and lower boundary of the structure
Scenario:
The current structure hints at a possible W-pattern formation after a dip into the demand zone.
If the bullish scenario plays out, potential recovery targets include:
→ 0.8300–0.8500 – initial correction targets
→ 0.8770 – major resistance (Fibo 0.236)
Alternative View:
If price breaks below the 0.7780 level, the structure would shift bearish — next area of interest could form below 0.75.
USDCHF is in a wait-and-watch zone. The downward move continues, but key levels (especially 0.8080 and 0.7780) are worth watching as potential demand zones. There’s a high probability of a technical bounce or reversal setup developing once these zones are tested.
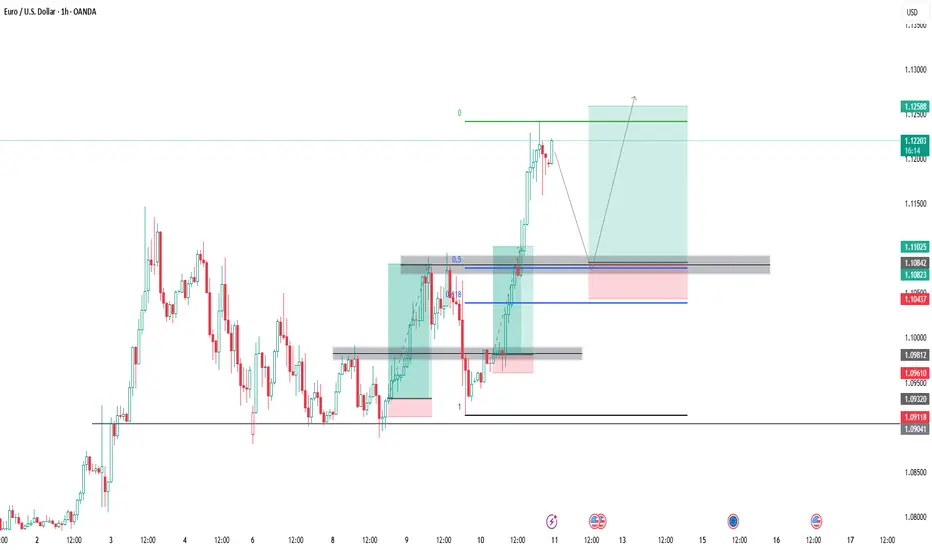
EUR USD Buy Continuation Trade SetupEUR USD has been very bullish so we keep looking for buying opportunities
Here is my idea on EU, bullish structure has been broken now lets wait for a retest then buy along with the trend, the retest level also align with the 0.50 - 0.618 Fib Retracement level
CAD_CHF RISKY LONG|
✅CAD_CHF has retested a key support level of 0.5892
And as the pair is already making a bullish rebound
A move up to retest the supply level above at 0.5949 is likely
LONG🚀
✅Like and subscribe to never miss a new idea!✅
Disclosure: I am part of Trade Nation's Influencer program and receive a monthly fee for using their TradingView charts in my analysis.

EUR-USD Swing Short! Sell!
Hello,Traders!
EUR-USD grew nicely
Today but will soon hit
A horizontal resistance
Level of 1.1279 so after
The retest we will be
Expecting a local bearish
Correction and a move down
Sell!
Comment and subscribe to help us grow!
Check out other forecasts below too!
Disclosure: I am part of Trade Nation's Influencer program and receive a monthly fee for using their TradingView charts in my analysis.

USOIL Oil – April 10, 2025
Price Action & Trend Analysis:
- Current Market Position:
- WTI Crude Oil is showing a bearish trend within a falling wedge pattern, a technical formation that often signals a potential breakout after consolidation. This pattern is visible with converging trendlines (blue), which suggest a potential move to the downside.
- The resistance zone is marked at 61.50, and the price is struggling to break above this level. If it does not break out of this level, further downside momentum may be expected.
Key Levels:
1. Resistance Zone:
- The resistance level is clearly marked near 61.50, and price action has repeatedly struggled to move above this level, showing signs of rejection. A failure to break this l…
ChatGPT: 4. FVG (Fair Value Gap):
- There is a Fair Value Gap (FVG) near 58.12, which indicates a possible area of imbalance where price could potentially retrace to fill the gap before moving in its next direction.
Volume Analysis:
- The volume profile indicates decreasing volume as the price approaches the resistance zone at 61.50, which may suggest a weakening of bullish momentum.
- The increasing volume near the support level at 58.00 suggests that buyers are looking to step in at these levels, but this remains to be seen as the price moves toward this region.
Key Observations:
- The bearish divergence observed between price and momentum suggests that bearish pressure is mounting, especially with the price failing to breach resistance and forming lower highs.
- T

AUD_NZD POTENTIAL SHORT|
✅AUD_NZD is going up now
But a strong resistance level is ahead at 1.094
Thus I am expecting a pullback
And a move down towards the target at 1.086
SHORT🔥
✅Like and subscribe to never miss a new idea!✅
Disclosure: I am part of Trade Nation's Influencer program and receive a monthly fee for using their TradingView charts in my analysis.

NZD_USD SHORT FROM RESISTANCE|
✅NZD_USD will soon retest a key resistance level of 0.5680
So I think that the pair will make a pullback
And go down to retest the demand level of 0.5620 below
SHORT🔥
✅Like and subscribe to never miss a new idea!✅
Disclosure: I am part of Trade Nation's Influencer program and receive a monthly fee for using their TradingView charts in my analysis.

GBP_USD SUPPORT CLUSTER|LONG|
✅GBP_USD is going down
To retest a strong support
Cluster of the rising and
Horizontal support levels
So a local rebound is to be
Expected but its a risky
Setup given the general
Volatility on the market
So use small lot size
LONG🚀
✅Like and subscribe to never miss a new idea!✅
Disclosure: I am part of Trade Nation's Influencer program and receive a monthly fee for using their TradingView charts in my analysis.

BTCUSD ChatGPT: Chart Analysis for Bitcoin (1-Hour Timeframe) – April 08, 2025
Key Observations:
1. Price Action and Trend:
- Bitcoin is in a downtrend, as indicated by the blue descending trendlines, creating lower highs and lower lows.
- The resistance zone is near 80,000, with 79,161 acting as a key level of resistance.
- Price is currently approaching the support level, which is in the range of 75,000 to 77,000, indicating a potential area for price reversal or further decline.
2. Order Block and FVG (Fair Value Gap):
- The order block located near 79,161 to $79,000 is an important zone where price rejected and fell previously. This suggests that sellers have been controlling this level, and it may act as a strong resistance again if the price revisits.
- …
ChatGPT: - As Bitcoin approaches the support level, a surge in volume could indicate a possible breakout or a reversal from the support zone.
4. Target and Potential Movement:
- The target for the current setup is 79,161, near the upper resistance zone, with potential upward momentum from the support area.
- Bitcoin is likely to reach the 79,161 target after bouncing from the support zone. However, if the price fails to break through the resistance, a drop back to the support zone or even further downward movement may occur.
Potential Scenarios:
- Bullish Reversal: If Bitcoin bounces from the support level and breaks above the resistance at 79,161, it may push higher towards 80,000 and beyond. The FVG area will be a critical point to monitor for further upward m…
ChatGPT: Currently, Bitcoin is at a pivotal point, testing support while trying to break through resistance. The next price action will depend on how Bitcoin reacts at these key levels. Traders should keep an eye on 79,161, which could be a crucial turning point for the market direction. If the support holds, a reversal is possible, but failure to maintain the support could lead to further declines.

GBP-USD Strong Breakout! Sell!
Hello,Traders!
GBP-USD made a bearish
Breakout of the key wide horizontal
Level of 1.2851 then made a
Pullback so we are bearish
Biased and a further bearish
Continuation is to be expected
Sell!
Comment and subscribe to help us grow!
Check out other forecasts below too!
Disclosure: I am part of Trade Nation's Influencer program and receive a monthly fee for using their TradingView charts in my analysis.

Gold ChatGPT: Chart Analysis for Gold (XAU/USD) – April 08, 2025 – 1-Hour Timeframe
Key Observations:
1. Trend and Price Action:
- The price of Gold is currently in a downtrend, as indicated by the red trendline showing lower highs and lower lows. The price has recently broken below the previous support level, signaling a continuation of the bearish movement.
- The resistance zone near 3,141.64 remains a significant barrier for any upward movement, while the support level at 2,960.00 is holding the price from falling further.
2. Order Block and FVG (Fair Value Gap):
- The order block located at 3,138.95 to 3,141.64 has been a key area where price rejection occurred. The price approached this area but failed to break above, indicating strong selling pressure. This …
ChatGPT: - The target for the current bearish setup is 3,021, which aligns with the support level near 2,987.47. If the price continues to decline, this target could be reached soon, with further downside movement expected.
- If the price holds at the support level and forms a bullish reversal pattern, it may head back towards the resistance zone. However, until the support level holds, the price is likely to continue the downward trajectory.
4. Volume and Market Sentiment:
- The volume shows a consistent decline, confirming the selling pressure. The recent spikes in volume near the support level suggest that the market is reacting to the critical support area.
- Market sentiment remains bearish, with the price currently below its recent highs and the resistan…
ChatGPT: - Bullish Reversal Scenario: If Gold finds support at 2,960 and forms a bullish pattern (such as a reversal candle or engulfing candle), the price might move towards 3,141.64 again.
Conclusion:
The price of Gold is currently in a downtrend, facing resistance around 3,141.64 and support near 2,960. Traders should watch for price action near these levels to assess the next move. The target of 3,021 is the key level to focus on, and a breakout below this could lead to further downside. If the support level holds, there could be a potential for a bullish rebound towards resistance.

NZDUSD: Support & Resistance Analysis and Key Levels 🇳🇿🇺🇸
Here is my latest structure analysis and
important supports & resistances on NZDUSD.
Support 1: 0.5506 - 0.5538 area
Support 2: 0.5470 - 0.5479 area
Resistance 1: 0.5644 - 0.5683 area
Resistance 2: 0.5796 - 0.5854 area
Consider these structures for pullback/breakout trading.
❤️Please, support my work with like, thank you!❤️
I am part of Trade Nation's Influencer program and receive a monthly fee for using their TradingView charts in my analysis.
