EUR-GBP Swing Short! Sell!
Hello,Traders!
EUR-GBP surged sharply
And is locally overbought
So after the pair hits the
Horizontal resistance
Of 0.8624 we will be
Expecting a local
Bearish correction
Sell!
Comment and subscribe to help us grow!
Check out other forecasts below too!
Disclosure: I am part of Trade Nation's Influencer program and receive a monthly fee for using their TradingView charts in my analysis.
Forex-trading

NZD_USD RISKY LONG|
✅NZD_USD has hit a key structure level of 0.5520
Which implies a high likelihood of a move up
As some market participants will be taking profit from short positions
While others will find this price level to be good for buying
So as usual we will have a chance to ride the wave of a bullish correction
LONG🚀
✅Like and subscribe to never miss a new idea!✅
Disclosure: I am part of Trade Nation's Influencer program and receive a monthly fee for using their TradingView charts in my analysis.
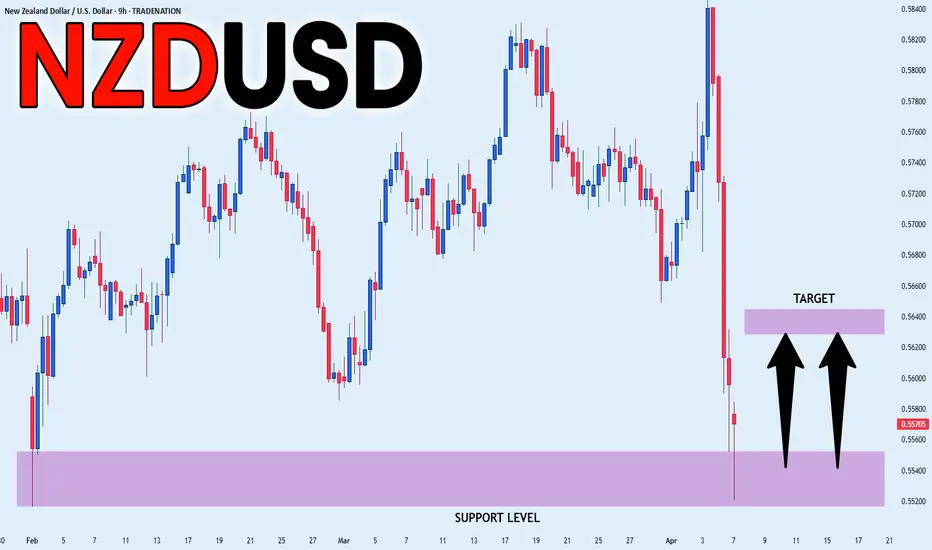
NZD-USD Strong Support Ahead! Buy!
Hello,Traders!
NZD-NZD is approaching a
Horizontal support level
Of 0.5521 so when the
Market opens we will be
Expecting the pair to retest
The support first and then
Make a nice bullish rebound
Buy!
Comment and subscribe to help us grow!
Check out other forecasts below too!
Disclosure: I am part of Trade Nation's Influencer program and receive a monthly fee for using their TradingView charts in my analysis.

GBP_USD LONG SIGNAL|
✅GBP_USD made some crazy
Moves last week and was eventually pushed
Back down to the horizontal support of 1.2874
From where we will be expecting a local
Rebound, therefore we can go long on
The pair with the TP of 1.2946
And the SL of 1.2849
LONG🚀
✅Like and subscribe to never miss a new idea!✅
Disclosure: I am part of Trade Nation's Influencer program and receive a monthly fee for using their TradingView charts in my analysis.

EUR-USD Free Signal! Buy!
Hello,Traders!
EUR-USD made a nice
Bearish correction from the
Resistance above and hit
A horizontal support level
Of 1.0934 from where
We can go long on Monday
With the Take Profit of 1.0996
And the Stop Loss of 1.0906
Buy!
Comment and subscribe to help us grow!
Check out other forecasts below too!
Disclosure: I am part of Trade Nation's Influencer program and receive a monthly fee for using their TradingView charts in my analysis.

AUD-NZD Massive Long! Buy!
Hello,Traders!
AUD-NZD has also fallen
Down by a lot last week
And we think that the
Initial panic move is over
So as the pair is oversold
And is about to retest a
Horizontal support of 1.0740
A strong bullish correction
Is to be expected on Monday
Buy!
Comment and subscribe to help us grow!
Check out other forecasts below too!
Disclosure: I am part of Trade Nation's Influencer program and receive a monthly fee for using their TradingView charts in my analysis.

NATGAS SUPPORT AHEAD|LONG|
✅NATGAS will soon retest a key support level of 3.728$
So I think that the pair will make a rebound
And go up to retest the supply level above at 3.887
LONG🚀
✅Like and subscribe to never miss a new idea!✅
Disclosure: I am part of Trade Nation's Influencer program and receive a monthly fee for using their TradingView charts in my analysis.

USD_CAD SHORT SIGNAL|
✅USD_CAD is going up now
But a strong resistance level is ahead
Thus I am expecting a pullback
And a move down so we can
Enter a short trade with the
TP of 1.4171 and the SL of 1.4280
SHORT🔥
✅Like and subscribe to never miss a new idea!✅
Disclosure: I am part of Trade Nation's Influencer program and receive a monthly fee for using their TradingView charts in my analysis.

AUD_NZD SWING LONG|
✅AUD_NZD is about to retest a key structure level of 1.0750
Which implies a high likelihood of a move up
As some market participants will be taking profit from short positions
While others will find this price level to be good for buying
So as usual we will have a chance to ride the wave of a bullish correction
LONG🚀
✅Like and subscribe to never miss a new idea!✅
Disclosure: I am part of Trade Nation's Influencer program and receive a monthly fee for using their TradingView charts in my analysis.

USD-CAD Short From Resistance! Sell!
Hello,Traders!
USD-CAD went down and
Then up sharply on the
Tariff announcements
And the pair is now approaching
A horizontal resistance of 1.4264
From where we will be
Expecting a local bearish correction
Sell!
Comment and subscribe to help us grow!
Check out other forecasts below too!
Disclosure: I am part of Trade Nation's Influencer program and receive a monthly fee for using their TradingView charts in my analysis.

CAD/SGD SHORT Investment Opportunity
Hello everyone, I am Andrea Russo, a Forex Trader, and today I want to share with you a trading strategy that I am currently following on the CAD/SGD currency pair. This analysis is designed to help traders better understand the dynamics of this pair and optimize their trades.
CAD/SGD SHORT Position Analysis
I decided to enter a SHORT position on CAD/SGD at the level of 0.9460, with a profit target (Take Profit) set at 0.9405 and a stop loss at 0.9479. This setup was chosen after careful technical and fundamental analysis.
Strategy Rationale
Technical Analysis: The chart shows significant resistance around the level of 0.9470, which has rejected the price several times in the past. In addition, momentum indicators suggest a possible downside.
Fundamental Analysis: Recent economic news points to weakness in the Canadian dollar against the Singapore dollar, making this SHORT position particularly attractive.
Risk Management
Risk management is key in any trade. With a stop loss of 0.9479, the risk is well defined and limited. The risk/reward ratio is favorable, with the potential for gains greater than losses.
Trader Tips
Monitor the Market: It is important to follow economic news and events that could affect the CAD or SGD.
Adjust Strategy: If the market moves against the position, consider closing the trade or reviewing the stop loss and take profit levels.
Discipline: Always stick to your trading plan and do not let emotions influence your trading.
Conclusion
This SHORT position on CAD/SGD represents an interesting opportunity for traders looking to take advantage of the current market conditions. Always remember to do your own analysis and trade with caution.
Happy trading everyone! Andrea Russo, Forex Trader

DOLLAR INDEX (DXY): Long-Awaited Recover
It looks like Dollar Index is going to pullback
after a test of a significant support cluster on a daily.
A strong bullish imbalance candle that was formed on an hourly
time frame shows a strong buying interest from that zone.
I expect a bullish movement at least to 102.35
❤️Please, support my work with like, thank you!❤️

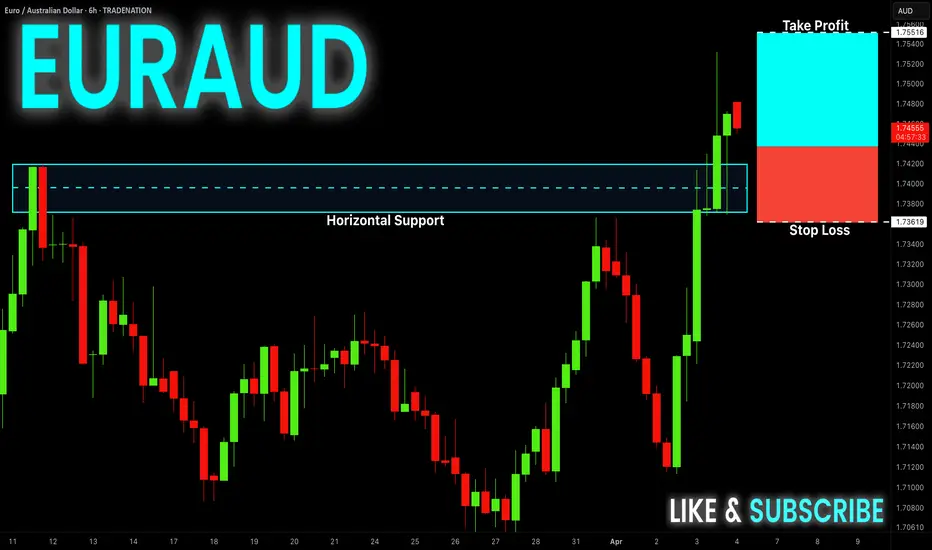
EUR-AUD Free Signal! Buy!
Hello,Traders!
EUR-AUD is trading in a
Strong uptrend and the
Pair made a bullish breakout
And a retest of the key
Horizontal level of 1.7420
And is going up now so
We can enter a long trade
On a local pullback with
The Take Profit of 1.7551
And the Stop Loss of 1.7362
Buy!
Comment and subscribe to help us grow!
Check out other forecasts below too!
Disclosure: I am part of Trade Nation's Influencer program and receive a monthly fee for using their TradingView charts in my analysis.
GBP_NZD LONG FROM RISING SUPPORT|
✅GBP_NZD is trading along
The rising support
And as the pair will soon retest it
I am expecting the price to go up
To retest the supply levels
Above at 2.2659
LONG🚀
✅Like and subscribe to never miss a new idea!✅
Disclosure: I am part of Trade Nation's Influencer program and receive a monthly fee for using their TradingView charts in my analysis.

EUR-GBP Risky Short From Resistance! Sell!
Hello,Traders!
EUR-GBP keeps growing
Sharply after the Trump's
Tariff announcement wrecked
Havoc on the markets
But a strong resistance is
Ahead around 0.8446
From where we will be
Expecting a local
Bearish correction
Sell!
Comment and subscribe to help us grow!
Check out other forecasts below too!
Disclosure: I am part of Trade Nation's Influencer program and receive a monthly fee for using their TradingView charts in my analysis.

EUR_CHF BULLISH BREAKOUT|LONG|
✅EUR_CHF is going up now
And the pair made a bullish
Breakout of the key level
Of 0.9570 which is now a support
And the breakout is confirmed
So we are bullish biased
And after the pullback
We will be expecting a
Further bullish move up
LONG🚀
✅Like and subscribe to never miss a new idea!✅
Disclosure: I am part of Trade Nation's Influencer program and receive a monthly fee for using their TradingView charts in my analysis.

NZD_JPY BEARISH BREAKOUT|SHORT|
✅NZD_JPY is going down
After the bearish breakout
Which reinforces our bearish
Bias and we will be expecting
A further bearish move down
SHORT🔥
✅Like and subscribe to never miss a new idea!✅
Disclosure: I am part of Trade Nation's Influencer program and receive a monthly fee for using their TradingView charts in my analysis.

NZD-CAD Free Signal! Sell!
Hello,Traders!
NZD-CAD made a bearish
Breakout of the key horizontal
Level around 0.8182 so we are
Bearish biased so lets let the
Pair make a pullback and
Retest the lower bound of
The new resistance level
And from there we can go
Short with the Take Profit
Of 0.8136 and the Stop
Loss of 0.8196
Sell!
Comment and subscribe to help us grow!
Check out other forecasts below too!
Disclosure: I am part of Trade Nation's Influencer program and receive a monthly fee for using their TradingView charts in my analysis.

USD_CHF SHORT SIGNAL|
✅USD_CHF is going up now
But a strong resistance level is ahead at 0.8860
Thus I am expecting a pullback
Which means we can enter a
Short trade with the TP of 0.8835
And the SL of 0.8866 but its is a
Risky setup so we recommend to use
A small lot size
SHORT🔥
✅Like and subscribe to never miss a new idea!✅
Disclosure: I am part of Trade Nation's Influencer program and receive a monthly fee for using their TradingView charts in my analysis.

EUR_JPY GROWTH AHEAD|LONG|
✅EUR_JPY has retested a key support level of 160.600
And as the pair is already making a bullish rebound
A move up to retest the supply level above at 163.000 is likely
LONG🚀
✅Like and subscribe to never miss a new idea!✅
Disclosure: I am part of Trade Nation's Influencer program and receive a monthly fee for using their TradingView charts in my analysis.

Earthquake in Myanmar and Safe Haven Currencies
Hello, my name is Andrea Russo and I am a Forex Trader. Today I want to talk to you about the impact of catastrophic events, such as the recent earthquake in Myanmar, on the Forex market, with a particular focus on the role of safe haven currencies. During global crises or unpredictable events, investors tend to seek safety for their capital, moving it towards assets and currencies considered stable. This phenomenon, known as "flight to safety," occurs because markets become highly volatile and uncertain, and the risk of losses increases.
Flight to safety and the importance of safe haven currencies
When dramatic events such as the earthquake in Myanmar occur, global investors prefer to protect their portfolios. This often leads to a strengthening of so-called safe haven currencies, i.e. those currencies perceived as safe and stable. The reason is that these currencies tend to maintain their value or even strengthen in times of crisis, acting as anchors of stability for financial markets.
Top Safe Haven Currencies
Common safe haven currencies include:
Swiss Franc (CHF): Switzerland is known for its economic and political stability. The Swiss Franc is often seen as a “safe haven” during times of instability.
US Dollar (USD): The dollar is considered a safe haven currency due to the strength of the American economy and its status as the global reserve currency.
Japanese Yen (JPY): Despite Japan having a high level of public debt, the yen is seen as a safe haven currency due to the country’s internal stability.
Gold and Other Safe Haven Assets: Although gold and some other commodities are not currencies, they are often considered safe havens and their value indirectly influences currency markets.
Impact of Earthquakes on Currencies and Forex
An event like the Myanmar earthquake tends to cause capital to move into these safe haven currencies for the following reasons:
Local Currency Depreciation: Myanmar’s currency, the Kyat, is coming under pressure due to economic instability and the need for large amounts of capital for reconstruction.
Safe Haven Currencies Rise: As uncertainty increases, currencies like the CHF, USD and JPY strengthen as investors seek refuge.
Market Volatility: Catastrophic events often lead to sudden price movements in major currency pairs, increasing risk while also providing opportunities for experienced Forex traders.
Commodity Impact: If the disaster area is rich in natural resources, commodities may experience price fluctuations, significantly impacting related currencies like the AUD and CAD.
Conclusion
Natural events, like the Myanmar earthquake, are a reminder of how volatile the Forex market can be during times of crisis. Closely monitoring these dynamics is essential to adapt trading strategies and protect your investments. Understanding the role of safe haven currencies in these moments allows you to identify opportunities, reduce risks and maintain portfolio stability.
I hope this article has provided you with a useful overview. If you have any questions or would like further information, do not hesitate to contact me.

GBP_NZD GROWTH AHEAD|LONG|
✅GBP_NZD made a retest
Of the key horizontal level of 2.2600
Which is now a support after a powerful
Breakout so we are bullish biased
And we will be expecting a further
Bullish move up
LONG🚀
✅Like and subscribe to never miss a new idea!✅
Disclosure: I am part of Trade Nation's Influencer program and receive a monthly fee for using their TradingView charts in my analysis.

NZD-CHF Free Signal! Sell!
Hello,Traders!
NZD-CHF is going down
And the pair made a bearish
Breakout and it is confirmed
So we are bearish biased
And we can enter a short
Trade with the Take Profit
Of 0.5018 and the Stop
Loss of 0.5060
Sell!
Comment and subscribe to help us grow!
Check out other forecasts below too!
Disclosure: I am part of Trade Nation's Influencer program and receive a monthly fee for using their TradingView charts in my analysis.
