EUR_CHF LONG SIGNAL|
✅EUR_CHF made a retest
Of the horizontal support level
Of 0.9500 and we are already
Seeing a bullish rebound so
We can enter a long trade
With the TP of 0.9567
And the SL of 0.9488
LONG🚀
✅Like and subscribe to never miss a new idea!✅
Disclosure: I am part of Trade Nation's Influencer program and receive a monthly fee for using their TradingView charts in my analysis.
Forex-trading

AUD-NZD Local Correction Ahead! Sell!
Hello,Traders!
AUD-NZD is already making
A pullback form a horizontal
Resistance of 1.1020 so we
Are locally bearish biased and
We will be expecting a further
Local bearish correction
Sell!
Comment and subscribe to help us grow!
Check out other forecasts below too!
Disclosure: I am part of Trade Nation's Influencer program and receive a monthly fee for using their TradingView charts in my analysis.

NZD_JPY WILL GO UP|LONG|
✅NZD_JPY made a bearish
Correction and will soon hit
A horizontal support level
Of 85.200 and as it is a strong
Wide support level we will be
Expecting a local bullish rebound
LONG🚀
✅Like and subscribe to never miss a new idea!✅
Disclosure: I am part of Trade Nation's Influencer program and receive a monthly fee for using their TradingView charts in my analysis.

GBP-NZD Free Signal! Buy!
Hello,Traders!
GBP-NZD is trading in an
Uptrend and the pair made
A bullish breakout of the
Key horizontal level of 2.2600
Which is now a support then
Made a retest and we are now
Seeing a bullish rebound
Already which reinforces our
Bullish bias on the pair and
Suggests that we enter
A long trade with the
Take Profit of 2.2715
And the Stop Loss of 2.2568
Buy!
Comment and subscribe to help us grow!
Check out other forecasts below too!
Disclosure: I am part of Trade Nation's Influencer program and receive a monthly fee for using their TradingView charts in my analysis.

GBP_AUD SHORT SIGNAL|
✅GBP_AUD keeps growing
In a strong uptrend but
The pair will soon hit a
Horizontal resistance
Of 2.0620 from where
We can enter a counter-trend
(and therefore a riskier) short
Trade with the TP of 2.0532
And the SL of 2.0653
SHORT🔥
✅Like and subscribe to never miss a new idea!✅
Disclosure: I am part of Trade Nation's Influencer program and receive a monthly fee for using their TradingView charts in my analysis.

EUR/NZD 4H AnalysisEUR/NZD 4H Analysis
The pair is breaking above trendline resistance, targeting 1.8939–1.9168.
Support: 1.8807
Resistance: 1.8939 | 1.9060 | 1.9168
A retest of 1.8884 may confirm bullish continuation.

CAD_CHF BEARISH WEDGE PATTERN|SHORT|
✅CAD_CHF made a retest of
The horizontal resistance
Of 0.6213 which makes us
Locally bearish biased and
On top that we are seeing a
Fully formed bearish wedge
Pattern so IF we see a bearish
Breakout from the wedge
Pattern we will be expecting
A further bearish move down
SHORT🔥
✅Like and subscribe to never miss a new idea!✅
Disclosure: I am part of Trade Nation's Influencer program and receive a monthly fee for using their TradingView charts in my analysis.

GBP_CHF LONG SIGNAL|
✅GBP_CHF is trading in an uptrend
Along the rising support line
Which makes me bullish biased
And the pair is about to retest the rising support
Thus, a rebound and a move up is expected
So we can enter a long trade with
The TP of 1.1410 and SL of 1.1350
LONG🚀
✅Like and subscribe to never miss a new idea!✅
Disclosure: I am part of Trade Nation's Influencer program and receive a monthly fee for using their TradingView charts in my analysis.

USD-CHF Local Short Form Resistance! Sell!
Hello,Traders!
USD-CHF is trading in a
Kind of range consolidating
For a next big move but
Right now we can use the
Moment to trade the local
Range and to short the pair
From the horizontal resistance
Of 0.8855
Sell!
Comment and subscribe to help us grow!
Check out other forecasts below too!
Disclosure: I am part of Trade Nation's Influencer program and receive a monthly fee for using their TradingView charts in my analysis.

UK100 Technical Analysis 🔹 Trend Overview:
UK100 is currently consolidating between key support and resistance levels, suggesting a potential breakout scenario.
🔹 Key Levels:
📈 Resistance: 8,727 – A breakout above this level could push price toward 8,818.
📉 Support: 8,627 – If broken, price may drop toward 8,475.
🔹 Market Structure:
✅ Price is in a range-bound phase, with a possible breakout in either direction.
🚀 Bullish scenario: Break above 8,727 → Retest → Target 8,818 → 8,912.
⚠️ Bearish scenario: Rejection at 8,727 → Drop to 8,627 → Break → Target 8,475.
🔹 Trade Idea:
Bullish above 8,727 with targets at 8,818 and 8,912.
Bearish below 8,627 with targets at 8,475.
📌 Risk Management: Wait for confirmation of breakout or rejection before entering trades.

CAD-CHF Free Signal! Sell!
Hello,Traders!
CAD-CHF has made some
Gains from the recent lows
Just as we expected but now
The pair is entering the
Horizontal resistance area
Around 0.6212 from where
We can enter a short trade
With the Take Profit of 0.6162
And the Stop Loss of 0.6233
Buy!
Comment and subscribe to help us grow!
Check out other forecasts below too!
Disclosure: I am part of Trade Nation's Influencer program and receive a monthly fee for using their TradingView charts in my analysis.

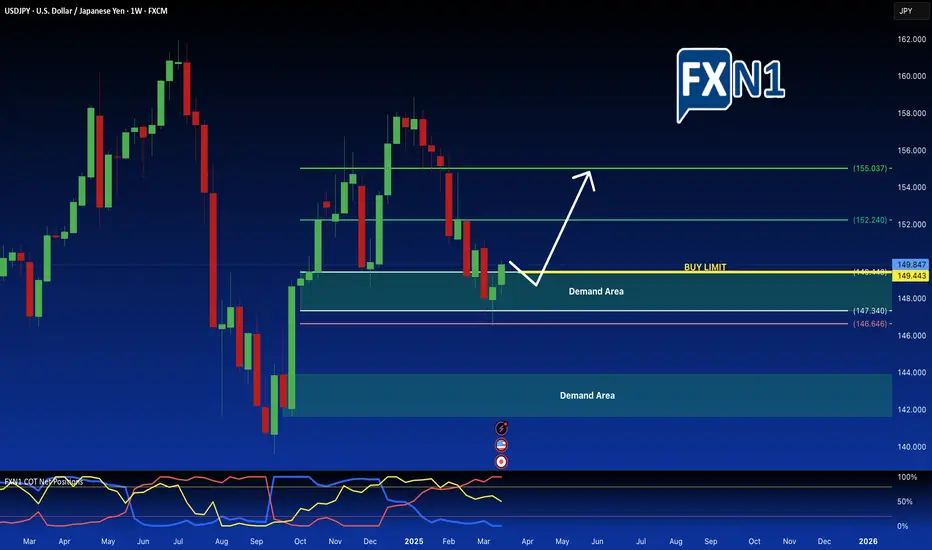
USD/JPY: Long Opportunity at Weekly Demand ZoneThe USD/JPY currency pair is currently pulling back into a significant weekly demand area, presenting a promising opportunity for traders looking to enter long positions. This area historically denotes strong buying interest, suggesting potential upward momentum.
In contrast, the 6J1! Yen futures market displays a bearish sentiment, with many retail traders positioning against this bullish signal in USD/JPY. This divergence in market sentiment could create unique trading opportunities for those who can effectively interpret technical indicators and retail positioning.
Yen Futures
To capitalize on this potential rebound, a pending order has been set on the CFD for USD/JPY, with a buy limit positioned just above the demand zone. Effective risk management, including a stop-loss just below the demand area, is essential as traders navigate this evolving landscape.
In summary, the combination of strong demand at critical levels and contrasting sentiment in the futures market presents a strategic trading scenario for bullish plays in USD/JPY.
✅ Please share your thoughts about USD/JPY in the comments section below and HIT LIKE if you appreciate my analysis. Don't forget to FOLLOW ME; you will help us a lot with this small contribution.
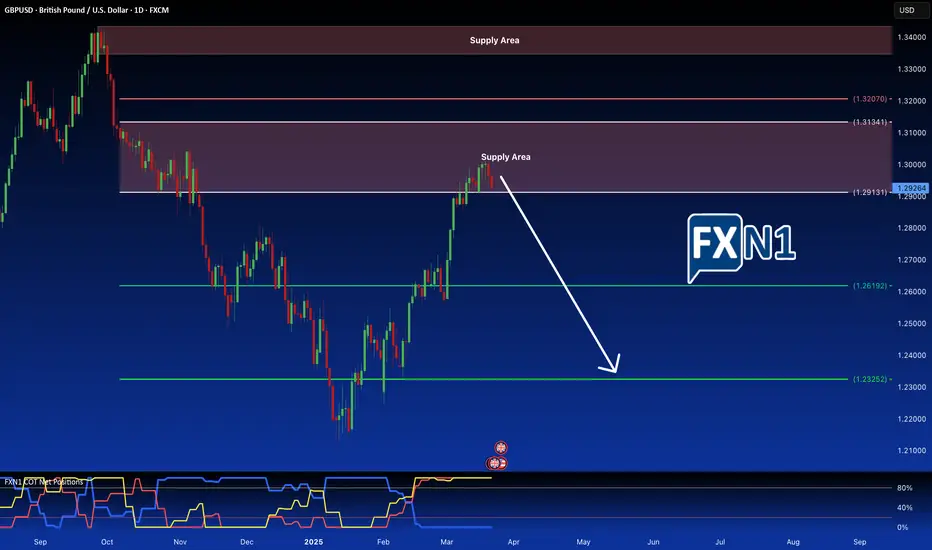
GBP/USD: Technical Signals Point to Potential Bearish ReversalIn the early stages of the European session on Friday, GBP/USD is struggling to maintain its footing, trading below the 1.2925 mark as I compose this article. The pair faces pressure from a robust demand for the US dollar amid a backdrop of cautiousness from the Federal Reserve and prevailing economic uncertainties. This selling pressure persists despite the Bank of England's recent hawkish stance.
As market participants await insights from Federal Reserve officials as well as a speech from US President Trump in the Oval Office, attention is heightened. From a technical perspective, the currency pair has entered a supply zone, prompting expectations for a potential reversal and the commencement of a bearish trend.
✅ Please share your thoughts about GBP/USD in the comments section below and HIT LIKE if you appreciate my analysis. Don't forget to FOLLOW ME; you will help us a lot with this small contribution.
GBPUSD Sell Trade March 26 2025- Sell Limit ActivatedHello Traders!
Another great movement of GBPUSD, 1H and 15min TF confluence.
Entry: 5min TF with validity of OB (check charts for detailed annotation)
Note: This trade was a sell limit order in MT4 aiming for 1:5RR. You can see also Distribution Schematics in Higher Timeframe.
#wyckoff
#proptrader
#Riskmanagement

NZD-CAD Risky Long! Buy!
Hello,Traders!
NZD-CAD made a retest
Of the horizontal support
Of 0.8170 and we are already
Seeing a bullish rebound
So we are bullish biased
And we will be expecting
A further bullish move up
Buy!
Comment and subscribe to help us grow!
Check out other forecasts below too!
Disclosure: I am part of Trade Nation's Influencer program and receive a monthly fee for using their TradingView charts in my analysis.

AUD-CAD Bearish Breakout! Sell!
Hello,Traders!
AUD-CAD made a bearish
Breakout of the key horizontal
Level of 0.9022 which is now
A resistance and the breakout
Is confirmed so we are bearish
Biased and we will be expecting
A further move down
Sell!
Comment and subscribe to help us grow!
Check out other forecasts below too!
Disclosure: I am part of Trade Nation's Influencer program and receive a monthly fee for using their TradingView charts in my analysis.

AUD_CAD SHORT SIGNAL|
✅AUD_CAD is going down
And the pair made a bearish
Breakout of the key horizontal
Level of 0.9007 which is now
A resistance so we are bearish
Biased and we will be able
To enter a short trade on Monday
With the TP of 0.8970 and
The SL of 0.9030
SHORT🔥
✅Like and subscribe to never miss a new idea!✅
Disclosure: I am part of Trade Nation's Influencer program and receive a monthly fee for using their TradingView charts in my analysis.

USDCHF: Bullish Outlook Explained 🇺🇸🇨🇭
USDCHF looks bullish after a test of the underlined blue support.
The price formed a double bottom on that and broke its neckline
on Friday.
We see a positive bullish reaction to that after its retest.
I think that the market will continue rising and reach
at least 0.885 resistance.
❤️Please, support my work with like, thank you!❤️
I am part of Trade Nation's Influencer program and receive a monthly fee for using their TradingView charts in my analysis.

EUR | USD THE DOLLAR SHAKES, THE EURO DANCES with PipGuardEUR | USD THE DOLLAR SHAKES, THE EURO DANCES with PipGuard
IF YOU LIKE MY ANALYSIS, CONGRATS, YOU’RE SMART.
NOW HIT THAT FOLLOW BUTTON, DROP A BOOST, AND LEAVE A COMMENT.
Come on, don’t be shy, those buttons won’t wear out. Support free and independent analysis, because if you want me to keep dropping these market gems, you gotta show some love. Otherwise, you’ll see me opening a shaved ice stand. 🍧
GOOD MORNING, DEAR NON-FRIENDS!
Yeah, because if you were my friends, we’d be throwing death stares at each other by the coffee machine every time someone dared to question my analysis. But instead, here I am—calm, composed, and totally not petty.
Today, we’re talking about EUR/USD. But first, a challenge: SHOW ME ANOTHER ANALYSIS FROM NOVEMBER THAT'S STILL ACCURATE TODAY.
Go check the related article. Do yourself a favor, so maybe you’ll stop busting my chops at the coffee machine. Oh, by the way, got a spare euro? No? Alright, no analysis for you.
Just kidding, just kidding. I know you’re smart, humble, and definitely not thin-skinned… or at least, I hope so, otherwise, get ready for another lawsuit.
Anyway, let’s be clear—my analysis is NOT financial advice.
No, you don’t need to mortgage your house and bet it all. Also, let’s be real, you don’t even have one! 😆
LET’S GET TO THE POINT.
Back in November, I called the U.S. recession.
Guess who didn’t call me? Bloomberg.
Guess who did? An investment fund.
And guess how it went? Badly. My spoken English is worse than a drunk tourist trying to order a beer in a London pub, so I panicked and hung up. 📞❌
Unless you want to talk money 💰 or women 💃, don’t call me. Write me. But again—only for money or women, not for emotional support. I’m not your therapist.
EUROPE, REARMAMENT, AND THE CIRCUS OF POWER.
Same old show:
The tall blond guy with the orange face? Check.
The bald dude in the tie? Still there.
The political circus? In full swing. 🎭
But let’s cut to the chase: if you’re in the Eurozone, BUY A HOUSE.
I did— 180K for 122 square meters of prime real estate. Solid deal.
And why?
Because the euro is set to rise. 📈
Because Russia is in an economic lockdown.
Because when sanctions lift, we’ll likely see a mini Russian market collapse.
And the dollar? The U.S. is reliving 2008, but this time, it’s even dumber.
What’s different? Instead of subprime mortgages, now it’s credit card debt spiraling out of control.
Yes, you heard me. Americans are sinking their economy with loans for iPhones, 85-inch TVs, and vacations to Hawaii.
And banks?
“No worries, the debt is under control.”
Oh yeah? So if you’re 100K in debt for a house, that’s a crisis, but if you blow 100K on home decor and luxury junk, that’s fine? Make it make sense.
But who cares—I’m Italian, I eat pasta for breakfast. 🍝 Their problem, not mine.
NOW, THE TECHNICAL ANALYSIS.
Trend is BULLISH, get that in your head. Look for long setups, not shorts. If you must short, do it only for retracements.
Reversal zone: 1.082 – 1.095.
If it closes above, we keep going up.
Watch out for liquidity between 1.099 and 1.10.
If price gets there, look for a key level on the 4H. If it reacts bearish, wait for confirmation before shorting. If it closes above, we send it to 1.21.
Other key support levels:
1.076 – 1.062, solid area for bullish reaction.
If that’s not enough, 1.060 – 1.052 is the ultimate buy zone.
If you mess up, toss your PC. 💻🔥
Kidding. Hold on tight, because price is going up from there.
IF MY ANALYSIS HELPED YOU, HIT FOLLOW, DROP A BOOST, LEAVE A COMMENT.
Or else… I’ll have to come find you.
Much love, PipGuard.

EUR/USD Dips as US Dollar Gains Ahead of Fed DecisionAs I write this article during the European session on Wednesday, the EUR/USD currency pair has slipped below the 1.09035 mark, following its recent ascent to a five-month peak of approximately 1.0955 just a day earlier. The decline in this prominent currency pair can be attributed to the strengthened performance of the US Dollar (USD) in anticipation of the upcoming interest rate decision from the Federal Reserve (Fed). The US Dollar Index (DXY), which measures the Greenback's value against a basket of six major currencies, has surged to around 103.70 after previously touching a five-month low of about 103.20 on Tuesday. From a technical standpoint, the price has approached our Supply area, prompting us to anticipate a retest of the entry point for a potential 2X trade opportunity.
✅ Please share your thoughts about EURUSD in the comments section below and HIT LIKE if you appreciate my analysis. Don't forget to FOLLOW ME; you will help us a lot with this small contribution.

XAU/USD Trading Plan – Preparing for Volatility Ahead of FOMC! ⚠️This week, all eyes are on the FOMC meeting on March 19, where the Federal Reserve will announce its interest rate decision and economic outlook. Gold remains in a bullish trend, but it has now reached a key resistance zone that could trigger a correction before determining the next move.
⚠ Important Note: This plan is only valid before the FOMC meeting. As the announcement approaches, traders are advised to close their positions to protect their accounts, as high volatility is expected.
🔥 Fundamental Analysis – What to Expect from the FOMC This Time?
📌 1️⃣ The Fed is Expected to Keep Rates at 4.25% - 4.5%, But…
Dot Plot & Summary of Economic Projections (SEP) will shape market expectations for the future.
If the Fed remains hawkish, the USD could strengthen, putting pressure on gold.
If the Fed signals a dovish stance, the USD could weaken, potentially pushing gold higher.
📌 2️⃣ Global Central Banks Continue to Buy Gold
China, Russia, Poland, and India continue to increase their gold reserves, reducing their reliance on the USD.
This trend supports long-term bullish prospects for gold, although there could be short-term corrections.
📉 Technical Analysis – Key Levels for XAU/USD
🔹 Main Trend: Bullish, but facing strong resistance.
🔹 Price Channel: Gold is still in an uptrend, but a short-term correction may occur.
📌 Key Levels to Watch:
📍 Resistance:
3,055 - 3,071 – If gold fails to break through this level, a correction could follow.
📍 Support:
3,021 - 3,009 – Watch this area in case of a pullback.
2,986 - 2,948 (FVG Zone on H1) – A deeper liquidity level if selling pressure increases.
🎯 Trading Plan – Pre-FOMC Strategy
BUY ZONE: 3010 - 3008
SL: 3004
TP: 3015 - 3020 - 3024 - 3028 - 3032
SELL ZONE: 3054 - 3056
SL: 3060
TP: 3050 - 3046 - 3042 - 3038 - 3030
⚠ Important Warning:
Ahead of the FOMC, consider closing all positions to avoid unnecessary risks, as market reactions can be unpredictable.
🔥 A major wave from the FOMC is coming – trade wisely and protect your capital! 🚀

Euro Climbs on German Deal, Awaits Fitch RatingThe euro climbed toward $1.09, nearing its highest since early November, as Germany agreed on debt reform and increased spending. Chancellor-elect Friedrich Merz secured a deal with the Green and Social Democrat parties ahead of next week’s parliamentary vote.
Markets await Fitch’s rating decision on France, which is due after Friday’s close. Meanwhile, trade tensions rose as Trump threatened a 200% tariff on European wines in response to the EU’s tax on American whiskey. On geopolitics, Trump called his talks with Putin on Ukraine “very good,” expressing optimism for a resolution.
Key resistance is at 1.0950, followed by 1.1000 and 1.1050. Support stands at 1.0800, with further levels at 1.0730 and 1.0650.
2 reasons the peso rally may not be over The USD/MXN has fallen over 2.5% in the past five trading sessions, dropping below 19.9 per USD for the first time since November 2024.
Two key factors could be driving this move:
1.
Investor distrust in the U.S. dollar – Market confidence is weakening due to Trump’s inconsistent tariff threats and other unpopular policies.
In contrast, the Sheinbaum government’s kid-glove handling of Trump is securing favourable trade concessions.
2.
Attractive interest rate differential – With Banxico’s benchmark rate at 9.5%, the peso remains appealing for carry trades.
The Federal Reserve’s decision this week could widen this gap further. Last week’s subdued U.S. inflation data is helping to fuel speculation of earlier Fed rate cuts, which may continue to support the peso despite trade uncertainties.
