USD_CAD POTENTIAL LONG|
✅USD_CAD went down to retest
A horizontal support of 1.3560
Which makes me locally bullish biased
And I think that a move up
From the level is to be expected
Towards the target above at 1.3652
LONG🚀
✅Like and subscribe to never miss a new idea!✅
Disclosure: I am part of Trade Nation's Influencer program and receive a monthly fee for using their TradingView charts in my analysis.
Forex-trading
EUR-AUD Will Fall! Sell!
Hello,Traders!
EUR-AUD keeps trading in
A strong uptrend and the pair
Is locally overbought so as the
Pair is retesting a horizontal
Resistance of 1.8019 from
Where we will be expecting
A local pullback on Monday
Sell!
Comment and subscribe to help us grow!
Check out other forecasts below too!
Disclosure: I am part of Trade Nation's Influencer program and receive a monthly fee for using their TradingView charts in my analysis.

EUR-NZD Risky Short! Sell!
Hello,Traders!
EUR-NZD made a retest
Of the local horizontal resistance
Of 1.9485 so despite the uptrend
We are locally bearish biased
And we will be expecting a
Local bearish correction
On Monday
Sell!
Comment and subscribe to help us grow!
Check out other forecasts below too!
Disclosure: I am part of Trade Nation's Influencer program and receive a monthly fee for using their TradingView charts in my analysis.

CAD_CHF GROWTH AHEAD|LONG|
✅CAD_CHF made a retest
Of the horizontal support
Of 0.5820 and we are already
Seeing a bullish reaction
So we will be expecting a
Further bullish move up
On Monday
LONG🚀
✅Like and subscribe to never miss a new idea!✅
Disclosure: I am part of Trade Nation's Influencer program and receive a monthly fee for using their TradingView charts in my analysis.

AUD-NZD Local Long! Buy!
Hello,Traders!
AUD-NZD is already making
A bullish rebound from the
Horizontal support of 1.0810
So we are locally bullish biased
And we will be expecting a
Further bullish move up
Buy!
Comment and subscribe to help us grow!
Check out other forecasts below too!
Disclosure: I am part of Trade Nation's Influencer program and receive a monthly fee for using their TradingView charts in my analysis.

GBP_AUD BEARISH BIAS|SHORT|
✅GBP_AUD is going up to retest
A horizontal resistance of 2.0892
Which makes me locally bearish biased
And I think that we will see a pullback
And a move down from the level
Towards the target below at 2.0805
SHORT🔥
✅Like and subscribe to never miss a new idea!✅
Disclosure: I am part of Trade Nation's Influencer program and receive a monthly fee for using their TradingView charts in my analysis.

EUR_AUD LOCAL CORRECTION|SHORT|
✅EUR_AUD is set to retest a
Strong resistance level above at 1.8020
After trading in a local uptrend for some time
Which makes a bearish pullback a likely scenario
With the target being a local support below at 1.7940
SHORT🔥
✅Like and subscribe to never miss a new idea!✅
Disclosure: I am part of Trade Nation's Influencer program and receive a monthly fee for using their TradingView charts in my analysis.

EUR-GBP Will Grow! Buy!
Hello,Traders!
EUR-GBP keeps trading in
A strong uptrend and the
Pair made a retest and a
Rebound from the horizontal
Support level around 0.8621
So we are bullish biased and
We will be expecting a
Further bullish move up
Buy!
Comment and subscribe to help us grow!
Check out other forecasts below too!
Disclosure: I am part of Trade Nation's Influencer program and receive a monthly fee for using their TradingView charts in my analysis.

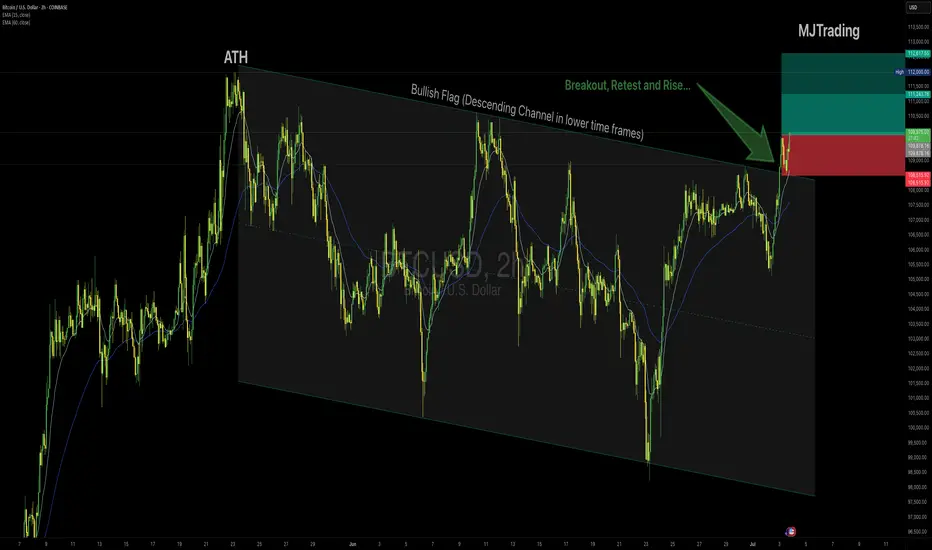
BTCUSD – Long Setup (2H Chart)👆👆🚀🚀Boost it if you like it (Thanks)🚀🚀👆👆
Idea:
Bitcoin is breaking out above the descending Flag after testing the upper boundary multiple times, showing bullish momentum confirmed by price holding above the 15 EMA and 50 EMA. The breakout aligns with strong impulse candles and sustained buying pressure.
Entry:
✅ Buy near $110,000
Stop Loss:
🔴 Below $108,500, under the breakout structure to protect against a false breakout.
Take Profit:
🟢 Tp1 $111,245
🟢 Tp2 $112,600
Rationale:
Clear breakout of the channel top resistance.
Bullish EMAs crossover with sustained slope.
Strong impulse move suggesting continuation.
Risk Management:
Position size accordingly, max risk 1–2% capital per trade.
#Bitcoin #BTCUSD #CryptoTrading #Breakout #LongSignal #TradingView #TechnicalAnalysis
CAD-CHF Local Long! Buy!
Hello,Traders!
CAD-CHF made a retest
Of the horizontal support
Of 0.5832 so we are locally
Bullish biased and we will be
Expecting a local bullish move up
Buy!
Comment and subscribe to help us grow!
Check out other forecasts below too!
Disclosure: I am part of Trade Nation's Influencer program and receive a monthly fee for using their TradingView charts in my analysis.

AUD_NZD WILL GROW|LONG|
✅AUD_NZD made a bullish
Rebound so we are bullish
Biased and we will be expecting
A further bullish move up
LONG🚀
✅Like and subscribe to never miss a new idea!✅
Disclosure: I am part of Trade Nation's Influencer program and receive a monthly fee for using their TradingView charts in my analysis.

GBP-AUD Short From Resistance! Sell!
Hello,Traders!
GBP-AUD made a retest of
The horizontal resistance
Around 2.0800 from where
We will be expecting a
Local bearish move down
Sell!
Comment and subscribe to help us grow!
Check out other forecasts below too!
Disclosure: I am part of Trade Nation's Influencer program and receive a monthly fee for using their TradingView charts in my analysis.

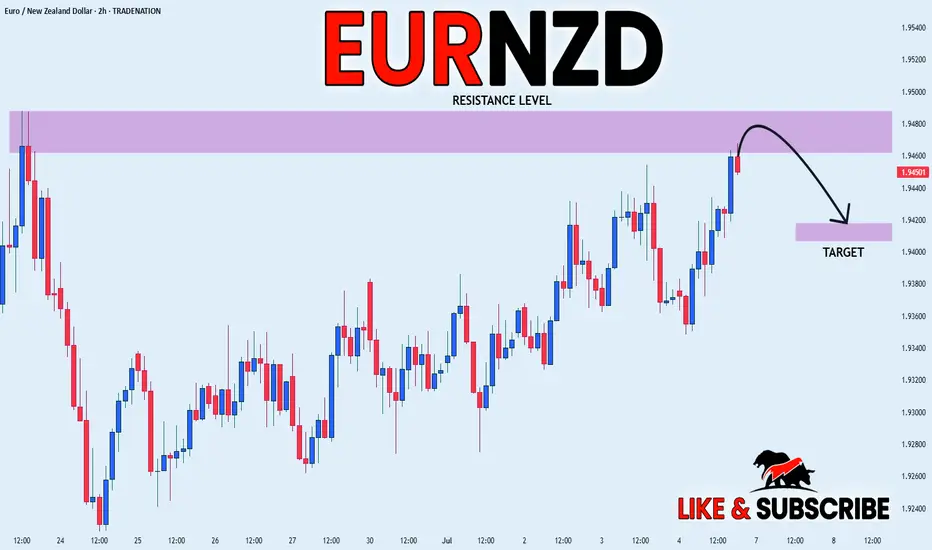
EUR_NZD LOCAL SHORT|
✅EUR_NZD is set to retest a
Strong resistance level above at 1.9488
After trading in a local uptrend for some time
Which makes a bearish pullback a likely scenario
With the target being a local support below at 1.9420
SHORT🔥
✅Like and subscribe to never miss a new idea!✅
Disclosure: I am part of Trade Nation's Influencer program and receive a monthly fee for using their TradingView charts in my analysis.
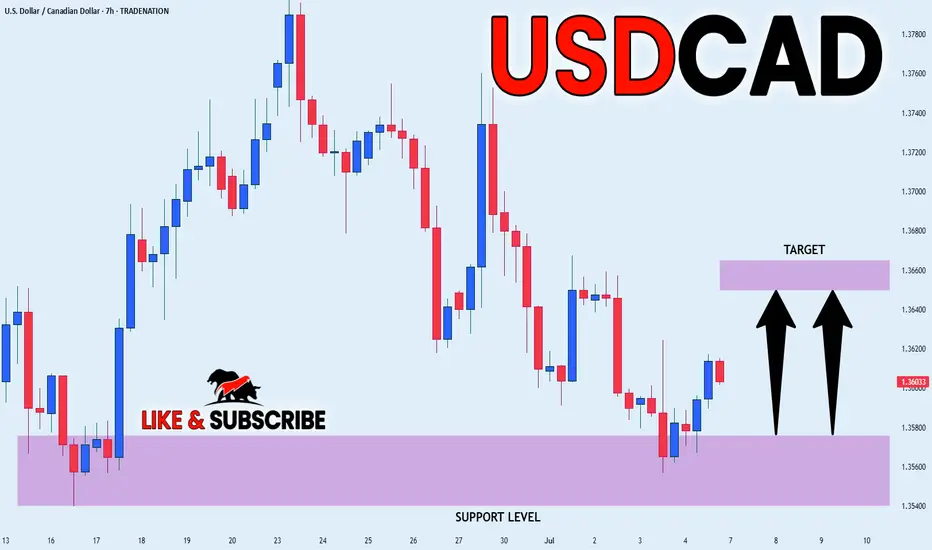
USD-CAD Local Rebound! Buy!
Hello,Traders!
USD-CAD is trading in a
Strong downtrend but
The pair made a retest
Of the horizontal support
Level of 1.3540 from where
We are already seeing a
Bullish rebound and we
Will be expecting a
Further move up
Buy!
Comment and subscribe to help us grow!
Check out other forecasts below too!
Disclosure: I am part of Trade Nation's Influencer program and receive a monthly fee for using their TradingView charts in my analysis.

MarketBreakdown | USDJPY, USDCAD, BITCOIN, SILVER
Here are the updates & outlook for multiple instruments in my watch list.
1️⃣ #USDJPY daily time frame 🇺🇸🇯🇵
The market nicely respected a rising trend line
and bounced from that, forming a high momentum bullish candle.
I think that the pair will continue rising and reach 145.8 level soon.
2️⃣ #USDCAD daily time frame 🇺🇸🇨🇦
The price is currently approaching an important confluence
zone based on a falling trend line and a horizontal support.
I will expect a pullback from that.
3️⃣ #BITCOIN #BTCUSD daily time frame
The price successfully violated a resistance line of a bullish
flag pattern and closed above that.
It is a critical bullish signal. I believe that the price will test
a current high then and will violate that with a high probability.
4️⃣ #SILVER #XAGUSD daily time frame 🪙
The market broke a resistance line of a bullish flag.
Uptrend is going to continue, and the price is going to reach 37,14 level soon.
Do you agree with my market breakdown?
❤️Please, support my work with like, thank you!❤️
I am part of Trade Nation's Influencer program and receive a monthly fee for using their TradingView charts in my analysis.

EUR-JPY Will Keep Growing! Buy!
Hello,Traders!
EUR-JPY is trading in an
Uptrend and the pair broke
The key horizontal level
Of 169.814 and the breakout
Is confirmed so after a potential
Retest of the support cluster
Of the rising and horizontal
Support lines below we will
Be expecting a bullish continuation
Buy!
Comment and subscribe to help us grow!
Check out other forecasts below too!
Disclosure: I am part of Trade Nation's Influencer program and receive a monthly fee for using their TradingView charts in my analysis.

AUD_JPY RISKY SHORT|
✅AUD_JPY is set to retest a
Strong resistance level above at 95.600
After trading in a local uptrend for some time
Which makes a bearish pullback a likely scenario
With the target being a local support below at 95.081
SHORT🔥
✅Like and subscribe to never miss a new idea!✅
Disclosure: I am part of Trade Nation's Influencer program and receive a monthly fee for using their TradingView charts in my analysis.

GBP_CAD BEARISH BREAKOUT|SHORT|
✅GBP_CAD broke the key structure level of 1.8580
While trading in an local downtrend
Which makes me bearish
And as the retest of the level is complete
Bearish continuation will follow
SHORT🔥
✅Like and subscribe to never miss a new idea!✅
Disclosure: I am part of Trade Nation's Influencer program and receive a monthly fee for using their TradingView charts in my analysis.

EUR-AUD Bearish Breakout! Sell!
Hello,Traders!
EUR-AUD was trading along
The rising support line but
Now we are seeing a bearish
Breakout so we are bearish
Biased and we will be expecting
A further bearish move down
Sell!
Comment and subscribe to help us grow!
Check out other forecasts below too!
Disclosure: I am part of Trade Nation's Influencer program and receive a monthly fee for using their TradingView charts in my analysis.

GBPCAD: Your Trading Plan Explained 🇬🇧🇨🇦
GBPCAD is coiling on an important daily support cluster.
To trade that with a confirmation, pay attention to
an inside bar pattern on a 4H.
1.8579 is the level of an upper boundary of its range.
Its breakout and a 4H candle close above will provide
a strong bullish signal.
A bullish movement will be expected to 1.865 level then.
❤️Please, support my work with like, thank you!❤️
I am part of Trade Nation's Influencer program and receive a monthly fee for using their TradingView charts in my analysis.

EUR_GBP BULLISH BIAS|LONG|
✅EUR_GBP broke the key
Structure level of 0.8620
While trading in an local uptrend
Which makes me bullish
And I think that after the retest
Of the broken level is complete
A rebound and bullish continuation will follow
LONG🚀
✅Like and subscribe to never miss a new idea!✅
Disclosure: I am part of Trade Nation's Influencer program and receive a monthly fee for using their TradingView charts in my analysis.

AUD-USD Very Strong Uptrend! Buy!
Hello,Traders!
AUD-USD is trading in a
Very strong uptrend and
The pair broke a key horizontal
Level around 0.6540 which
Is now a support and we
Are already seeing a rebound
So we are bullish biased
And we will be expecting
A further move up
Buy!
Comment and subscribe to help us grow!
Check out other forecasts below too!
Disclosure: I am part of Trade Nation's Influencer program and receive a monthly fee for using their TradingView charts in my analysis.

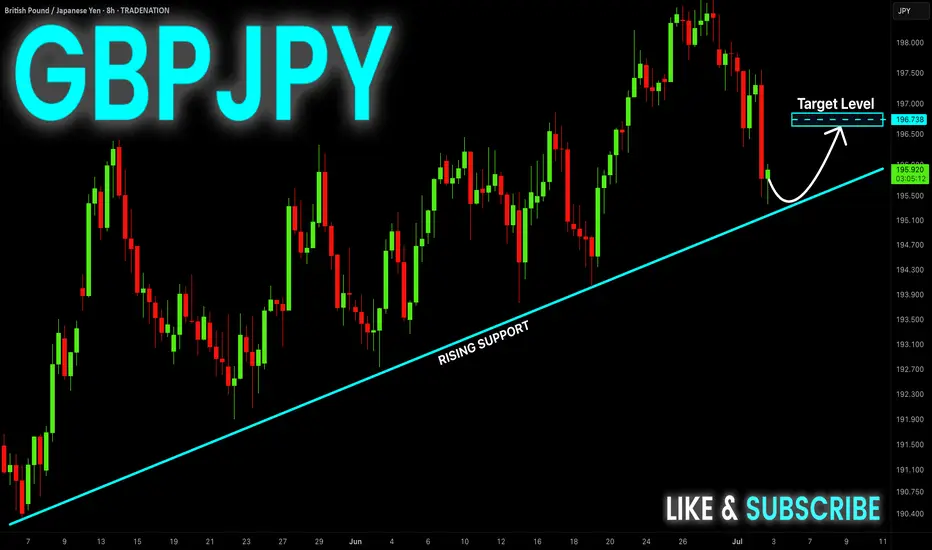
GBP-JPY Correction Ahead! Buy!
Hello,Traders!
GBP-JPY will soon make
A retest of the rising support
Line and as we are bullish
Biased we will be expecting
A local bullish correction
Buy!
Comment and subscribe to help us grow!
Check out other forecasts below too!
Disclosure: I am part of Trade Nation's Influencer program and receive a monthly fee for using their TradingView charts in my analysis.