GBP_CAD WILL KEEP GROWING|LONG|
✅GBP_CAD is trading in an
Uptrend and the pair made a
Retest and a rebound from the
Horizontal support of 1.8675
So we are bullish biased and
We will be expecting a
Further bullish move up
LONG🚀
✅Like and subscribe to never miss a new idea!✅
Disclosure: I am part of Trade Nation's Influencer program and receive a monthly fee for using their TradingView charts in my analysis.
Forex-trading

NZD-CAD Swing Short! Sell!
Hello,Traders!
NZD-CAD keeps growing
In an uptrend but the pair
Will soon retest a wide
Horizontal resistance level
Around 0.8350 so after the
Retest we will be expecting
A bearish pullback
Sell!
Comment and subscribe to help us grow!
Check out other forecasts below too!
Disclosure: I am part of Trade Nation's Influencer program and receive a monthly fee for using their TradingView charts in my analysis.

AUD_CHF BEARISH BREAKOUT|SHORT|
✅AUD_CHF is going down currently
As the pair broke the key structure level of 0.5240
Which is now a resistance, and after the pullback
And retest, I think the price will go further down
SHORT🔥
✅Like and subscribe to never miss a new idea!✅
Disclosure: I am part of Trade Nation's Influencer program and receive a monthly fee for using their TradingView charts in my analysis.

EUR-CHF Long From Support! Buy!
Hello,Traders!
EUR-CHF is trading in a
Parallel range and we see
A rejection from the horizontal
Support area below around 0.9293
And we are already seeing a bullish
Reaction so a further move up
Is to be expected
Sell!
Comment and subscribe to help us grow!
Check out other forecasts below too!
Disclosure: I am part of Trade Nation's Influencer program and receive a monthly fee for using their TradingView charts in my analysis.

AUDJPY: Bullish Move From Support 🇦🇺🇯🇵
There is a high chance that AUDJPY will bounce
from the underlined horizontal support.
The price formed a bullish imbalance candle after its test.
I expect a rise to 94.49 level.
❤️Please, support my work with like, thank you!❤️
I am part of Trade Nation's Influencer program and receive a monthly fee for using their TradingView charts in my analysis.

NZD_JPY WAIT FOR BREAKOUT|LONG|
✅NZD_JPY is trading in an
Uptrend and the pair has formed
A bullish triangle pattern
And we are bullish biased
So IF we see a bullish breakout
It will be our signal that
A bullish continuation is
Likely and we will be
Able to enter a long trade
LONG🚀
✅Like and subscribe to never miss a new idea!✅
Disclosure: I am part of Trade Nation's Influencer program and receive a monthly fee for using their TradingView charts in my analysis.

CAD_CHF WILL KEEP FALLING|SHORT|
✅CAD_CHF broke the key structure level of 0.5840
While trading in a strong downtrend
Which makes me bearish
And I think that after the retest of the broken level is complete
A rebound and bearish continuation will follow
SHORT🔥
✅Like and subscribe to never miss a new idea!✅
Disclosure: I am part of Trade Nation's Influencer program and receive a monthly fee for using their TradingView charts in my analysis.

CAD-JPY Bullish Bias! Buy!
Hello,Traders!
CAD-JPY keeps trading
In an uptrend along the
Rising support line and
We are already seeing a
Bullish rebound so we are
Bullish biased and we will
Be expecting a further
Bullish move up
Buy!
Comment and subscribe to help us grow!
Check out other forecasts below too!
Disclosure: I am part of Trade Nation's Influencer program and receive a monthly fee for using their TradingView charts in my analysis.

GBP-CHF Bearish Breakout! Sell!
Hello,Traders!
GBP-CHF formed a H&S
Pattern and now we are
Seeing a strong bearish
Breakout of the neckline
Key level around 1.0933
Area and as the breakout
Is confirmed we will be
Expecting a further bearish
Move down towards the
Target below around 1.0867
Sell!
Comment and subscribe to help us grow!
Check out other forecasts below too!
Disclosure: I am part of Trade Nation's Influencer program and receive a monthly fee for using their TradingView charts in my analysis.

XAUUSD 4hour TF - June 29th, 2025XAUUSD 4hour Neutral Idea
Monthly - Bullish
Weekly - Bullish
Daily - Bullish
4hour - Bearish
Gold has been on the rally of a century for a while and isn’t showing too many signs of slowing down long term. For now we do have a couple opportunities I can bring to your attention.
4hour bearish continuation - For this to happen we would like to see price action come back to our pocket of confluence near the 3,320.000 level followed by bearish conviction. If this happens look to target lower toward major support levels like 3,225.500.
4hour trend reversal - If we are to see a reversal of the 4hour trend we would need to see price action pop back above the 3,320.000 resistance area. Look for strong bullish conviction above this level and target higher toward appropriate levels of resistance.

EURJPY 4hour TF - June 29th, 2025EURJPY 4hour Bullish Idea
Monthly - Bullish
Weekly - Bullish
Daily - Bullish
4hour - Bullish
EJ has been in a bullish trend on all timeframes and doesn’t really show any signs of stopping. Currently we are right near major monthly resistance around 171.000. It is likely we will see price action push into this zone but we want to identify a potential trade beforehand.
Here are two potential scenarios for this week on EJ
Bullish Continuation - We are a bit close to the 171.000 monthly zone so we would like to see price action come back to our 168.500 4hour support zone before targeting higher.
Trend Reversal - If we see price action fall below 168.500 we want to see bearish conviction and rejection from that same zone. If this happens we can start to consider short scenarios and target lower support levels like 166.250.

EUR_AUD LOCAL SHORT|
✅EUR_AUD is going up now
But a strong resistance level is ahead at 1.8018
Thus I am expecting a pullback
And a move down towards the target of 1.7900
SHORT🔥
✅Like and subscribe to never miss a new idea!✅
Disclosure: I am part of Trade Nation's Influencer program and receive a monthly fee for using their TradingView charts in my analysis.

USDJPY Daily TF - June 29th, 2025USDJPY Daily Neutral Idea
Monthly - Bullish
Weekly - Bearish
Daily - Bearish
I’m looking at the Daily time frame here as this is the only clear picture for price action in terms of trends. The 4hour looks like price action can’t make a decision so we will wait for price action to get closer to some major zones.
Bearish Continuation - Ideally, we want to see price action touch 147.500 again followed by convincing bearish rejection. Look to target lower toward major support levels if this happens.
Aside from this potential setup we don’t have much to look at here on UJ.

AUDJPY 4hour TF - June 29th, 2025AUDJPY 4hour Neutral Idea
Monthly - Bullish
Weekly - Bearish
Dailly - Bearish
4hour - Ranging
AJ is currently sitting at a major daily resistance area around 94.500. We have to wait for price action to make a move and show some conviction before we can become confident in a setup.
Lucky us, price action is usually easy to follow when waiting for a break of a range. The way I see it, we have two great options.
Bullish Breakout - In the scenario where we see price action break above the 94.500 zone we will look for long setups. Ideally, we spot some clear higher lows above 94.500 with strong bullish conviction. Look to target higher resistance levels like 96.500.
Bearish Continuation - If we see this resistance level at 94.500 continue to hold we could see a daily bearish continuation happen. Look for strong bearish candles rejecting the current zone followed by clear lower highs. We’re targeting lower if that happens to around the 92.000 area.

AUDUSD 4hour TF - June 29th, 2025AUDUSD 4hour Neutral idea
Monthly - Bearish
Weekly - Bearish
Dailly - Bullish
4hour - Bullish
AU has been in this subtle bullish channel since late April 2025, just above major monthly support at 0.63250 area.
We also have some conflicting trends and we need to see some conviction before we can comfortably follow price action. We do have some alignment with a bearish USD but at the moment we have two options:
Bullish Continuation - This is the most likely scenario based on what we’re seeing and where price action is. Ideally, we see some rejection from our 4hour 0.65000 support area followed by bullish conviction. If this happens look for price action to touch or break the top of this channel and continue bullish for the week ahead.
Reversal back into channel - If we fail to see bullish presence we could see price action fall back into the channel. The key indication of this would be a break below our 0.65000 support area followed by a retest and bearish conviction.

NZD-JPY Potential Short! Sell!
Hello,Traders!
NZD-JPY is slowly approaching
A horizontal resistance level
Around 87.994 so despite
The strong uptrend
We will be expecting a
Local bearish pullback on Monday
Sell!
Comment and subscribe to help us grow!
Check out other forecasts below too!
Disclosure: I am part of Trade Nation's Influencer program and receive a monthly fee for using their TradingView charts in my analysis.
GBP_CHF RISKY LONG|
✅GBP_CHF fell down sharply
But a strong support level was hit at 1.0932
Thus as a rebound is already happening
A move up towards the target of 1.0970 shall follow
LONG🚀
✅Like and subscribe to never miss a new idea!✅
Disclosure: I am part of Trade Nation's Influencer program and receive a monthly fee for using their TradingView charts in my analysis.

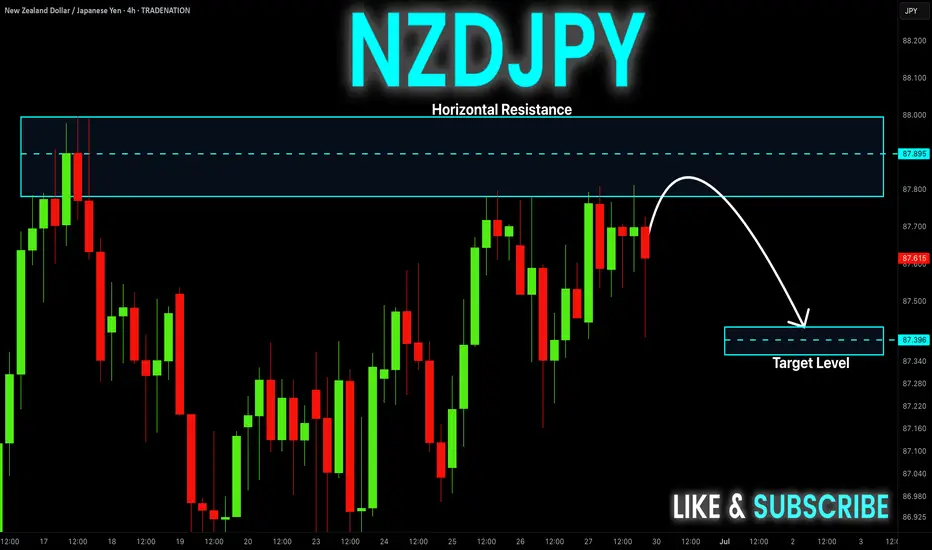
NZD_JPY SHORT FROM RESISTANCE|
✅NZD_JPY is set to retest a
Strong resistance level above at 88.000
After trading in a local uptrend for some time
Which makes a bearish pullback a likely scenario
With the target being a local support below at 87.341
SHORT🔥
✅Like and subscribe to never miss a new idea!✅
Disclosure: I am part of Trade Nation's Influencer program and receive a monthly fee for using their TradingView charts in my analysis.

CHF-JPY Local Long! Buy!
Hello,Traders!
CHF-JPY is trading in a strong
Uptrend and the pair made a
Bullish breakout from the bullish
Triangle pattern and is now seems
To be consolidating above the
Support cluster around 180.740
So we are bullish biased and
We will be expecting a further
Bullish move up on Monday
Buy!
Comment and subscribe to help us grow!
Check out other forecasts below too!
Disclosure: I am part of Trade Nation's Influencer program and receive a monthly fee for using their TradingView charts in my analysis.

AUD_NZD LOCAL LONG|
✅AUD_NZD is trading along the rising support line
And as the pair is going up now
After the retest of the line
I am expecting the price to keep growing
To retest the supply levels above at 1.0789
LONG🚀
✅Like and subscribe to never miss a new idea!✅
Disclosure: I am part of Trade Nation's Influencer program and receive a monthly fee for using their TradingView charts in my analysis.

USD-CHF Will Fall! Sell!
Hello,Traders!
USD-CHF keeps falling down
And the pair broke the key
Horizontal level of 0.8090
Decisively so we are bearish
Biased and we will be expecting
A further move down next week
Sell!
Comment and subscribe to help us grow!
Check out other forecasts below too!
Disclosure: I am part of Trade Nation's Influencer program and receive a monthly fee for using their TradingView charts in my analysis.

EUR-NZD Bullish Bias! Buy!
Hello,Traders!
EUR-NZD is trading in a
Strong uptrend and the pair
Is printing higher highs and
Higher lows while breaking
Important key levels such
As 1.9270 which is now
A support and the pair
Is consolidating above the
New support so we are
Bullish biased and we will
Be expecting a further move
Further up on Monday
Buy!
Comment and subscribe to help us grow!
Check out other forecasts below too!
Disclosure: I am part of Trade Nation's Influencer program and receive a monthly fee for using their TradingView charts in my analysis.

GBP-CHF Rebound Ahead! Buy!
Hello,Traders!
GBP-CHF is hovering above
The wide horizontal demand
Level around 1.0926 from
Where we are already
Seeing a bullish rebound
So a further local bullish
Move up is to be expected
Buy!
Comment and subscribe to help us grow!
Check out other forecasts below too!
Disclosure: I am part of Trade Nation's Influencer program and receive a monthly fee for using their TradingView charts in my analysis.
