USD/JPY : Short entry** Hey guys whats up
Accumulation of :
Breakout and retest of red trendline
Fibonacci confluance
Bearish structure
Resistance zone
Good luck ! :)
Forex-usdjpy

USDJPY possible short revisionMy last chart was a little messed up. Click on the note tabs for my take on the different types of analysis (candlestick, technical, fundamental, sentiment)

USDJPY possible short Look at my chart's notes for a full scope on my technical, sentiment, candlestick, and fundamental analysis.

USD/JPY (8/1/17) *Still Potential BEARThis pair is early on the sell side, more slide shall unfold.
I am standing with slight bearishness, and do not add aggressively just yet.
As for now going to 112.5x region is easily reachable.
Trade Safe,
s0nic

USDJPY Long to 116.00 ? Potential sell trap ? It looks like we may be looking at a potential continuation of the bullish run on this pair as it looks as though the price dip around 113.00 just so happened to be a sell trap. However another break below 113.50 will be confirmation of further bearish movement. For early entries now would be a good opportunity to jump in (114.05) however a break above the resistance area of 114.40 will be confirmation of further bullish movement.

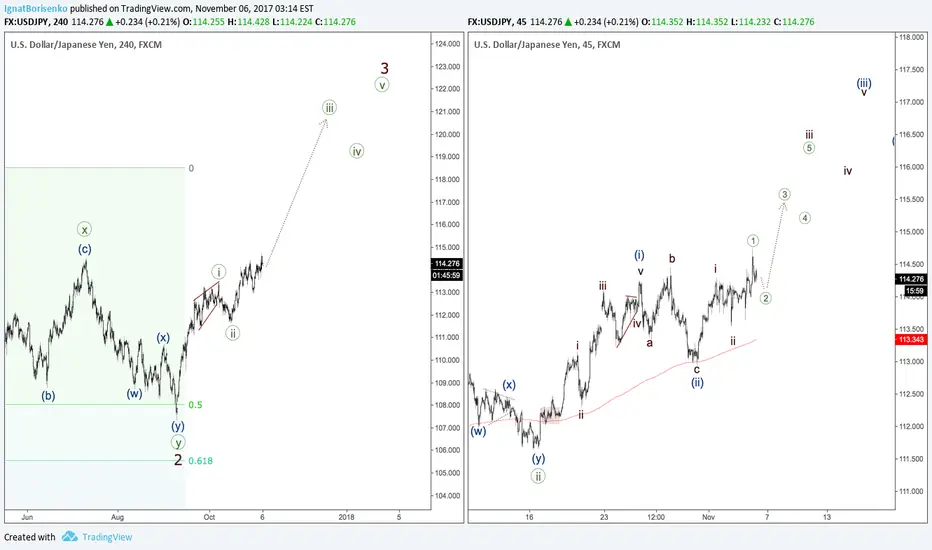
USDJPY - bullish third waveIt's likely that we're going to have another bullish impulse pretty soon.

USD/JPY (1/11/17) *UP to +320 pips potential trade set upPreviously, USD/JPY was riding well the pullback of USD.
Since I am expecting USD to turn back weaker and JPY to strength, this pair becomes a good contender for a short entry.
It is now near a nice tripple top. It may swing up more first, just to slide back down. That scenario is highly possible.
If the trade goes as per plan. it can swing back to 111.27 level and we can potential net up to +320 pips.
Let's see
S0nic

USDJPY LongHey Guys, We are keeping our bias bullish for UJ over the next few weeks and have identified a potential area where this chart may find a higher low structure level at 113.200. This is based on a support and resistance level which has been tested on both sides and a previous higher high point. We have a target of 114.778 and a stop loss at 112.900 giving us a very good risk reward of 5.26/1.

Will we get a breakout today?Hey guys!
Just spotted this today and I want to see what your thoughts are on this USDJPY H1 triangle break.
Are you keeping an eye on this?
We think you should!
We have the recommend long or short depending on what this pair wants to do in the next few hours. We will keep you up-to-date on this as the day goes.
This may be a good trade to take at the beginning of next week but we will have to wait and see.
Let us know what you see!
Thanks,
-Team/ Trading Strategy Guides

USDJPY in traingleIt looks like USDJPY is closed in traingle. After the break out downwards price was stagnated in the next lower consolidation in triangle. We are keeping our sell expecting to price will go down. If price will break out upwards we will close our sell trade. We must also watch out for false breakouts.

USDJPY SELLUSDJPY break out down of range where price stayed since end of semptember. As we told earlier, this should be correction of previous growth and price should go to support zone at 110.60-111.00. Aggresive traders could sell with a small stop loss. Conservative trades could wait for a pullback to the broken zone.

USDJPY still in rangeUSDJPY sill stay in range 112.25 -113.25 since 27 september. In friday at NFP publications we have false breakout but price quick back to the range. Daily friday pinbar could suggest quick breakout lower, but today session doesn't give us conclusion. Still waiting for breakout.

USDJPY expecting correctionUSDJPY is growing from the begining of september without larger correction. In the last days growth rate has decreased and USDJPY stay in local range 112.20-113.20. Today price break out up but it fast back to the range and now price drawing pinbar. All looks like price finally will breakout down, will make correction to support zone 110.70-111.00 and than will go to the resistance level at 114.30.

Bullish Bat PatternPotential Bullish Bat Pattern Forming
Entry at D-Completion
Target 1 at .382
Target 2 at .618
Stop Loss at 1.13

USD/JPY (29/9/17) *Bull trend but small swing down possibleThe pairs look exhausted and the swing back may well on the way.
Traders can look for a nice swing down.
Just be careful that, we are still in for BULL trend.
Trade Safe,
s0nic
Disclaimer :
This analysis not include personal feeling/opinion, and pure base on technical analysis
Trading foreign currencies can be a challenging and potentially profitable opportunity for investors. However, before deciding to participate in the Forex market, you should carefully consider your investment objectives, level of experience, and risk appetite. Most importantly, do not invest money you cannot afford to lose.
please inform me with post a comment if it reach some critical point/break pattern, reach target/reach stop level.
or if there is any question about this analysis/need new update.
Because I'm not monitoring this chart all time.

Is USDJPY Overbought? I Think So, Really!USDJPY kicking stops and taking names. So, what goes up must come down. I mean, it has to go down one way or another. This harmonic pattern says it's oversold although I haven't quite figure out its name. Is it a shark?


USDJPY - second waveWave 2 is going to move on, but if a pullback from the 61.8% retracement level of wave 1 happens, there'll be an opportunity to have another upward impulse wave.

USDJPY - bullish storyWave (iii) may have been started, so there's an opportunity to have a huge bullish rally.

USDJPY SHORT TERM SELL #FOREXThe market has an opportunity for a short term sell. as it follows the down trend.
if the market doesn't break the trend channel there is a possible small downtrend.
if the market breaks trend channel wait for confirmation before entering long.
let the market break the counter trend line before entering the trade.
just practicing*

Yen Has More To Lose Two days ago USDJPY touched 1.5-month low at 109.92, and reversed the move right away, right now trading around 110.70. And all this happened despite rather dovish comments from Fed’s Bullard opposing to another rate hike before the year end.
Now the market is focused on US data. Recently, we have seen some disappointments, and the Fed looked less hawkish than it was expected. And this was the reason the USD was falling.
However, the labor data may help American currency. If number of new jobs exceeds 180K, it will be perceived positively. Andifwagesgrowthisabove 0.3%, itwilldriveUSDcrazy.
Today we need to pay attention to Non-Manufacturing ISM, as it’s one of the best leading indicators of Non-Farm Payrolls results, given the fact that 70% of employed Americans work in service sector.
If the numbers come up better than expected, USDJPY may target 111.00 followed by 111.70.

Go long a break above key resistance and Pivot high USDJPYAction to Take: Go Long, enter buy at 110418 stop
Take Profit Level: TP1 110746, TP2 111173 Stop Loss Level: 110224
Additional Factors:
Timeframe: ~ 24 hours
Total Risk of Account Equity: 2% or less
